

Trump Places 100 Home Ownership Cutoff On Proposed SFR Ban
Geographies Most Impacted, Private Lender Exposure, and More
The Wall Street Journal reported last week that the White House has settled on owners of 100 or more single-family homes as its definition of "large investors" in proposed legislation that would bar future investor purchases.
Prior to this, there hadn't been exact definitions of what constitutes a 'Wall Street' investment firm, and many assumed the threshold would be the industry standard of roughly 1,000 properties. That's roughly the cutoff between local/regional operators and true large investment managers buying single-family homes.
We previously wrote a post on which markets were likely to be most impacted if such legislation were put into effect using the industry standard cutoff of 1,000 properties owned.
We refreshed the analysis with updated figures to include owners of 100+ properties.
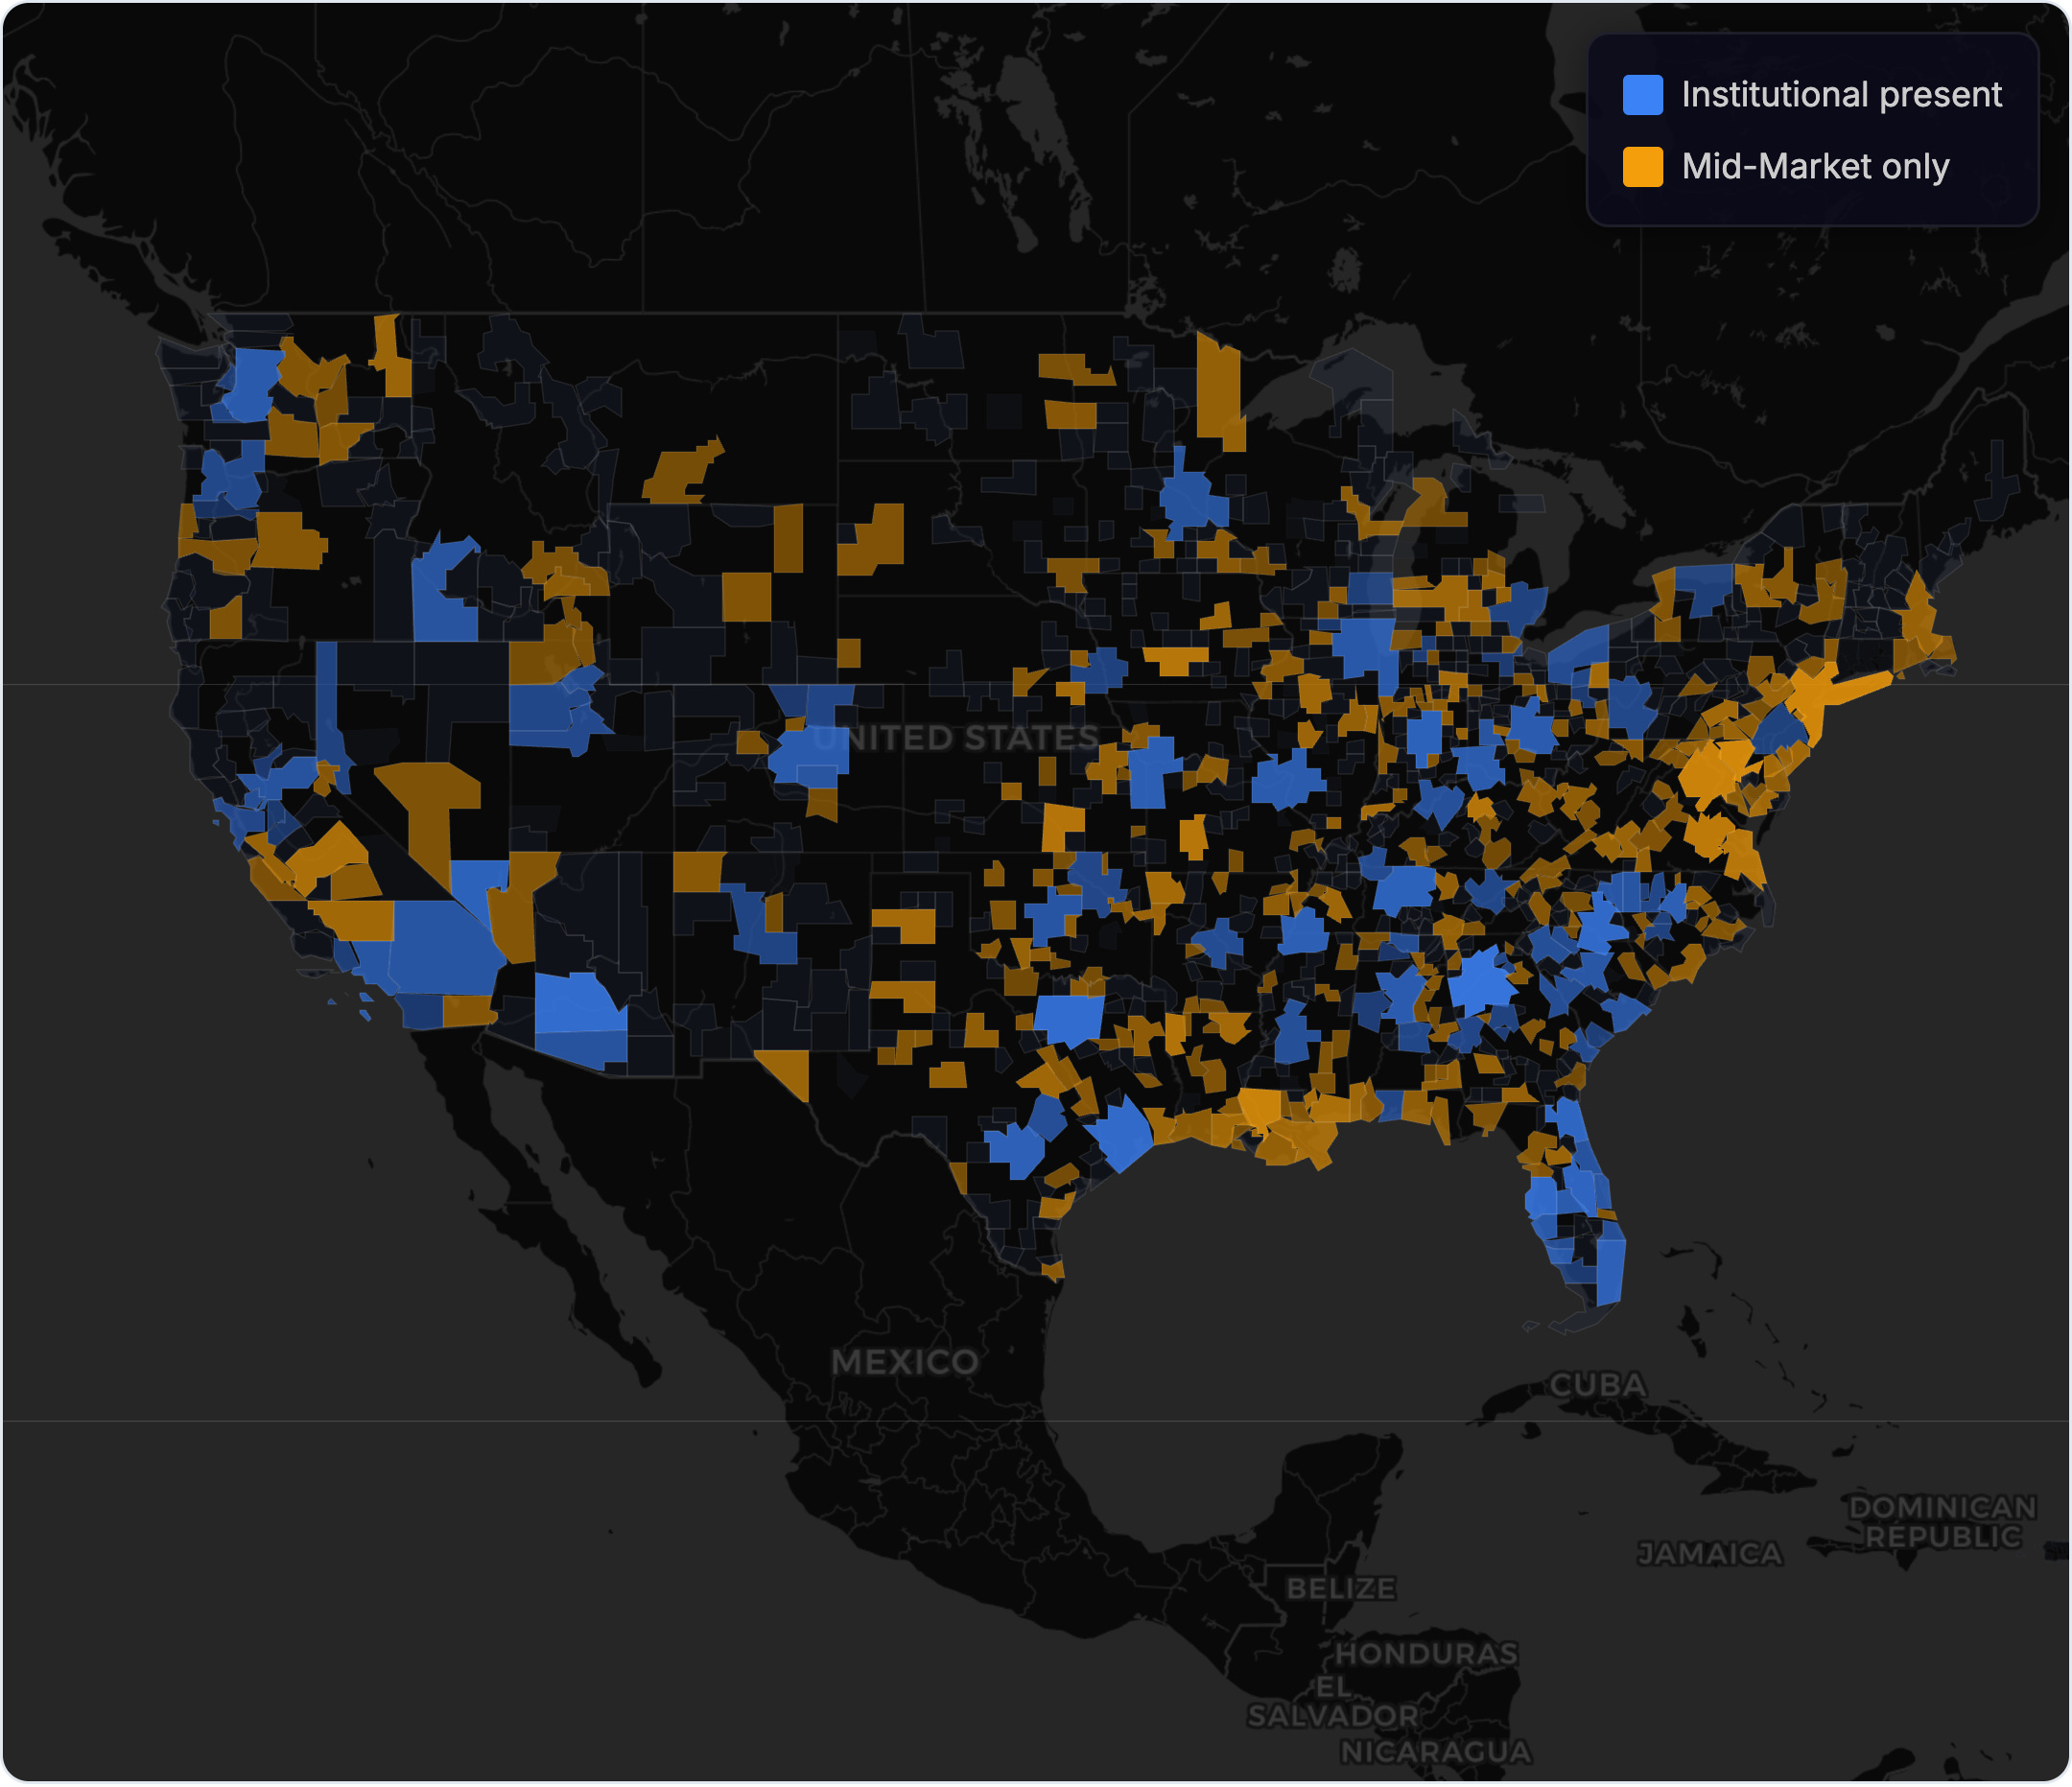
As you can see in the map above, there's a significant geographic shift in where mid-market operators (100–1,000 properties) are concentrated compared to institutional owners. Much of the Northeast rises in prominence, many tertiary markets in the Rust Belt and Southeast grow, and parts of the West Coast get added.
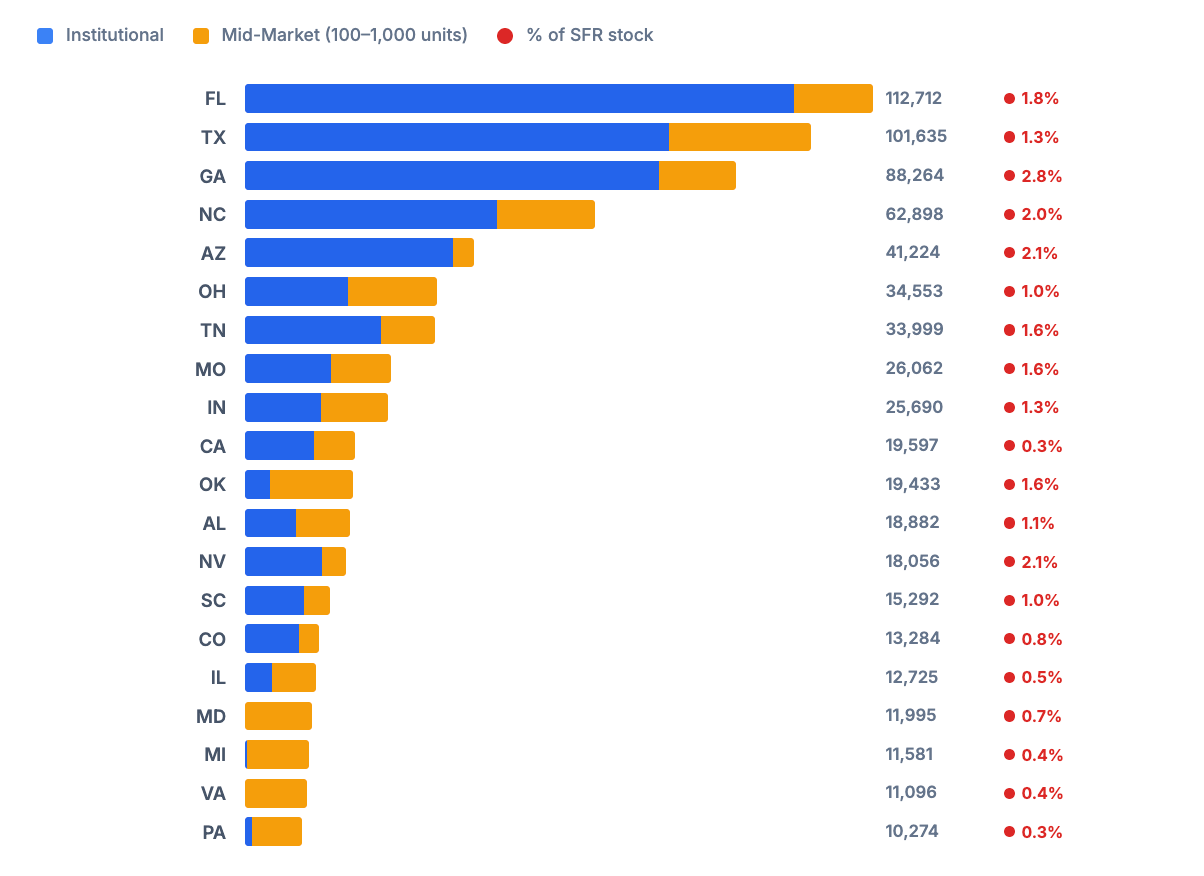
The mid-market operators alone don't add much, with less than 1% of single-family housing stock in most states owned by mid-market or institutional investors.
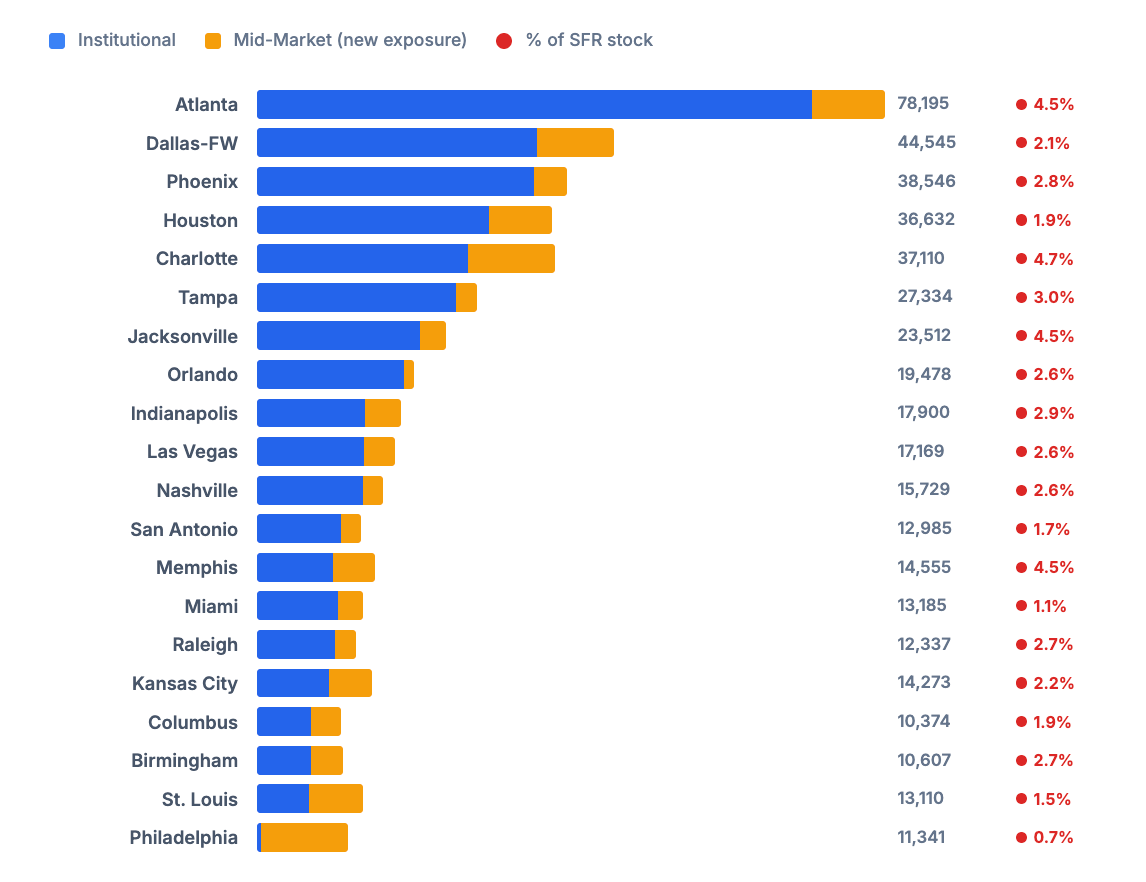
The metro-level view doesn't tell a much different story. Some of the largest markets reach 4% of housing stock owned by 100+ operators, but the share quickly drops back below 1%.
There Aren't Many Operators Who Own 100–1,000 Properties
By our methodology, there are 2,420 operators that hold 354K single-family rentals in the 100–1,000 unit range. Combined with institutional investors who own 1,000+ properties, this accounts for roughly 1% of the single-family housing stock.
Our numbers are smaller than what you'll see reported elsewhere for the 100–1,000 operator group because most methodologies simply look at how many properties share a given mailing address. That introduces a large number of false positives by capturing non-investors - universities, churches, city/county land banks, property manager mailing addresses, and financial advisors - which can overstate the number of properties owned by this group by 2x.
There are two primary groups of operators at this mid-market size: those who have built portfolios and are no longer acquiring, and those who still are.
Several groups bought up many properties post-GFC but stopped acquiring as home prices rose. 34% of these operators have not purchased a property in the last two years.
Then there are the mid-market investors who are still buying, but what exactly are they buying?
As previously noted in our 2025 rental acquisitions overview and our workforce housing post, the best-performing single-family rentals over the past few years have been workforce housing — smaller, older homes often purchased in need of repair, renovated, and rented out.
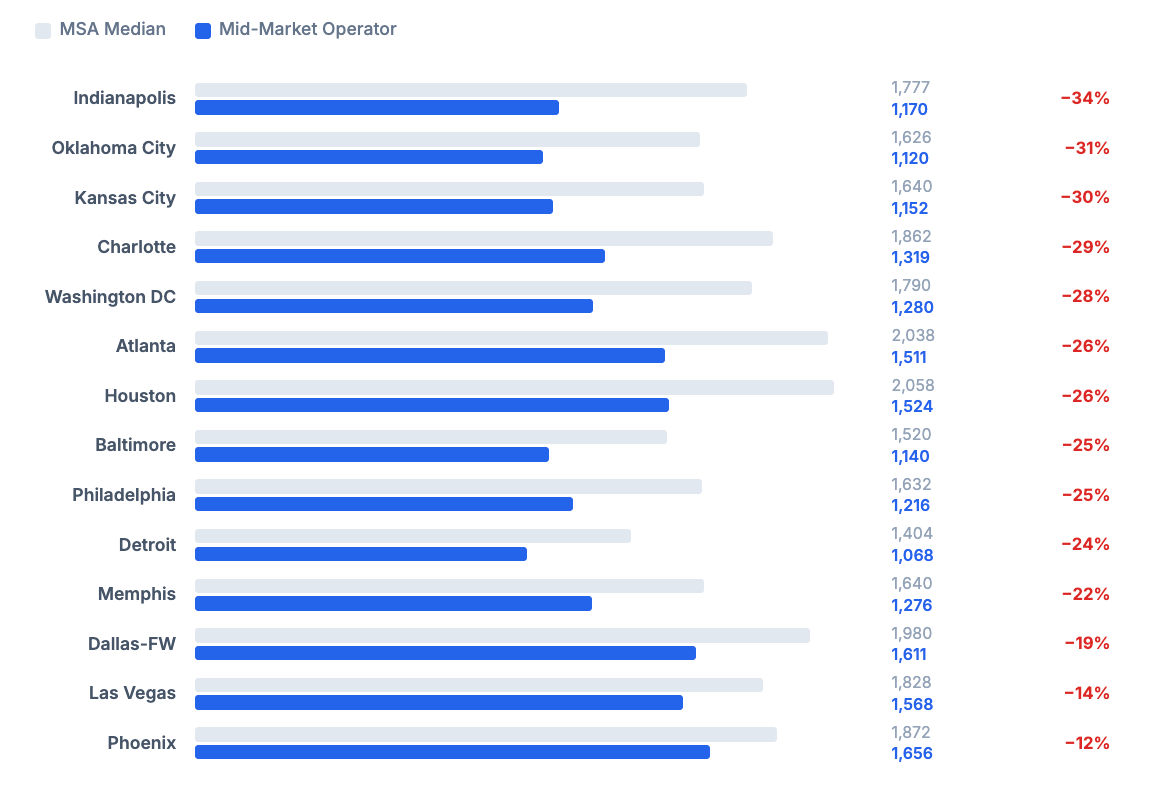
This is exactly what these mid-market operators are purchasing. Below you can see the average purchase price in an MSA for a single-family home versus the average price paid by the mid-market operator.
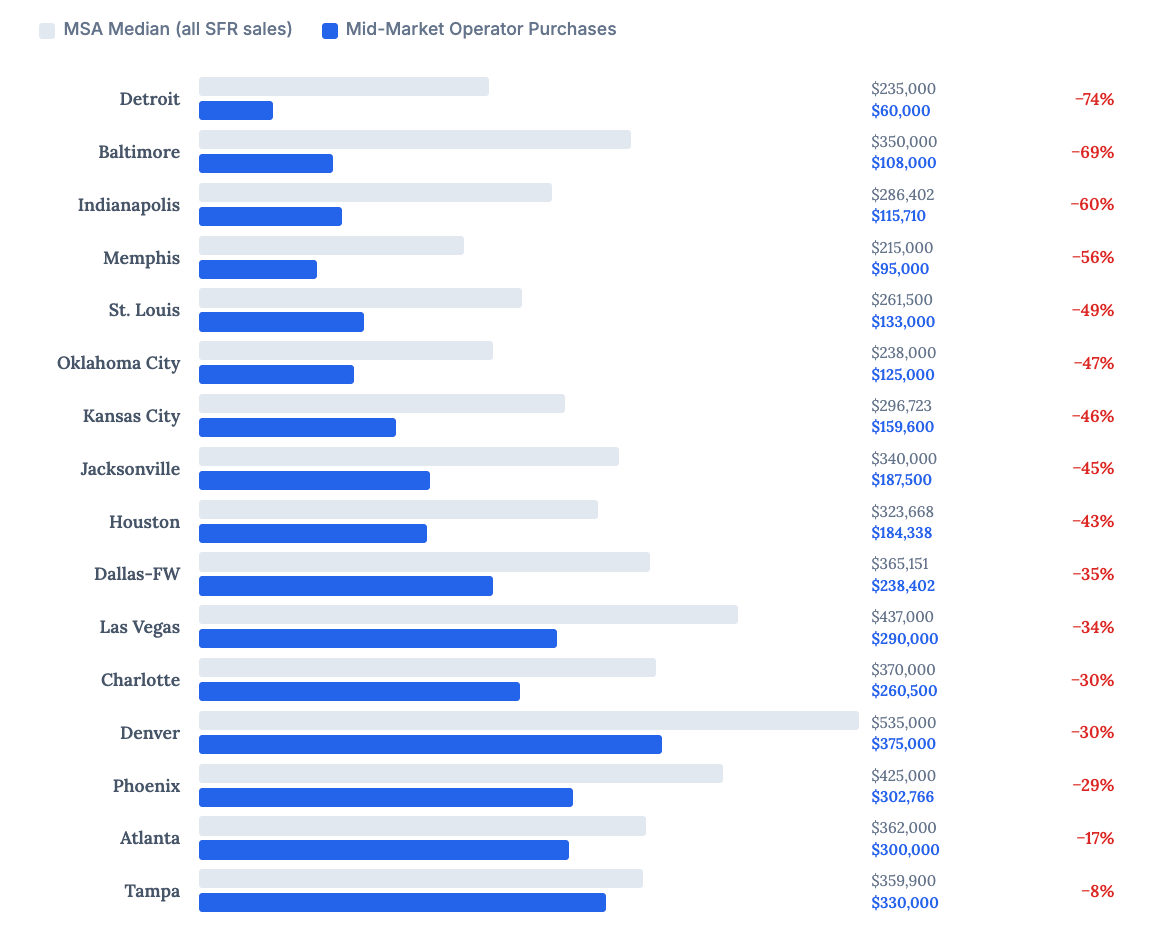
Across the most active metros for mid-market operators, they're often buying properties roughly 40% below the median sale price. This is because they're typically buying homes that need significant renovation, are in less desirable areas, and fit the workforce housing profile.
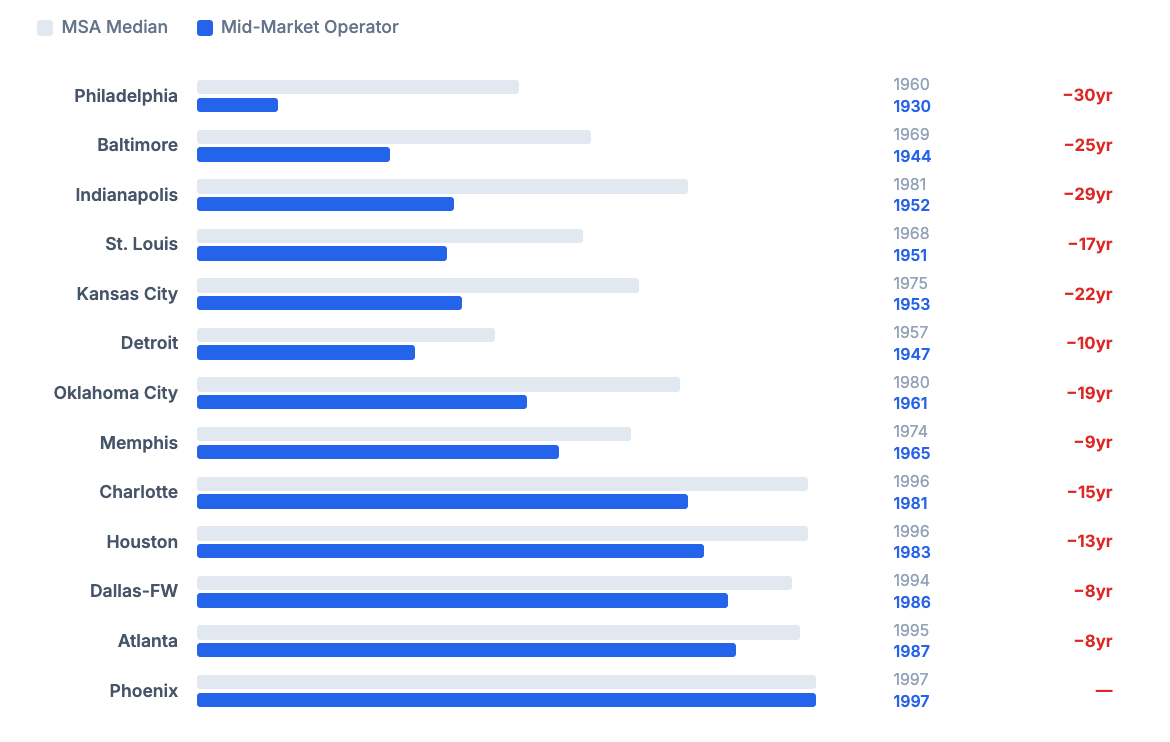
See below for comparisons of properties purchased by mid-market operators in 2025 versus market-wide averages for year built and building square footage.
Building square footage is consistently 25% smaller.
Property age is consistently >10 years older than market.
Given where interest rates, home prices, and rents are, this is the only strategy that really pencils out for most investors looking for long-term single-family rental holds right now.
While we don't have exhaustive Section 8 data, we know that many of the operators on this list are Section 8 providers - they are customers and subscribers of ours.
If the goal is to improve home price affordability, targeting the 100–1,000 operator group doesn't appear to make much sense. Much of what they’re currently buying is in need of repair and they’re renting it out as affordable housing. They’re also concentrated in the least expensive metros in the United States.
Looking at the Financing
Private lenders originated $3.62B last year across 10,030 loans to this group, roughly 3% of total private lending market volume. The groups most impacted by this legislation would be portfolio lenders financing portfolio acquisitions and refinances. An example can be found in our January deals highlight here, a 158-unit affordable housing portfolio refi in Columbus, GA, financed by CoreVest.
However, a fair number of these investors also finance conventional RTL/DSCR loans, both for flippers and for those building out portfolios.
While we tried to filter out BTR - which is said to be excluded from the proposed ban - some of the operators in the private lender origination numbers above likely wouldn't be materially impacted. For example, many of these investors are large flippers running numerous projects simultaneously but holding for short durations, so they would likely be unaffected. We attempted to screen them out, but some are inevitably included.