

Regional Demographics Where SFR Funds Own Properties
Distributions of income, age, fund specific demographics, and more.
Executive Summary
Distributions of the income and age of population in the regions surrounding properties owned by SFR funds vary significantly
Tenants in homes owned by large SFR operators tend to earn significantly more than the median household in the surrounding area
The second half of the post is available to paid subscribers, providing more granular details about income and age distribution linked to specific SFR funds
Detailed demographic data at the individual-level may be helpful in forecasting the ability of tenants within a portfolio to sustain rent increases
Interested in using nationwide individual-level demographic data for data enrichment? Fields include age, income, wealth, household composition, purchase history by vertical (ex: outdoors activities, gambling), etc. Clients have found it useful for building targeted marketing lists and evaluating regions for market expansion. Reach out to support@sfranalytics.com.
Data Overview
At SFR Analytics, we leverage nationwide deed, assessor, and individual-level demographic data to track the single family rental market. To generate this analysis, we’ve:
Identified and reconciled the entities that SFR funds have purchased homes under
Rolled up individual-level demographic data at the county and census tract level to provide details about people living in regions where SFR funds own properties
Analysis & Results
To get a sense for how income and age distributions varied in regions where SFR funds own properties, we looked at the data at the county and census tract level. Census tracts typically have a population size between 1,200 and 8,000 people and provide a more granular view than county-level statistics.
Most Active Counties
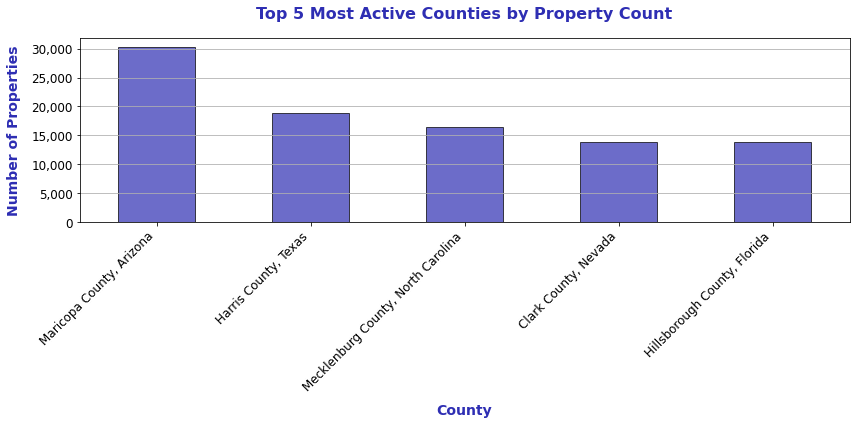
The most active counties for SFR funds by holdings are Maricopa County, Harris County, Mecklenburg County, Clark County, and Hillsborough County.
Census Tracts With Highest Percentage of $250k+ Annual Income (Min 100 Fund Purchases)
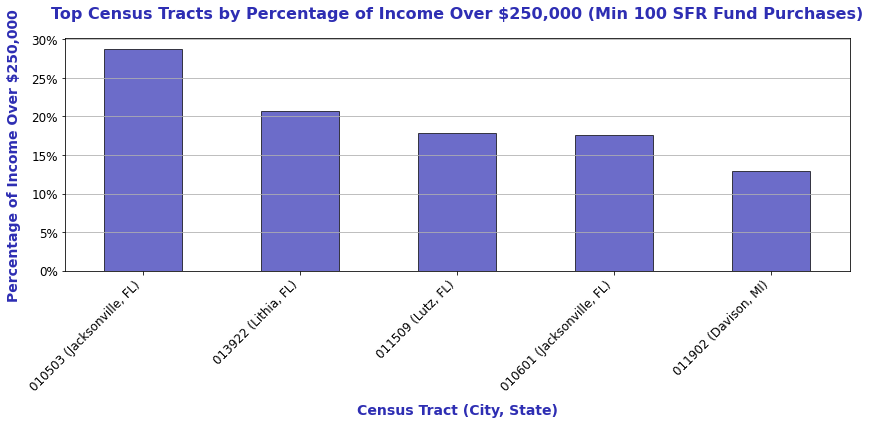
Florida is well represented in the top five list of census tracts with the highest proportion of household incomes of $250k+/yr, with tracts in Jacksonville, Lithia, and Lutz taking the top four spots.
Census Tracts With Highest Percentage of Population Aged 65+ (Min 100 Fund Purchases)
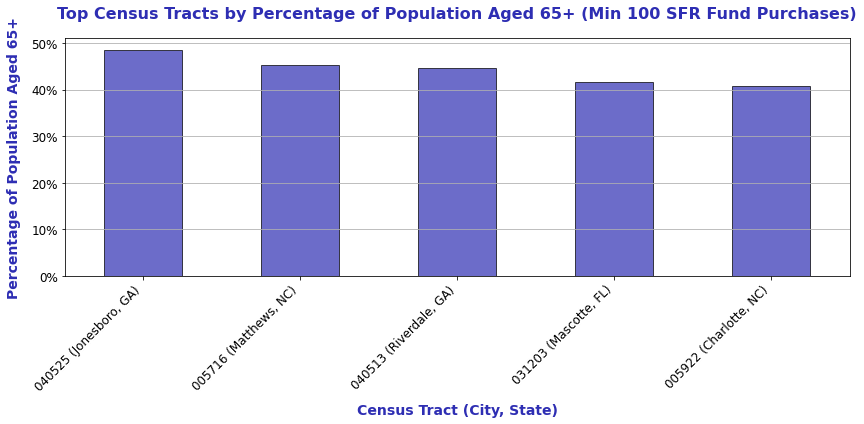
Census tracts in Georgia, North Carolina, and Florida had the highest proportion of individuals aged 65+, with each having 40%+.
Census Tracts With Lowest Percentage of Population Aged 65+ (Min 100 Fund Purchases)
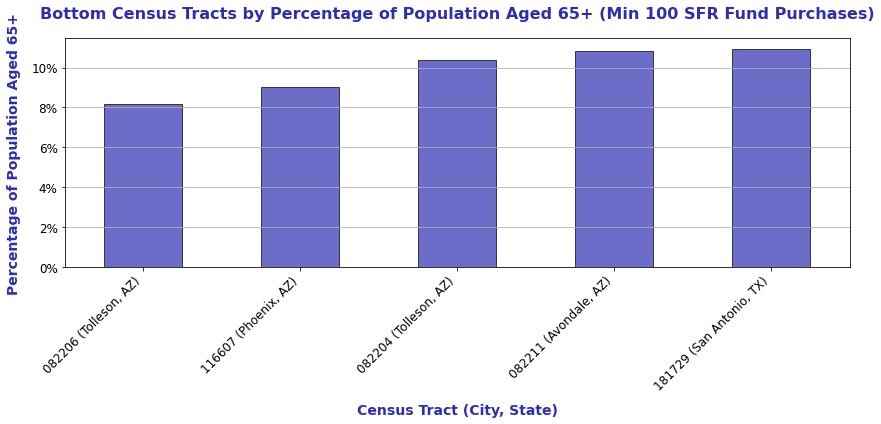
Census tracts in Arizona and Texas had the lowest proportion of individuals aged 65+, with rates just below and above 10%.
Fund-Level Details
Using individual-level demographic data rolled up at the census tract level, it’s possible to get a sense for the income and age distribution of regions surrounding properties owned by specific funds.
Below, we profile the income and age distributions of the public SFR REITs (Invitation Homes, American Homes 4 Rent, and Tricon) along with a handful of select private SFR funds (Pretium, SFR3, and VineBrook).
VineBrook Homes is shown below, with the remaining funds shown to paid subscribers.
VineBrook
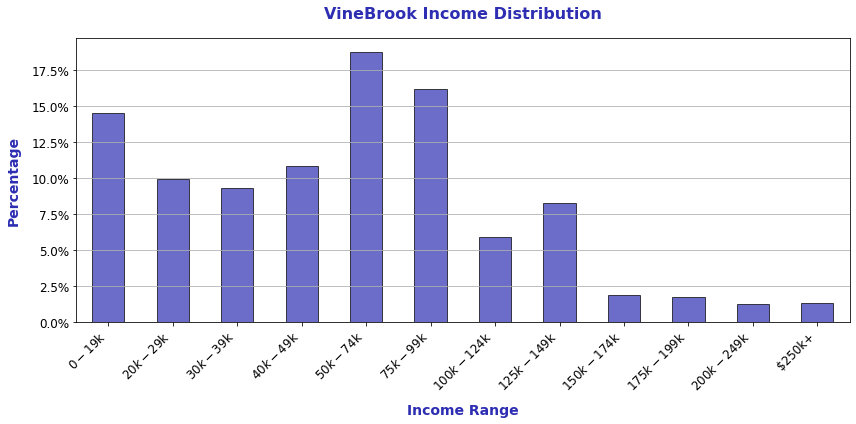
VineBrook typically buys properties in line with a strategy of workforce housing, targeting more affordable areas. The lower income distribution relative to that of other funds is reflected at the census tract level for areas where VineBrook owns properties.
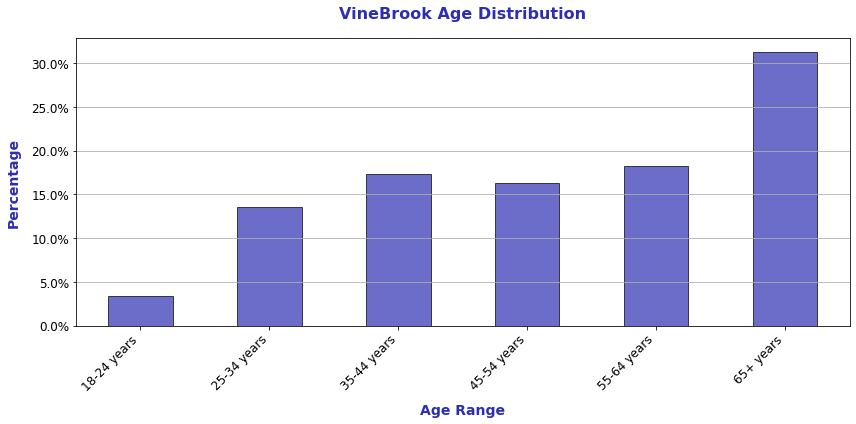
VineBrook’s age distribution is roughly in line with other SFR funds, with the largest population being 65+ followed by 55-64yrs.
Note: the remainder of this article is available to paid subscribers, sign up below for access. Paid subscribers get full access to weekly data-rich articles about the SFR market and select additional articles only available to paid subscribers.