

Q1 2024 Residential Multifamily Overview
Trends in Transaction Volume, Appreciation, Financing, and Corporate Ownership
Executive Summary
Note: this analysis is limited to residential multifamily (2-4plex).
Transaction volume declined sharply in many metros from Q1 2023 to Q1 2024, with the largest decreases in Joplin, MO (-45.8%), Philadelphia, PA (-41.3%), and St. Louis, MO (-41.1%). However, some metros proved more resilient, such as Milwaukee, WI (-9.1%) and Dallas, TX (-17.4%).
Median price per square foot appreciation from 2019 to 2024 varied widely across metros. New Haven, CT (92.0%), Miami, FL (91.9%), and Providence, RI (87.6%) saw the largest increases, while New Orleans, LA (-9.1%), Minneapolis, MN (12.6%), and San Francisco, CA (15.8%) experienced the smallest gains or even decreases.
Private lenders have been gradually increasing their participation in multi-family financings, with leading lenders like Kiavi, RCN Capital, and ROC Capital each completing more than 1,000 deals since January 2019.
The metros with the highest percentage of corporate multi-family purchases since January 2019 were Indianapolis, IN (49.3%), St. Louis, MO (48.3%), and Atlanta, GA (47.7%), suggesting attractive yields and economies of scale in these markets.
In contrast, metros with the lowest corporate ownership shares, such as Sacramento, CA (9.5%) and San Francisco, CA (10.9%), have higher entry prices and lower yields.
Results & Analysis
Transaction Volume Trends
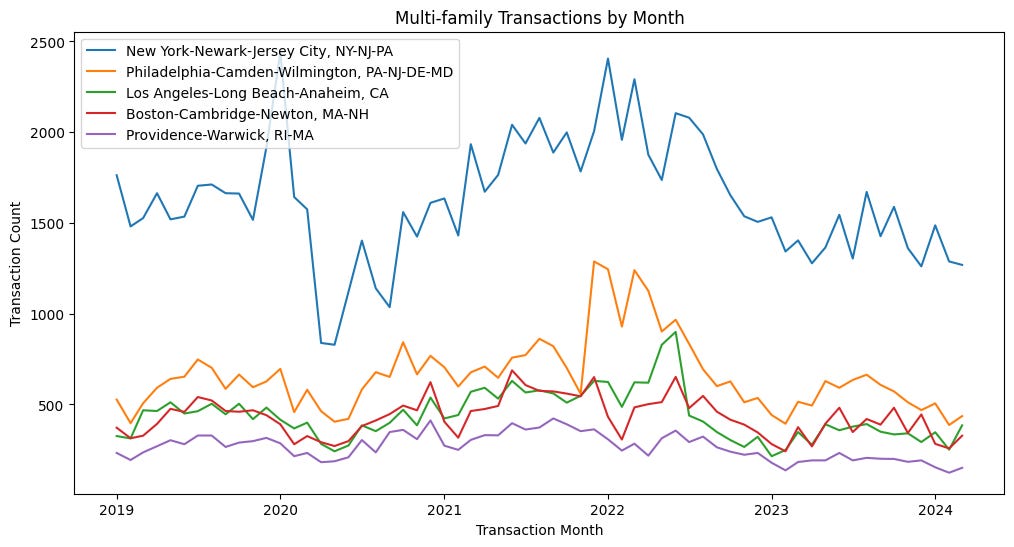
Multi-family transaction volume nationwide peaked in late 2021 before declining sharply in the second half of the year and remaining depressed through early 2022. Rising interest rates have made deals less economical for buyers using leverage to purchase properties.
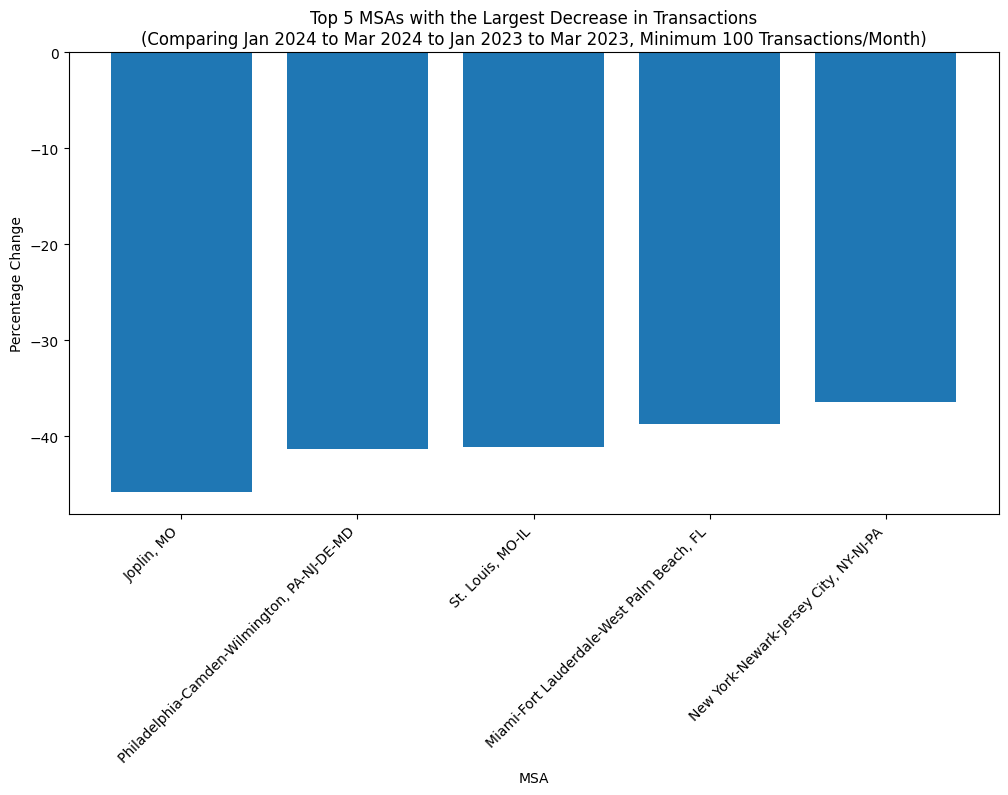
The metros with the largest percentage decreases in transaction counts Q1 2023 vs Q1 2024 were:
1. Joplin, MO (-45.8%)
2. Philadelphia-Camden-Wilmington, PA-NJ-DE-MD (-41.3%)
3. St. Louis, MO-IL (-41.1%)
4. Miami, FL (-38.6%)
5. New York, NY (-36.5%)
These metros experienced significant slowdowns in multi-family activity, likely due to a combination of factors such as rising interest rates, economic uncertainty, and shifts in investor sentiment. The steep declines suggest that these markets may have been more sensitive to the changing macroeconomic conditions compared to other areas of the country.
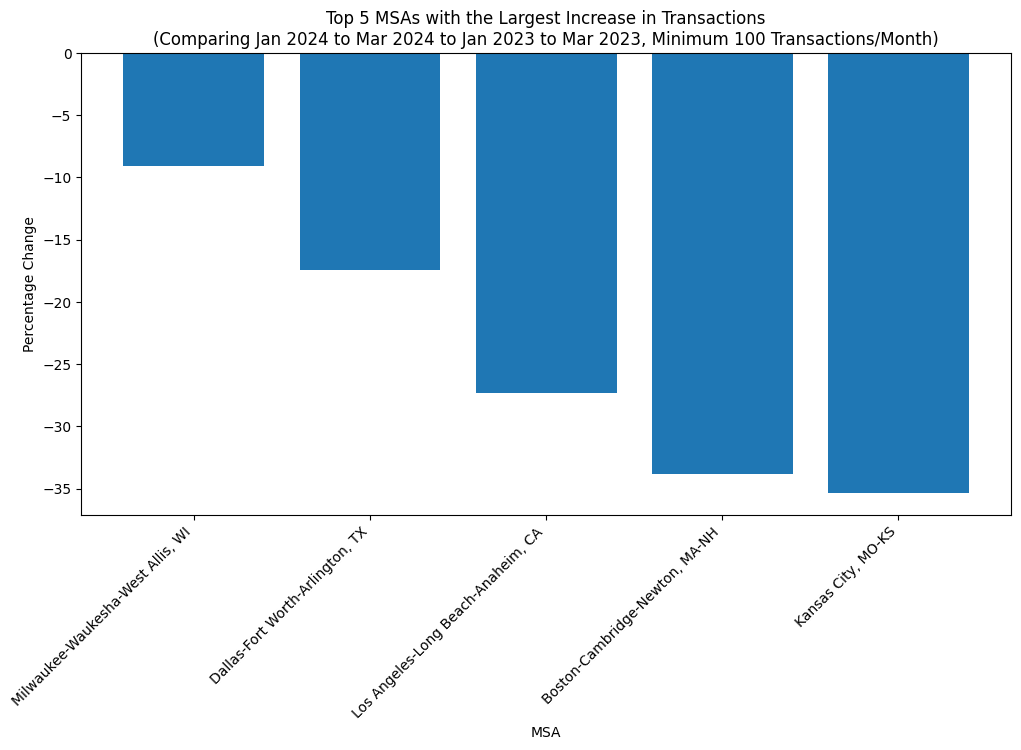
However, not all markets saw such steep declines over this period. The metros that held up best on transaction volume were:
1. Milwaukee, WI (-9.1%)
2. Dallas, TX (-17.4%)
3. Los Angeles, CA (-27.3%)
4. Boston, MA (-33.9%)
5. Kansas City, MO (-35.4%)
The relative resilience of these markets during the downturn could be attributed to a variety of factors, such as strong local economies, favorable demographic trends, or attractive yield profiles. These metros may have also benefited from a flight to quality among investors seeking more stable and predictable returns in an uncertain environment
Appreciation Trends
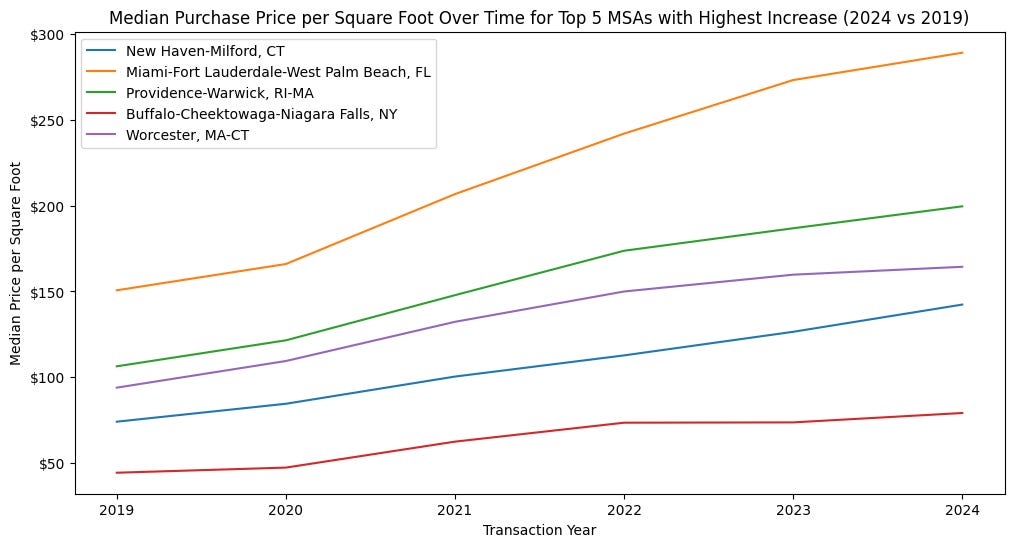
The metros with the largest percentage increases in median price per square foot from 2019 to 2024 were:
New Haven-Milford, CT (92.0%)
Miami-Fort Lauderdale-West Palm Beach, FL (91.9%)
Providence-Warwick, RI-MA (87.6%)
Buffalo-Cheektowaga-Niagara Falls, NY (78.4%)
Worcester, MA-CT (74.9%)
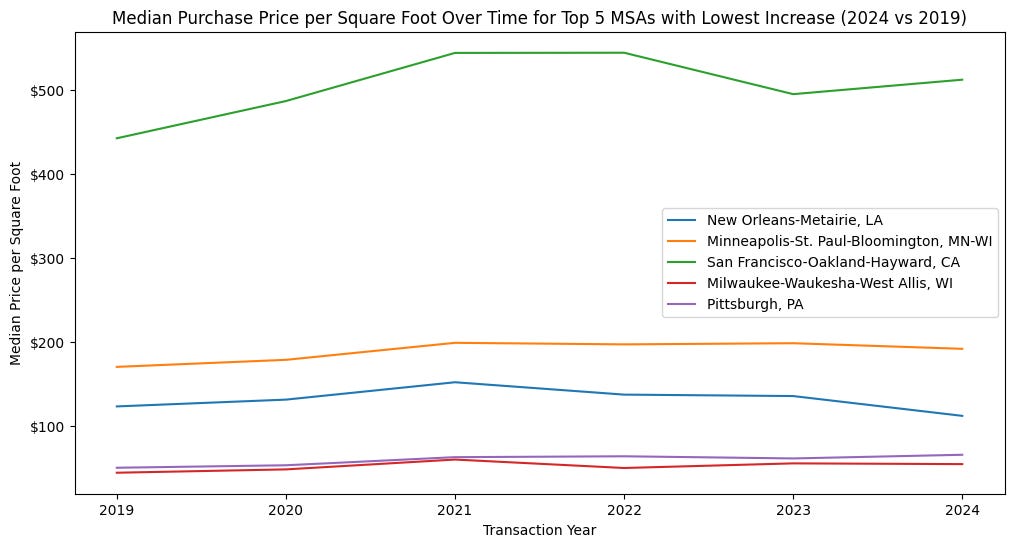
The metros with the smallest percentage increases in median price per square foot (and even a decrease, in the case of New Orleans) from 2019 to 2024 were:
New Orleans-Metairie, LA (-9.1%)
Minneapolis-St. Paul-Bloomington, MN-WI (12.6%)
San Francisco-Oakland-Hayward, CA (15.8%)
Milwaukee-Waukesha-West Allis, WI (23.3%)
Pittsburgh, PA (30.9%)
Financing Deals
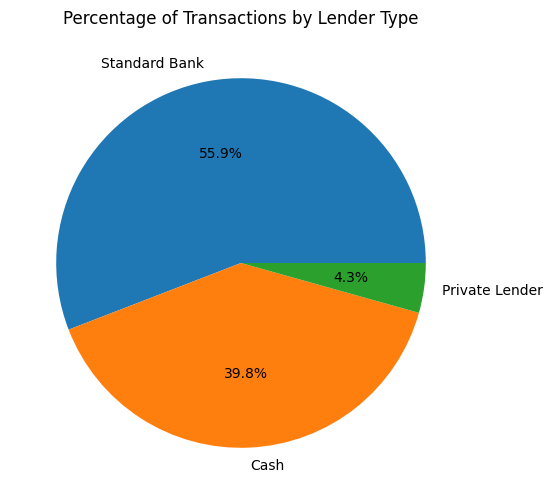
Looking at multi-family properties purchased from January 1st, 2019 to present shows that few were financed by private lenders, like many residential fix-and-flip properties are, with purchases instead relying on standard banks or purchasing deals with cash (note: cash deals will be overrepresented by purchases that have fund-level debt facilities instead of property-level debt facilities; these properties will appear on deed as being purchased without a loan, but in reality the loan is a larger facility not linked to any particular transaction).
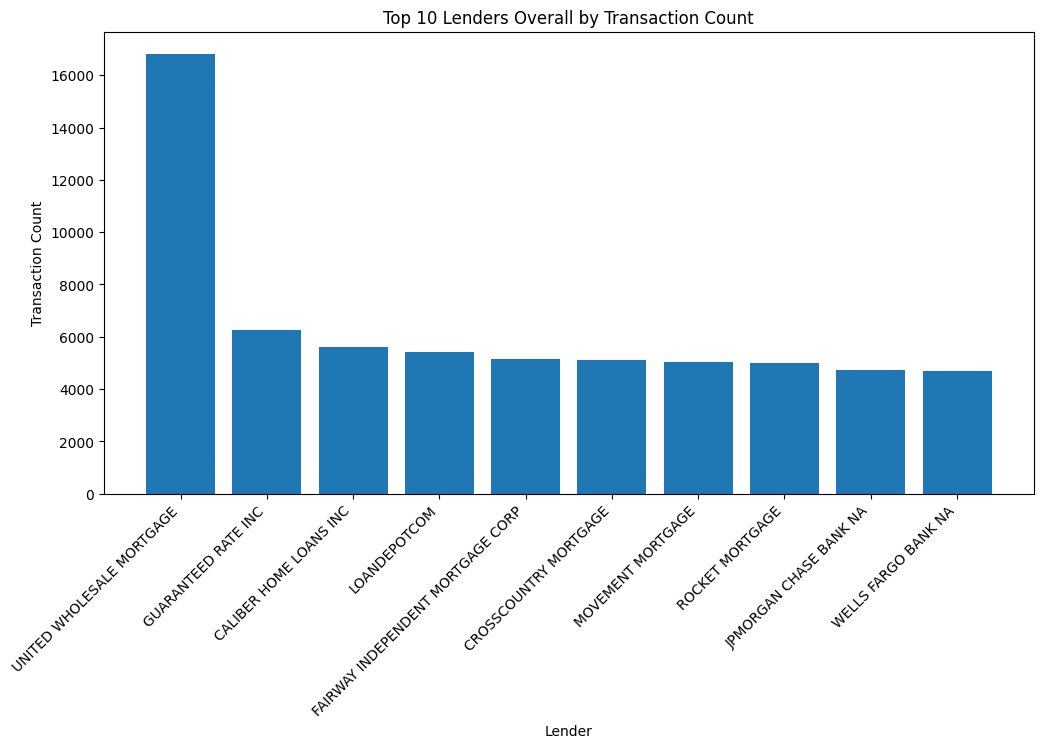
The majority of acquisitions that are financed are done by your traditional mortgage companies.
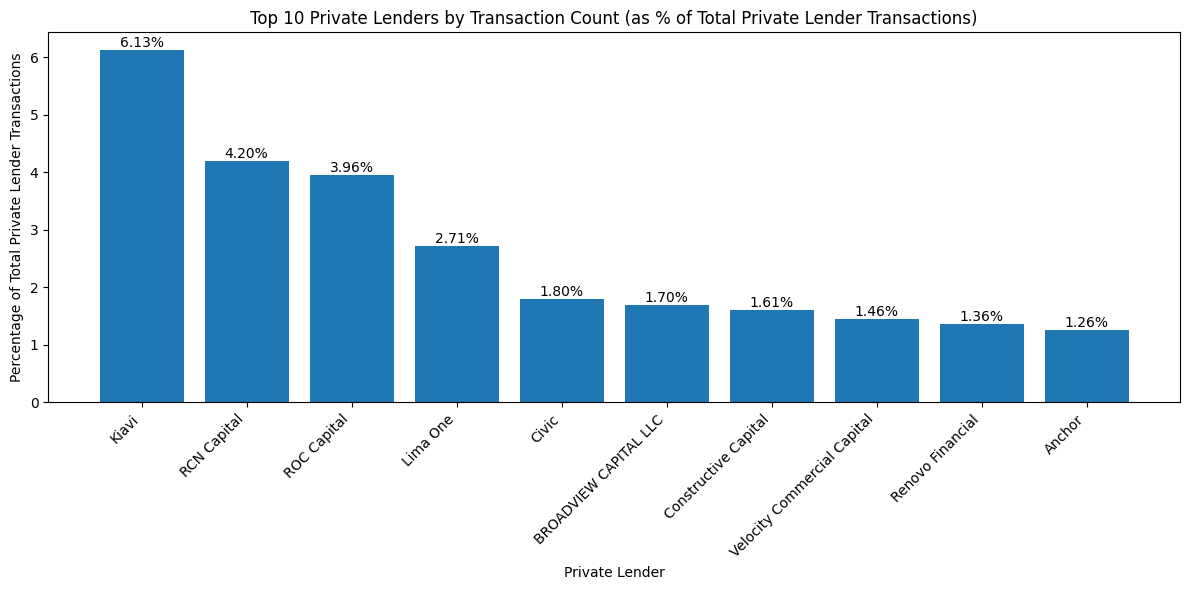
While representing a small percentage of the total mutli-family deals done, private lenders have been gradually doing more of these types of deals. Leading lenders like Kiavi, RCN Capital, and ROC Capital have done the most among private lenders, each completing more than 1,000 since January 2019.
Ownership Trends
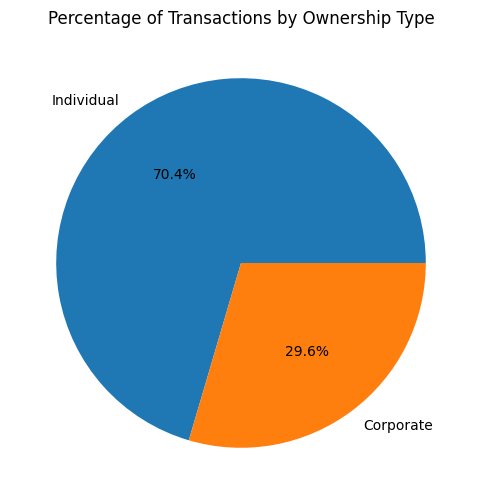
In aggregate, corporate purchasers (as determined by the entity used on purchase) represent almost 30% of transactions. However, when looking across MSAs significant difference in the split between corporate and individual ownership exist.
Corporate Ownership by MSA
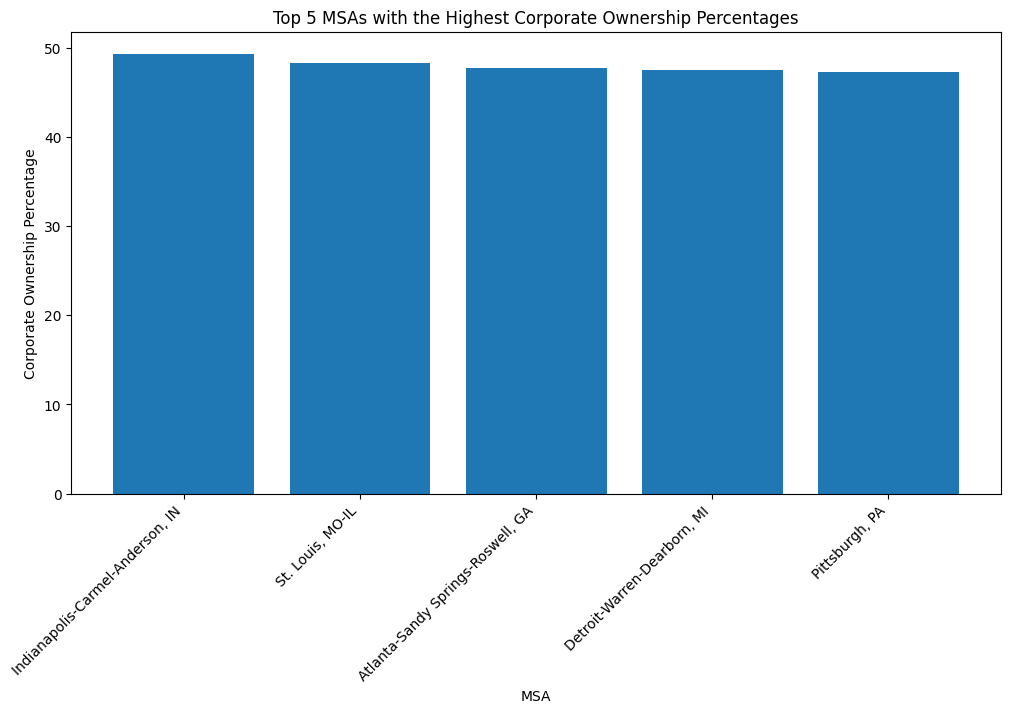
The metros with the highest percentage of multi-family properties purchased by corporate entities since January 2019 were:
Indianapolis-Carmel-Anderson, IN (49.3%)
St. Louis, MO-IL (48.3%)
Atlanta-Sandy Springs-Roswell, GA (47.7%)
Detroit-Warren-Dearborn, MI (47.5%)
Pittsburgh, PA (47.2%)
In these metros, corporate buyers accounted for nearly half of all multi-family transactions over the past few years. The relatively high levels of corporate ownership suggest these markets may offer attractive yields, growth prospects, and economies of scale that appeal to larger investors. The presence of institutional capital could also contribute to further professionalization and efficiency gains within these multi-family markets.
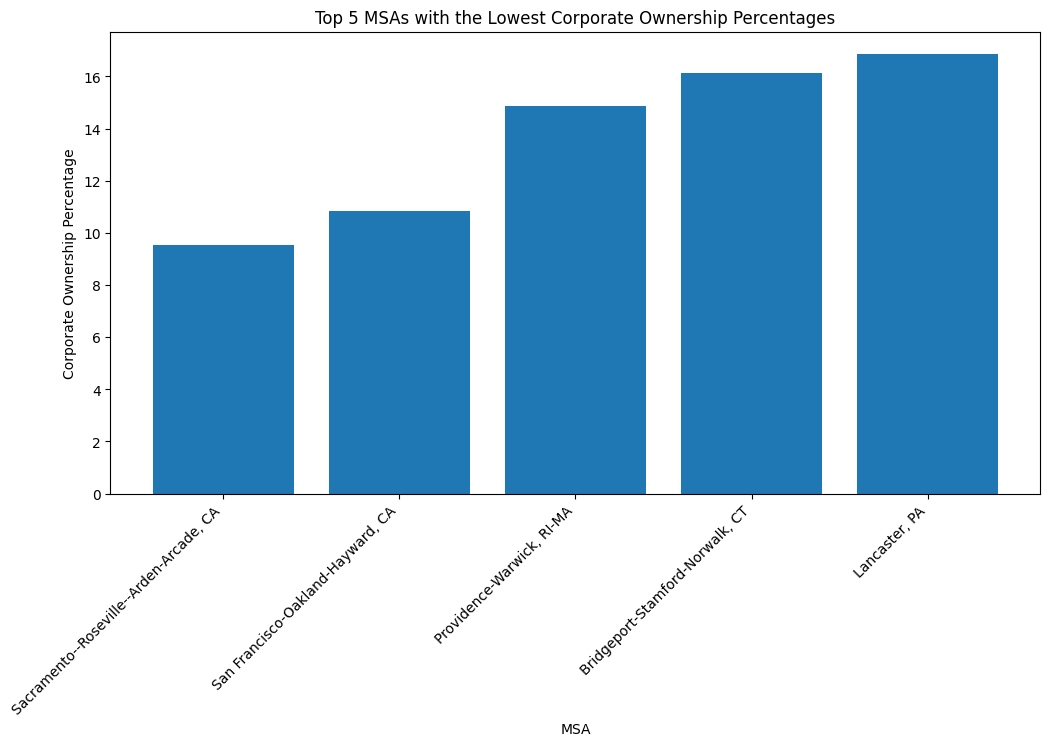
The metros with the lowest percentage of multi-family properties purchased by corporate entities since January 2019 were:
Sacramento--Roseville--Arden-Arcade, CA (9.5%)
San Francisco-Oakland-Hayward, CA (10.9%)
Providence-Warwick, RI-MA (14.9%)
Bridgeport-Stamford-Norwalk, CT (16.1%)
Lancaster, PA (16.9%)
In contrast, these metros had corporate ownership percentages in the 10-20% range, indicating that individual investors still dominate the multi-family market. The low corporate share could be due to a variety of factors such as high entry prices, lower yields, or a prevalence of smaller multi-family properties that may not fit institutional investment criteria. Sacramento and San Francisco, for example, are known for having some of the highest housing costs in the country.
Overall, the market for residential multifamily properties continues to be less institutionalized, with the majority of owners being individuals taking out standard financing.