Out Of State Investor Trends Q1 2026
Florida Dominates; Overall % Of Acquisitions Increasing
Executive Summary
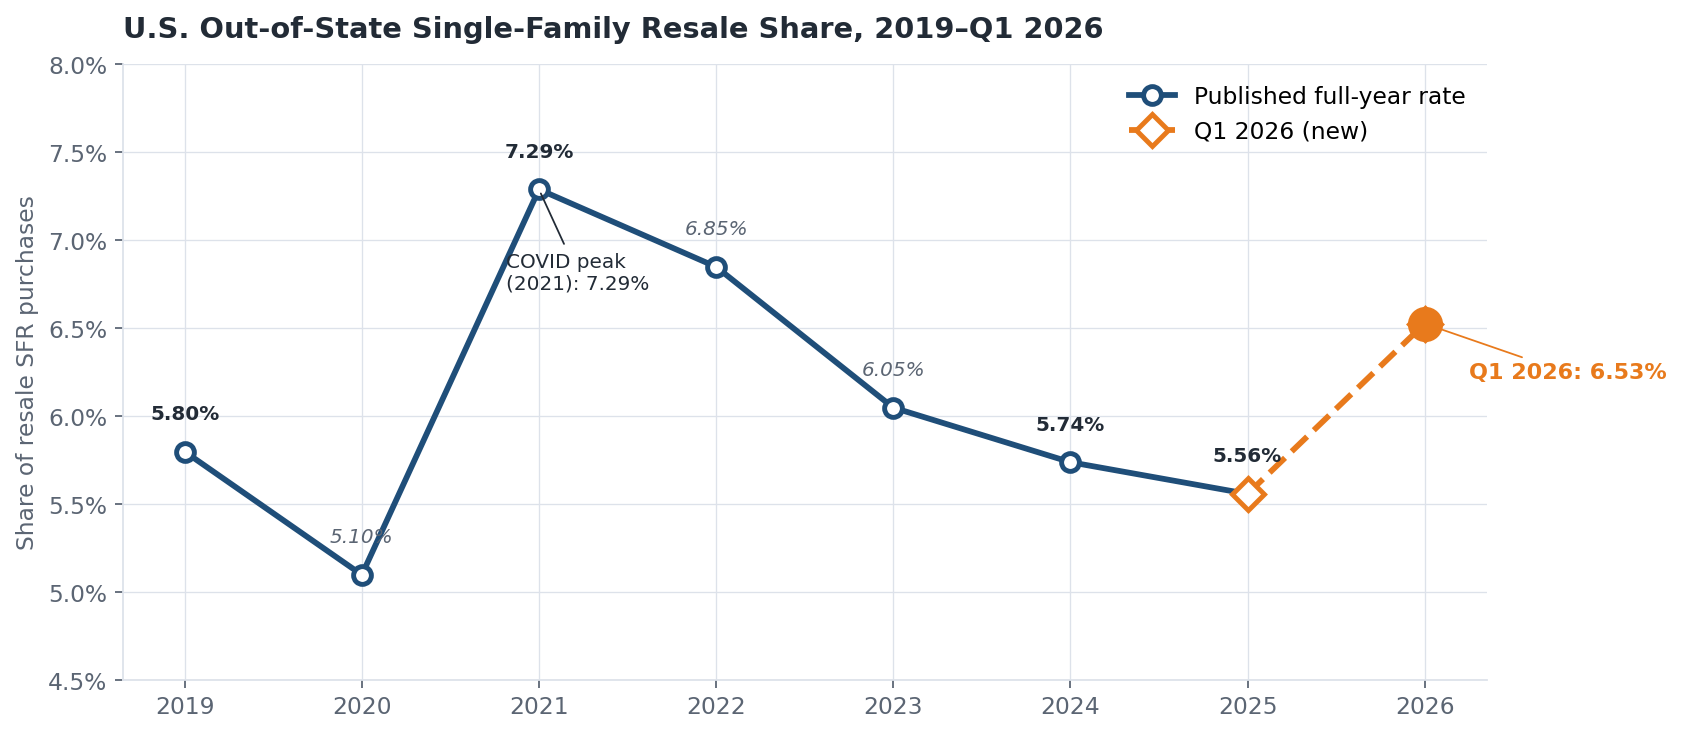
Out-of-state investment in single-family homes held essentially flat versus the prior year in Q1 2026, after several years of post-COVID moderation toward pre-pandemic levels:
Out-of-state buyers accounted for 6.53% of U.S. single-family home purchases in Q1 2026, up modestly from 6.28% in Q1 2025 (+0.25pp YoY)
The Q1 2026 figure sits +0.97pp above the published full-year 2025 rate of 5.56%, a larger-than-typical Q1 premium and a sign that early-2026 OOS activity is running firmer than the full-year 2025 average
Aggregate share remains well below the 7.29% COVID peak (2021) and is structurally elevated above the pre-pandemic 5.80% 2019 baseline
The aggregate trend is the least interesting part of the story; the composition shifts underneath it are much more pronounced
Metro-Level Analysis
Across 600+ metropolitan statistical areas, out-of-state investment activity remains highly uneven. Florida’s Gulf Coast remains heavily represented near the top of the distribution.
Highest OOS rates among metros with at least 500 Q1 2026 SFR resale transactions:
Lake Havasu City-Kingman, AZ: 36.0%
Wildwood-The Villages, FL: 31.0%
Punta Gorda, FL: 29.7%
Naples-Marco Island, FL: 29.1%
Crestview-Fort Walton Beach-Destin, FL: 28.8%
Seaford, DE: 28.3%
Panama City-Panama City Beach, FL: 27.6%
Atlantic City-Hammonton, NJ: 25.2%
North Port-Bradenton-Sarasota, FL: 24.4%
Cape Coral-Fort Myers, FL: 23.8%

Selected high-volume metros with elevated OOS activity (Q1 2026):
Phoenix-Mesa-Chandler, AZ: 12.2% (+0.35pp YoY)
Cape Coral-Fort Myers, FL: 23.8% (+6.24pp YoY)
North Port-Bradenton-Sarasota, FL: 24.5% (+5.53pp YoY)
Memphis, TN-MS-AR: 14.8% (-4.63pp YoY)
Tampa-St. Petersburg-Clearwater, FL: 8.8% (+1.10pp YoY)
St. Louis, MO-IL: 12.1% (+1.76pp YoY)
Birmingham, AL: 11.6% (-0.64pp YoY)
Charlotte-Concord-Gastonia, NC-SC: 7.3% (+1.27pp YoY)
Las Vegas-Henderson-North Las Vegas, NV: 11.3% (-1.01pp YoY)
Cleveland, OH: 10.3% (+0.09pp YoY)
Year-over-Year Changes (Q1 2025 vs Q1 2026)
Among high-volume metros, the sharpest YoY moves fall into two broad groups: Florida Gulf Coast markets on the increase side, and Memphis plus several regional metros on the decrease side.
Largest OOS increases:
Cape Coral-Fort Myers, FL: +6.24pp (17.59% → 23.83%)
North Port-Bradenton-Sarasota, FL: +5.53pp (18.98% → 24.51%)
Columbus, OH: +3.99pp (11.72% → 15.71%)
Raleigh-Cary, NC: +3.01pp (4.22% → 7.23%)
Killeen-Temple, TX: +2.99pp (5.86% → 8.85%)
Lakeland-Winter Haven, FL: +2.79pp (8.03% → 10.82%)
Crestview-Fort Walton Beach-Destin, FL: +2.69pp (25.99% → 28.68%)
Naples-Marco Island, FL: +2.59pp (26.63% → 29.22%)
Largest OOS decreases:
Memphis, TN-MS-AR: -4.63pp (19.41% → 14.78%)
Rochester, NY: -4.04pp (8.88% → 4.84%)
Daphne-Fairhope-Foley, AL: -2.98pp (15.54% → 12.56%)
Albany-Schenectady-Troy, NY: -2.70pp (8.95% → 6.25%)
Montgomery, AL: -1.83pp (17.12% → 15.29%)
Detroit-Warren-Dearborn, MI: -1.76pp (9.01% → 7.25%)
Tulsa, OK: -1.74pp (4.70% → 2.96%)
Mobile, AL: -1.36pp (8.49% → 7.13%)

The Florida Gulf Coast rebound is the clearest metro-level theme in Q1 2026. Florida metros dominate the increase list, led by Cape Coral-Fort Myers (+6.24pp) and North Port-Bradenton-Sarasota (+5.53pp), both from already-elevated bases. These are markets that local headlines have often framed as stressed over the past year, citing insurance premium spikes, condo inventory overhang, and prices below peak. The deed data suggests non-local buyers are leaning into that weakness rather than pulling away from it.
On the decrease side, Memphis (-4.63pp) is the most consequential single move, given the 2,752 Q1 2026 transactions involved. Memphis was a poster child for institutional Mid-South build-to-rent activity through 2024-25; Q1 2026 suggests a meaningful pullback among the retail and mid-tier corporate buyers captured by this OOS-address methodology. One caveat: if institutional REITs are buying through TN-domiciled subsidiaries, this methodology can classify some non-local institutional activity as in-state, so the Memphis decline should be read as a signal in the address-based buyer mix rather than a complete measure of institutional capital flows. Detroit (-1.76pp) shows a similar pattern at smaller scale.
Largest increases since Q1 2021 (≥500 Q1 2026 txns):
Clarksville, TN-KY: +9.39pp (4.07% → 13.46%)
Columbus, OH: +7.02pp (8.16% → 15.18%)
Toledo, OH: +7.00pp (7.72% → 14.72%)
Midland, TX: +6.22pp (0.97% → 7.19%)
Corpus Christi, TX: +5.42pp (2.56% → 7.98%)
Scranton--Wilkes-Barre, PA: +5.37pp (9.28% → 14.65%)
Lexington-Fayette, KY: +5.20pp (0.51% → 5.71%)
St. Louis, MO-IL: +5.17pp (6.84% → 12.01%)
The Ohio cluster (Columbus, Toledo, Cleveland) and Tennessee/Kentucky (Clarksville, Lexington) are the clearest examples of markets that have established a durably higher post-COVID OOS share. The St. Louis +5.17pp move at 12.0% on 10,251 Q1 2026 transactions is one of the more notable signals — it’s now in the top-15 large metros for OOS share.
Price Segment Analysis
Out-of-state investment continues to vary significantly by property price point, with the U-shaped pattern identified in the 2025 update persisting in Q1 2026:
Bottom decile (D1): 6.72% OOS rate (avg $410k) — lower-priced homes within each MSA, where rental investors and wholesale buyers are more active
Middle deciles (D5–D7): 4.6–5.0% OOS rate — lowest non-local activity; this is where local owner-occupiers dominate
Top decile (D10): 8.71% OOS rate (avg $1.77M) — luxury/vacation property segment

The bottom decile rate has ticked up from 6.16% (full-year 2025) to 6.72% in Q1 2026, while the top decile has moved slightly the other direction (9.11% → 8.71%). The directional read is that the lowest-priced segment within each metro is becoming more non-local, not less.
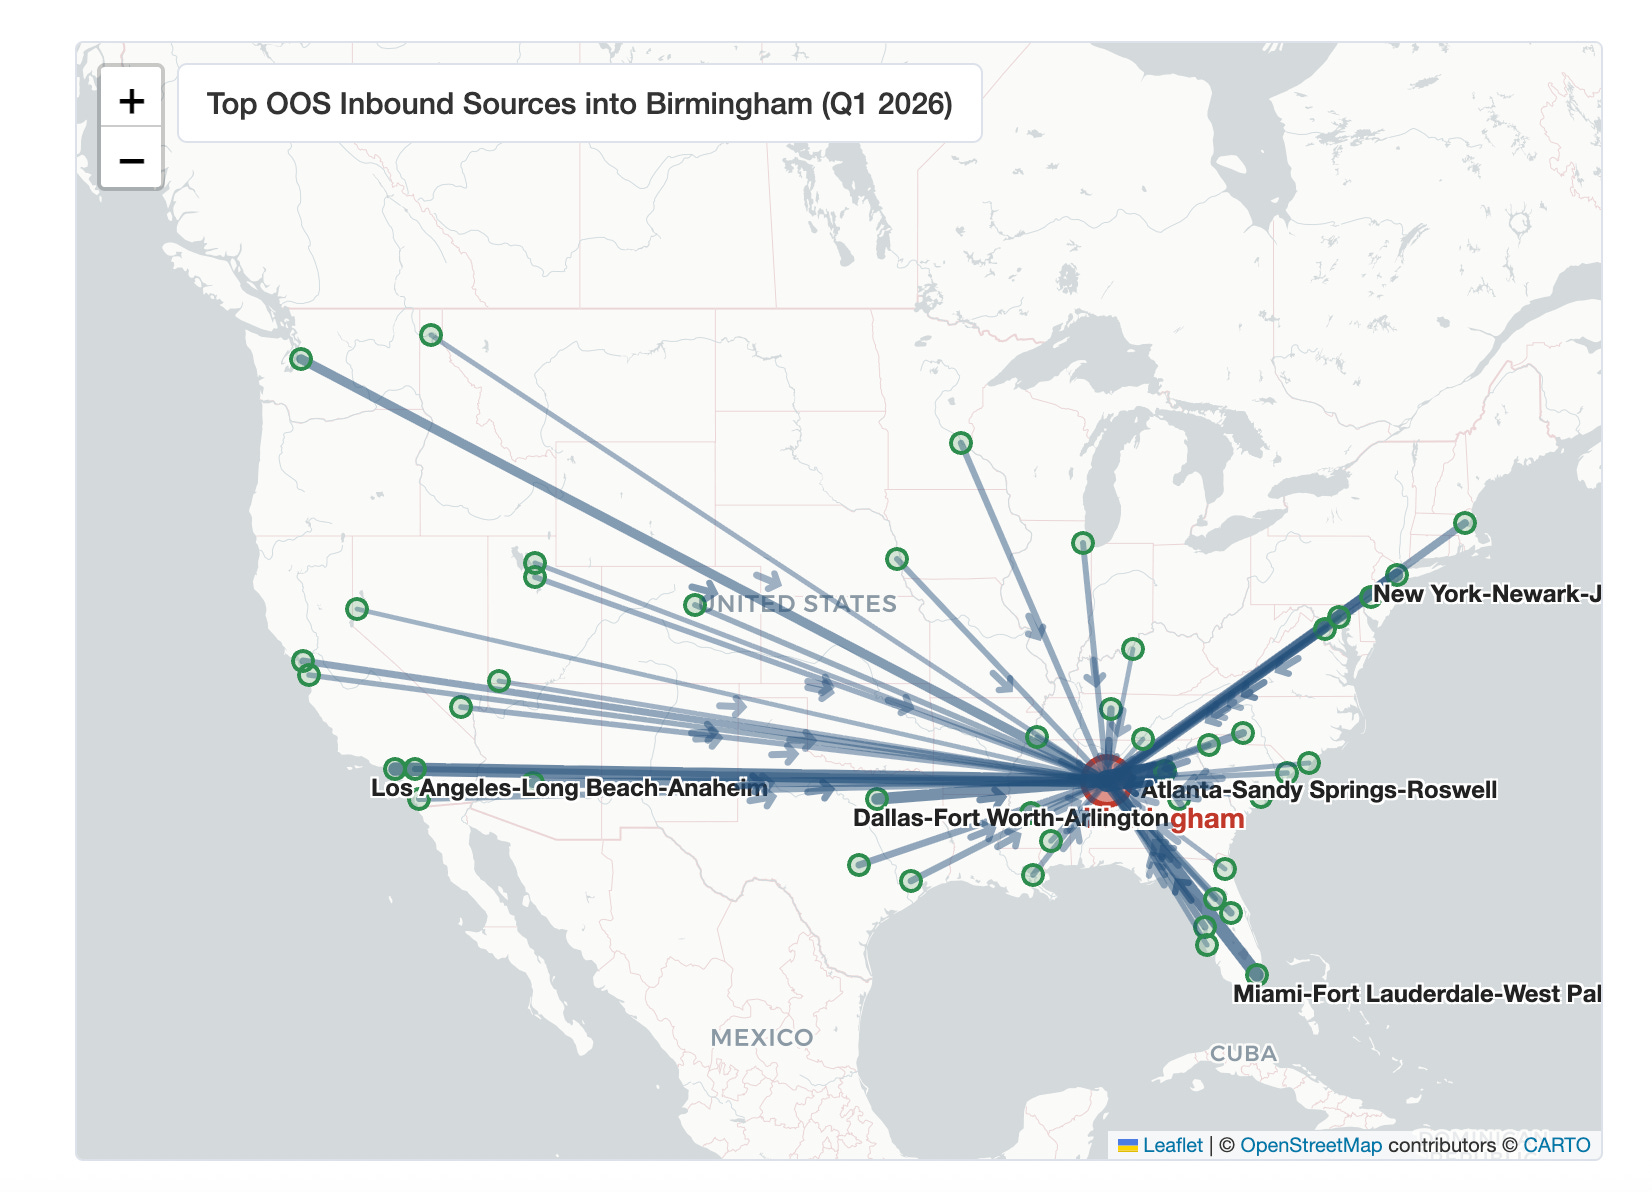
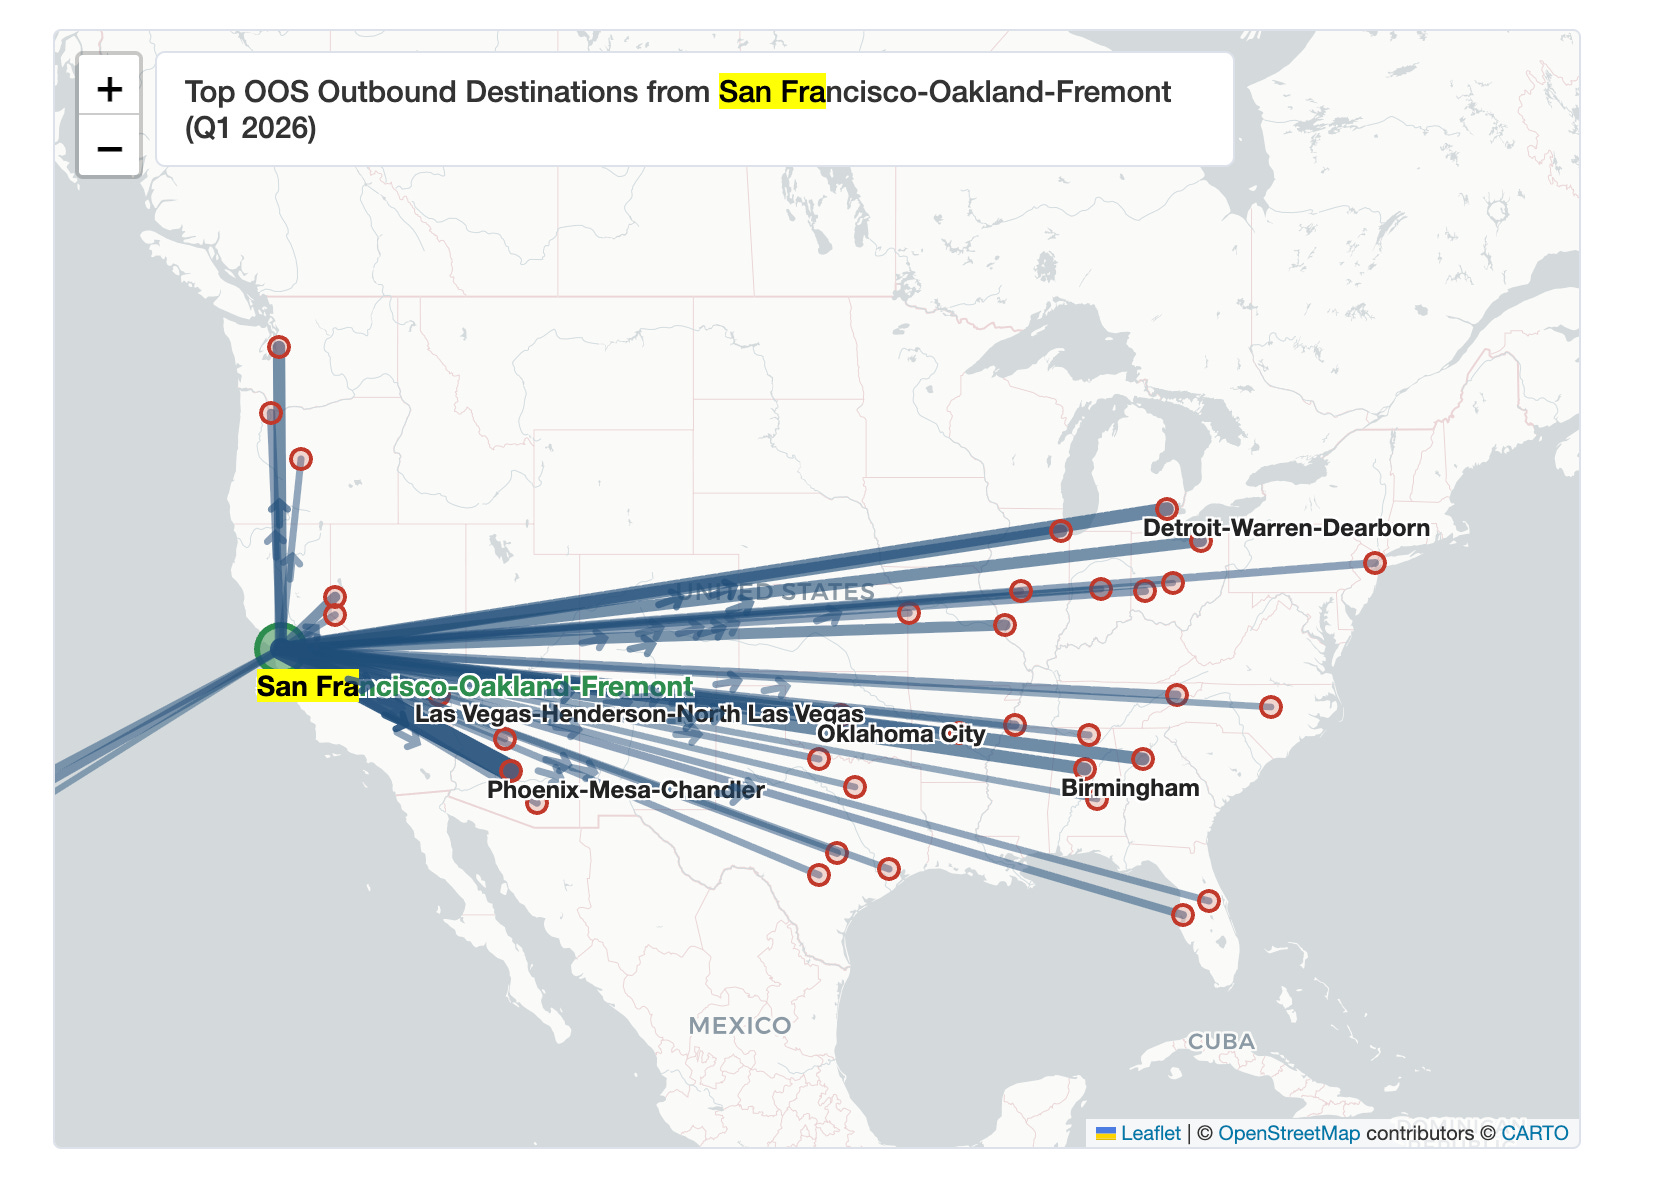
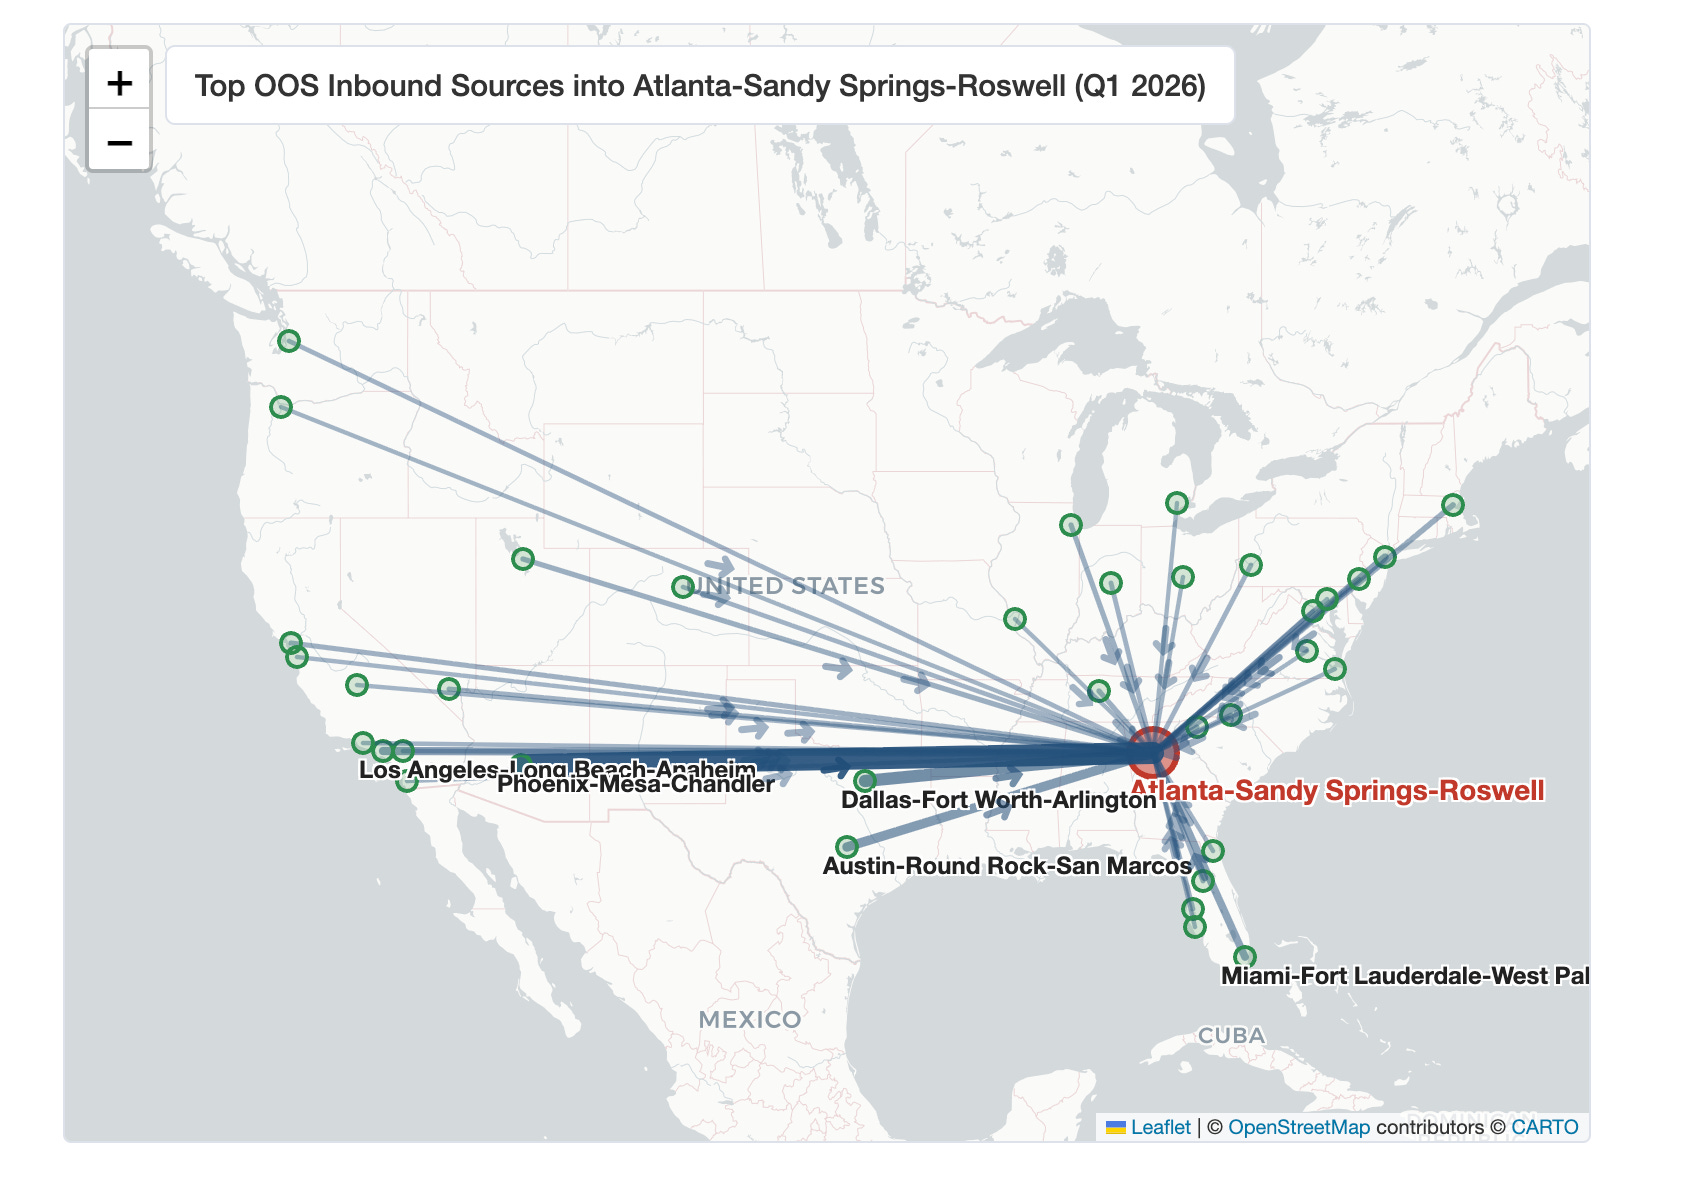
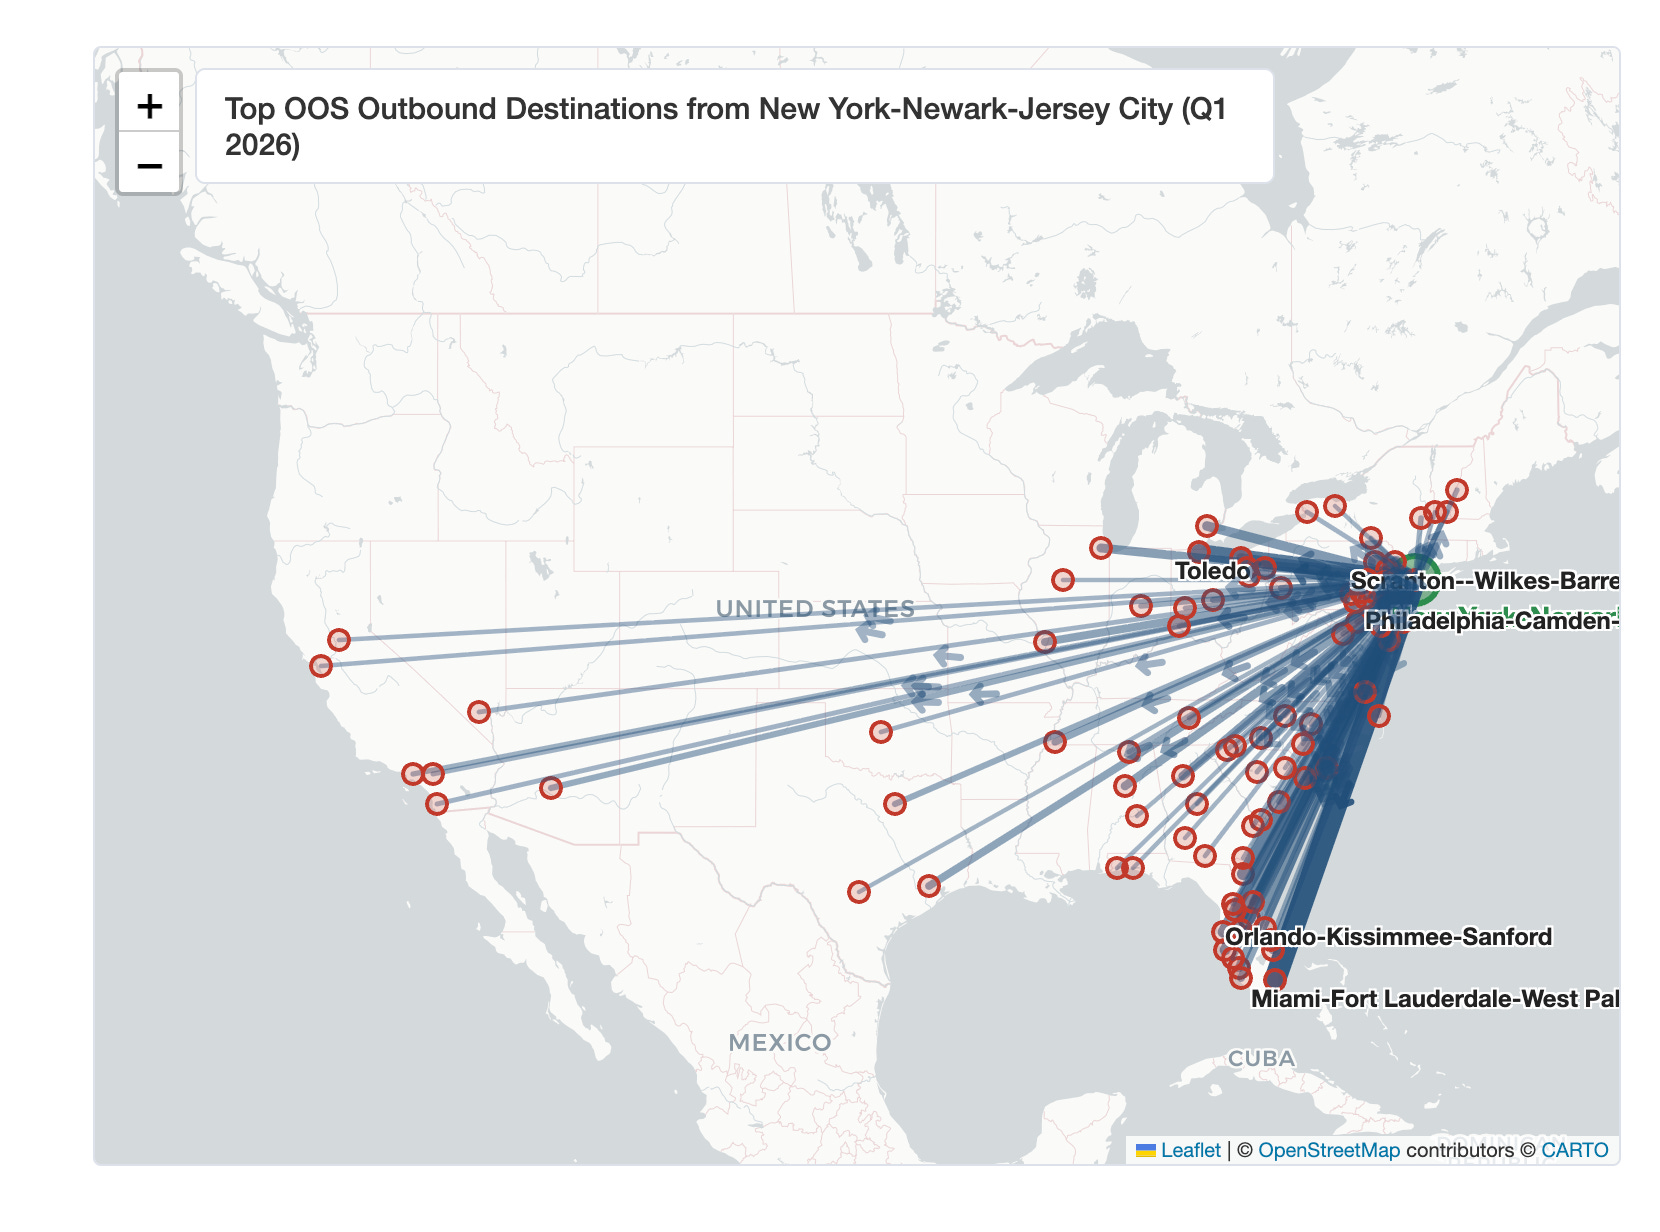
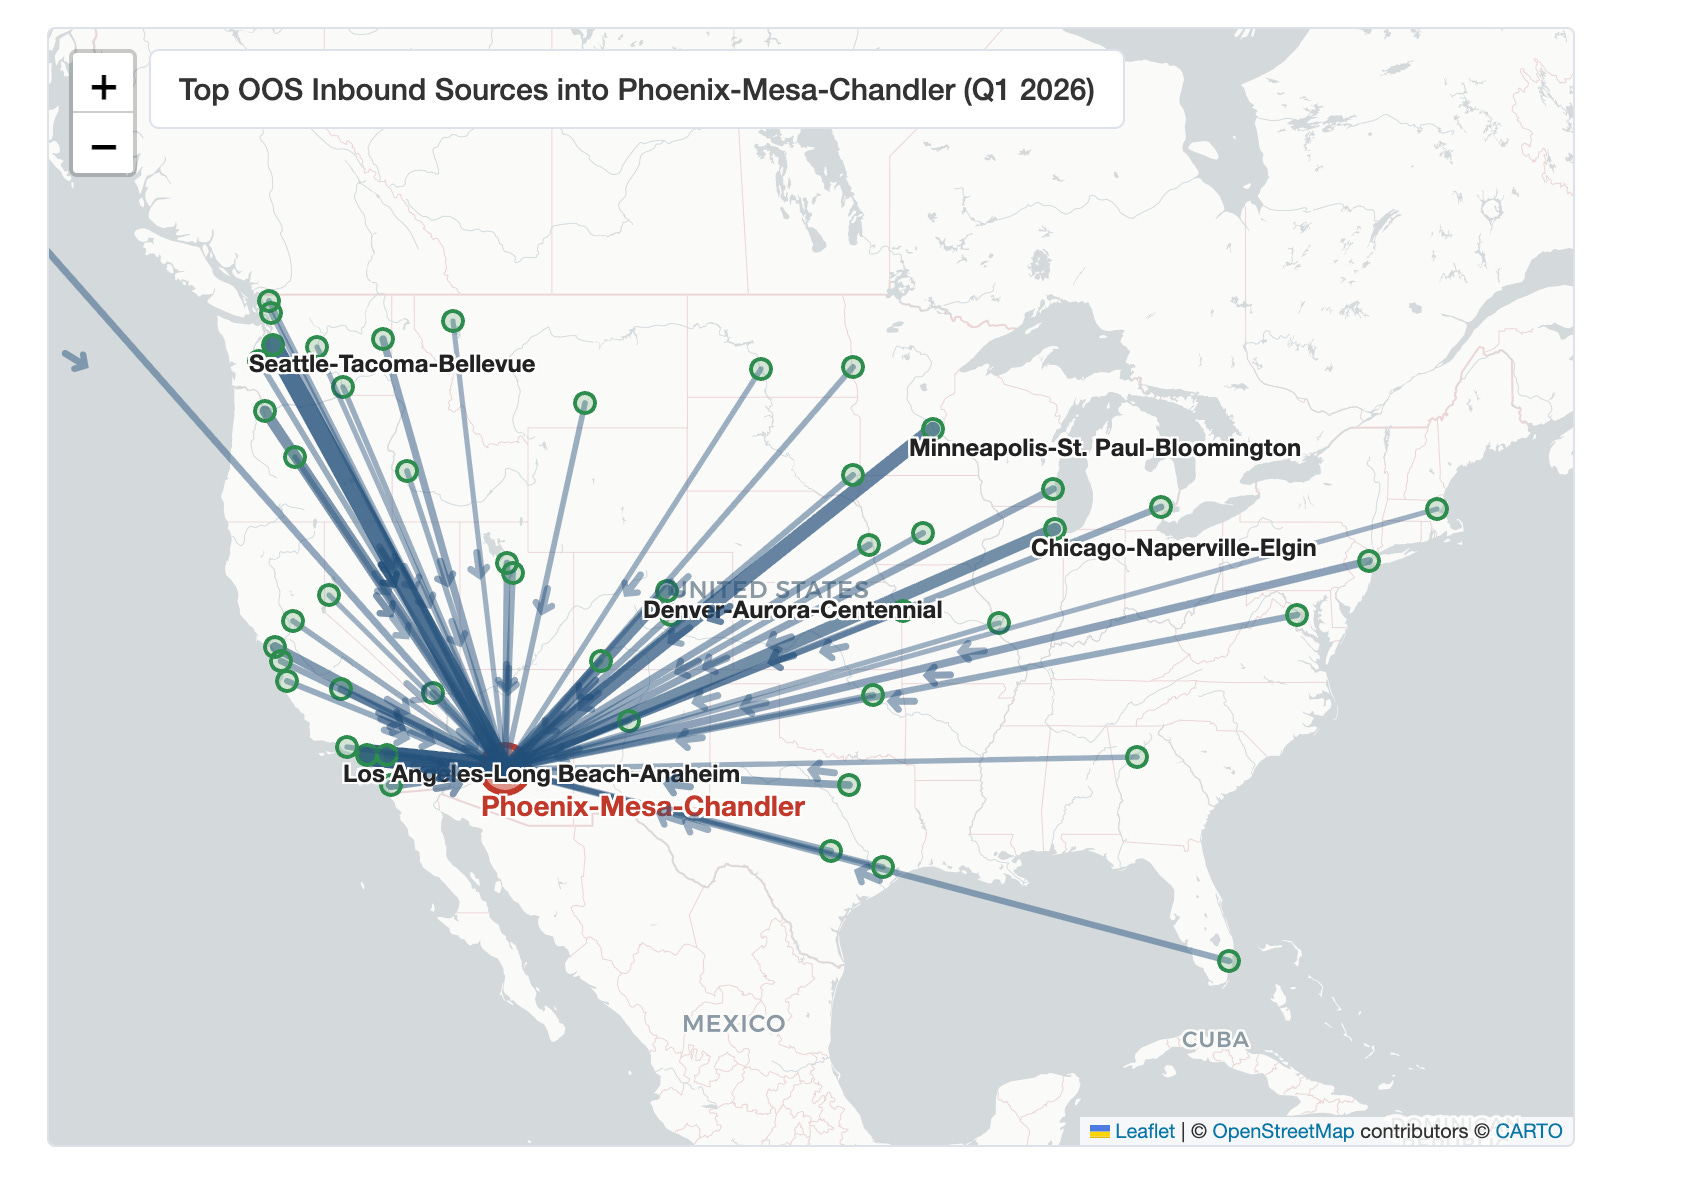
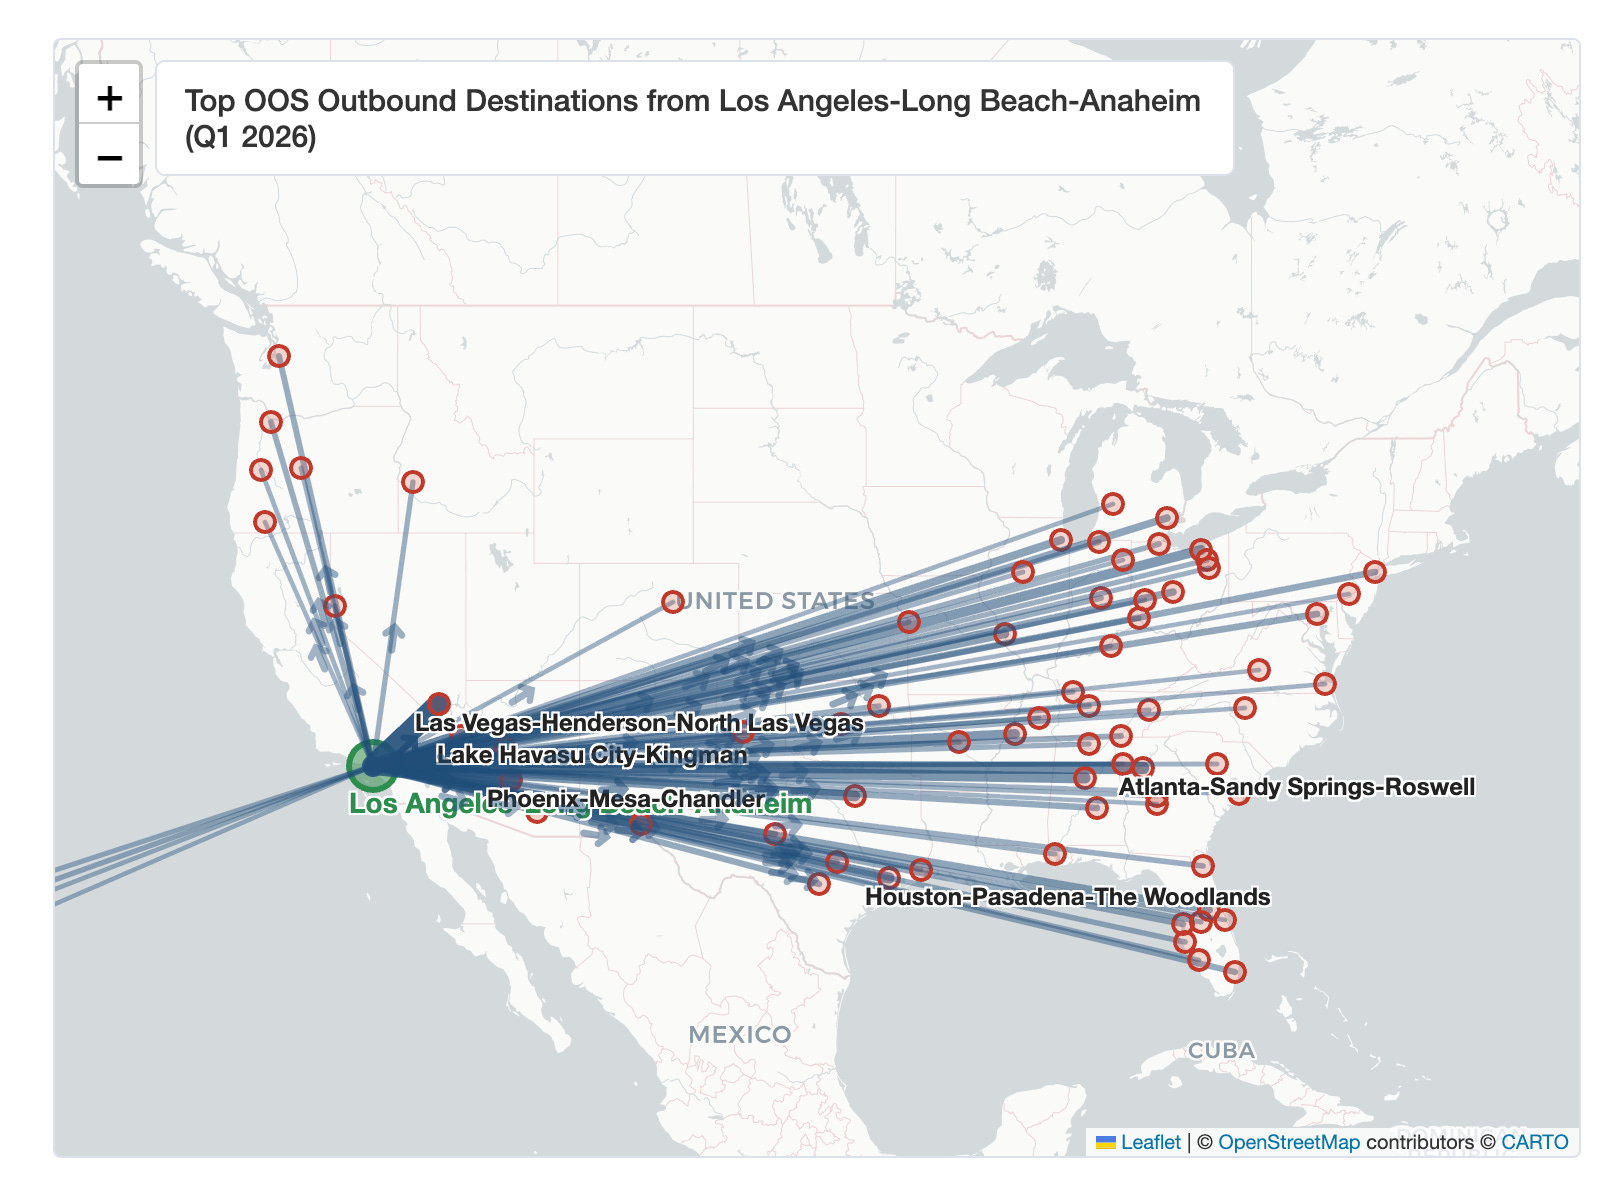
Investment Flow Analysis
Investment sources into major destination markets show patterns largely consistent with prior years, with two notable observations:
First, California is the #1 source state for nearly every major destination metro in Q1 2026: Memphis (29% from CA), Cleveland (21%), Dallas (21%), Las Vegas (45%), Columbus (16%), Indianapolis (18%), Phoenix (19%). California-domiciled buyers continue to show up across three broad trades: yield in the Midwest, second-home and vacation exposure in Florida, and relative affordability in Texas, Arizona, and Nevada.
Second, Florida is now a major source state, not only a destination. It ranks top-3 in Detroit (17%), Cleveland (13%), St. Louis (14%), and top-5 in Memphis, Birmingham, and Indianapolis. Florida-domiciled buyers, including LLCs that may be tied to principals who migrated to Florida during the COVID period, are deploying capital into Midwest yield trades. However, the absolute volume of FL-to-other-state OOS deployment in Q1 2026 was the lowest first-quarter reading since Q1 2023, down 16% YoY and 30% from the Q3 2021 peak. Florida ranks high partly because other source states have pulled back faster.