

2025 ZIP Codes With The Most Investment Activity
An analysis of where investors bought single-family homes in 2025
Executive Summary
We analyzed 2025 single-family purchase data across 27,000+ ZIP codes to identify where investors are most active. Key findings:
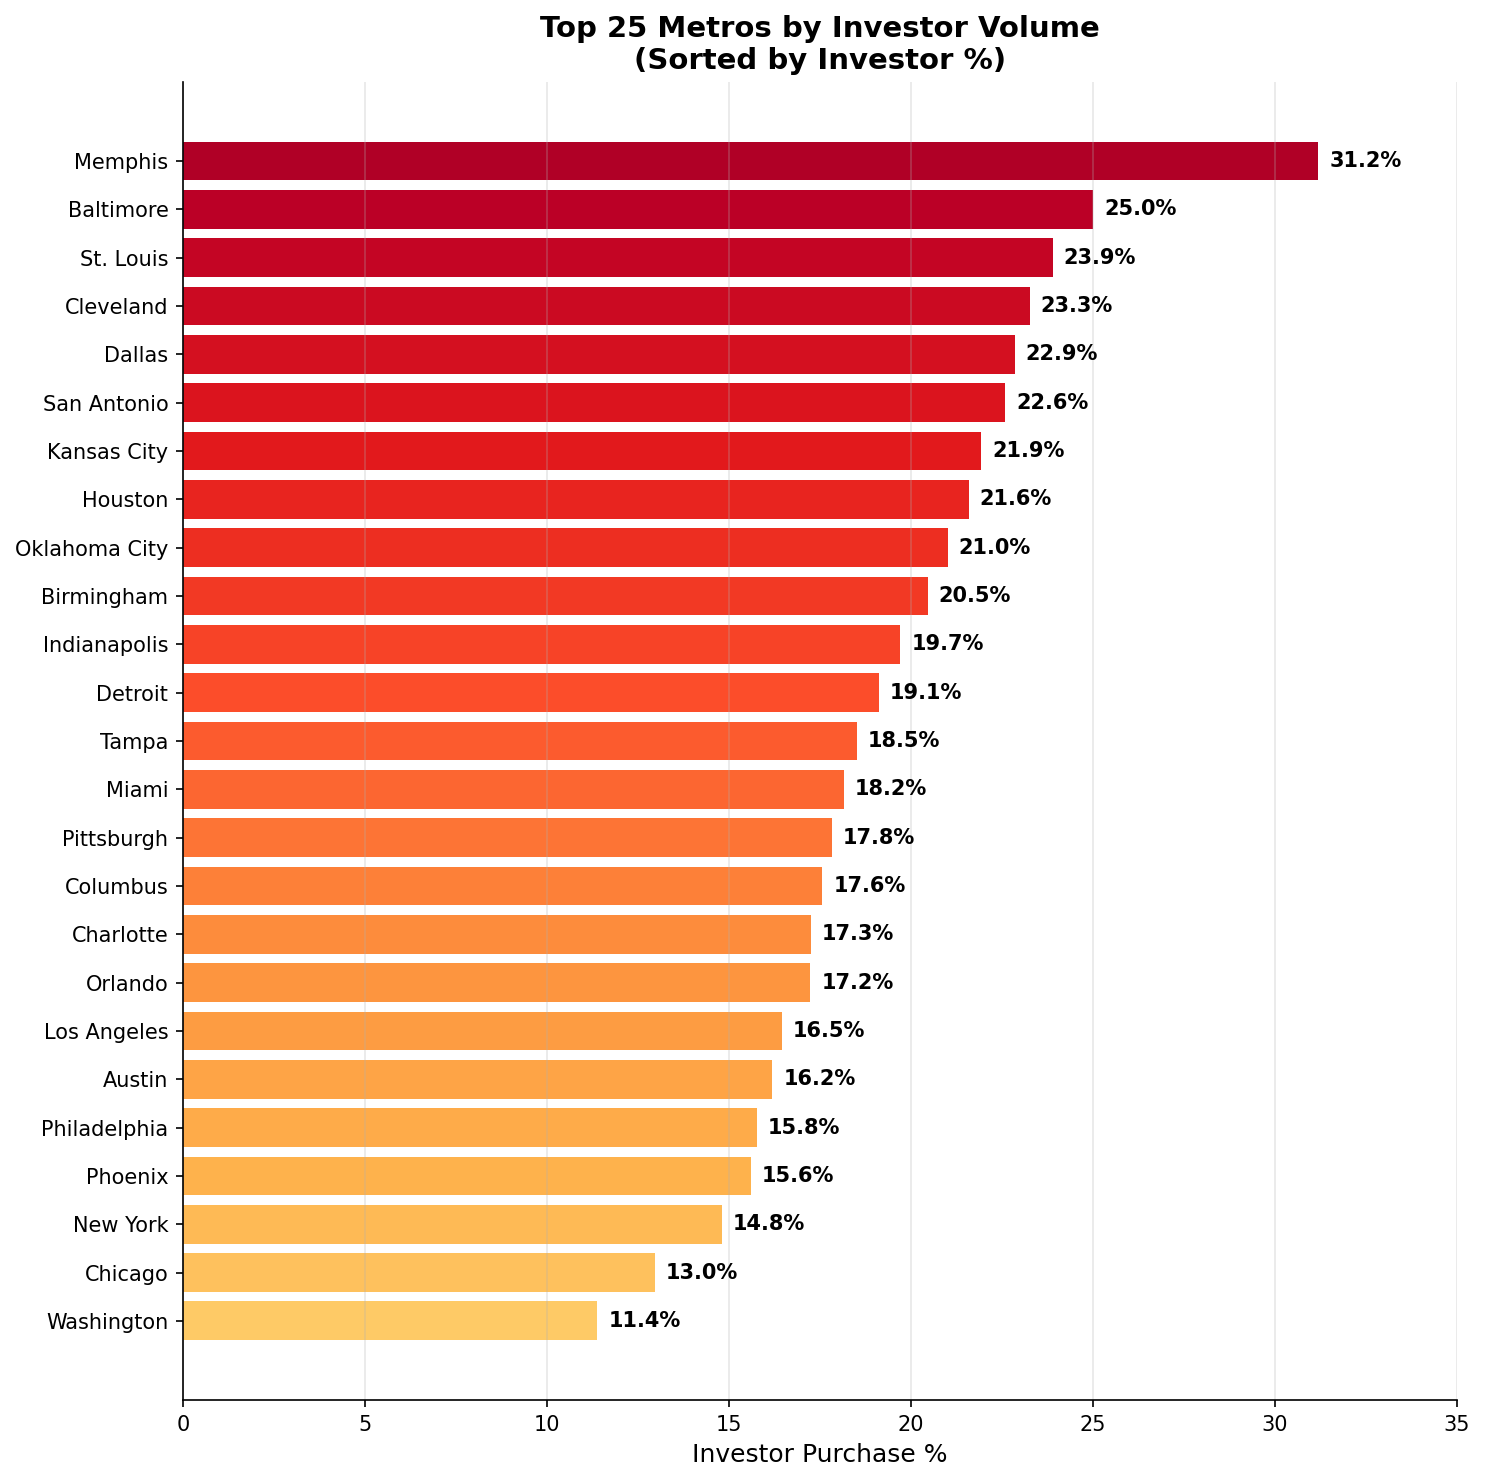
Midwest dominates for investor concentration: St. Louis (25.0%), Kansas City (21.9%), Detroit (19.7%)
Cash remains king: Top markets see 45-60% of investor purchases made in cash
Investors are clustering in three plays: high-yield affordable markets, vacation destinations, and gentrification bets with redevelopment upside
Price band effect: 1 in 3 sub-$100K purchases go to investors; 1 in 10 at $500K+
Where Are Investors Most Active?
The pattern is clear: affordable Midwest and Sun Belt markets with median values under $400K attract the highest concentration of investors. These markets still pencil for cash-flow and offer plenty of redevelopment opportunities in older housing stock.
The Hottest ZIPs
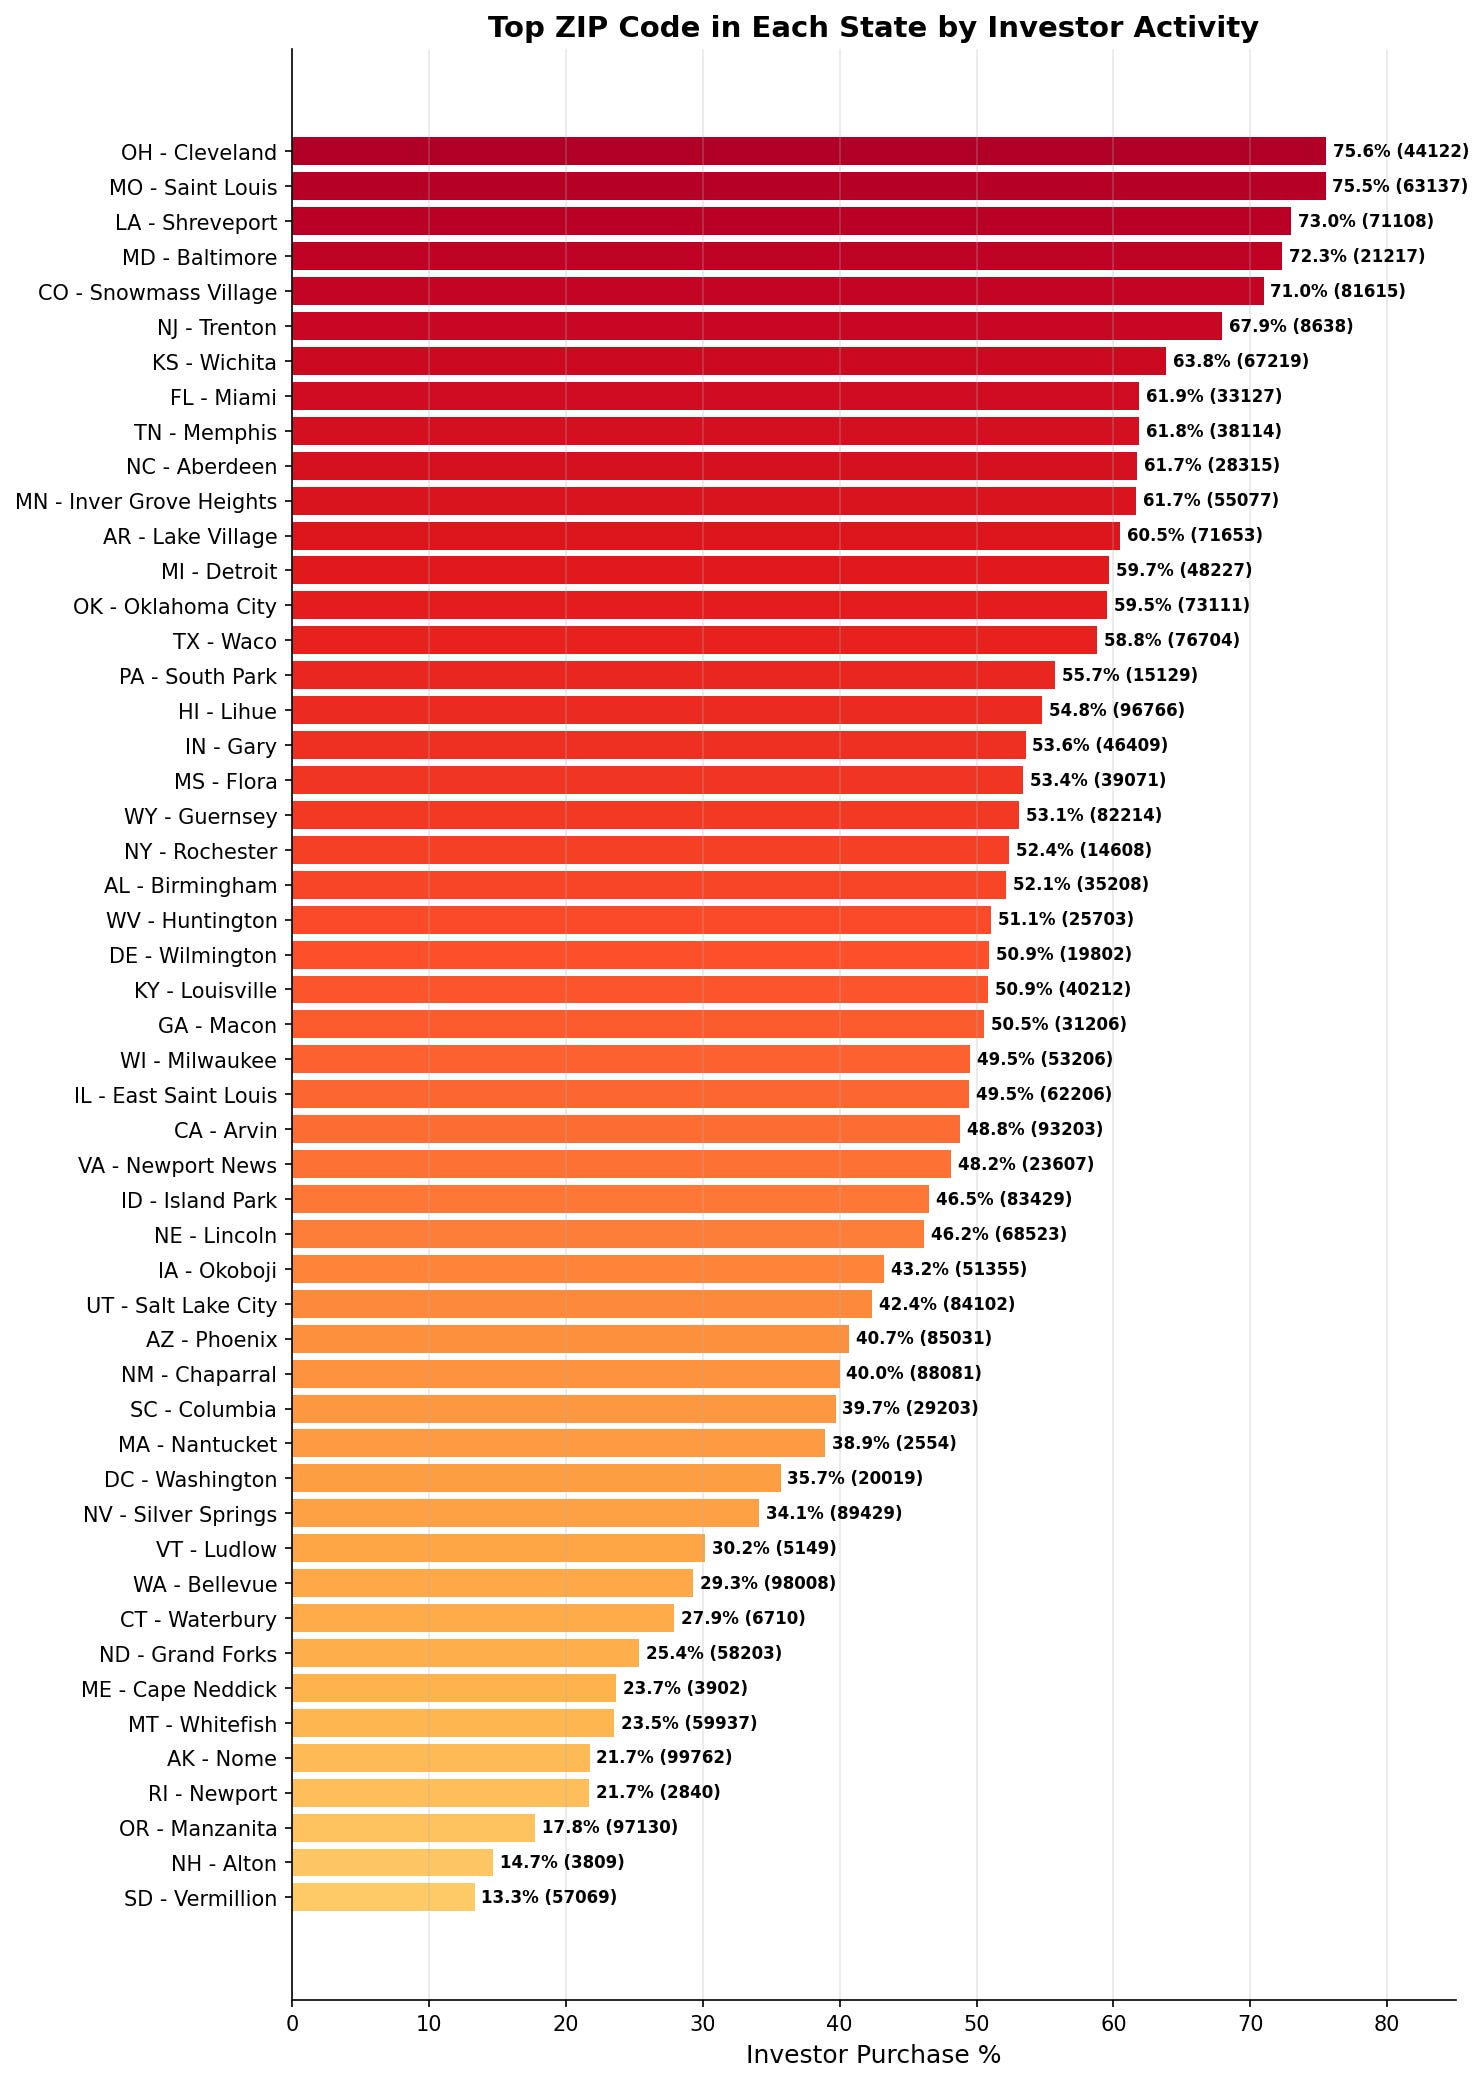
The top investor ZIP codes reveal two distinct strategies: ultra-affordable urban cores where investors chase rental yield, and high-end resort markets where investors buy trophy properties.
St. Louis exemplifies the first strategy. North St. Louis County dominates investor activity, but which ZIP is “hottest” depends on how you measure it.
63136 leads the nation in absolute volume: over 1,000 investor purchases, more than any other ZIP code in America.
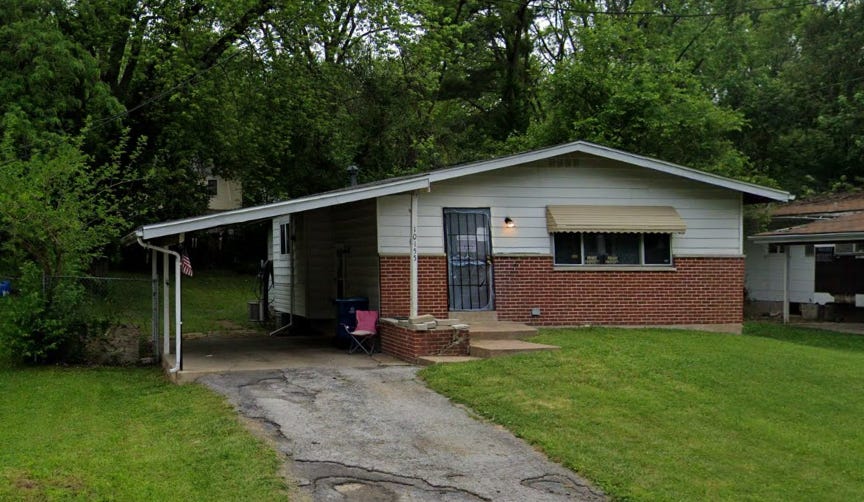
Right next door, 63137 wins on concentration: 75.5% of all purchases go to investors, the highest rate of any major ZIP. But with 598 investor purchases, it’s actually #2 by volume.
Together, these two adjacent ZIPs account for over 1,600 investor purchases in 2025. At sub-$100K median values, investors can hit gross yields in the mid-to-high teens.
At the other extreme: Snowmass Village, CO (81615), with 71% investor activity at a $7.17M median, the highest price point of any top ZIP.

These aren’t yield plays. They’re wealthy buyers using LLCs for ski-in/ski-out trophy properties with privacy and liability protection, not cash flow.
In markets like Miami’s Wynwood (33127), redevelopment is the play.
Once a warehouse district, Wynwood became an arts destination after murals and galleries transformed it. Now at a $584K median and 61.9% investor share, buyers are betting on continued transformation.
Top ZIPs By Investor Volume
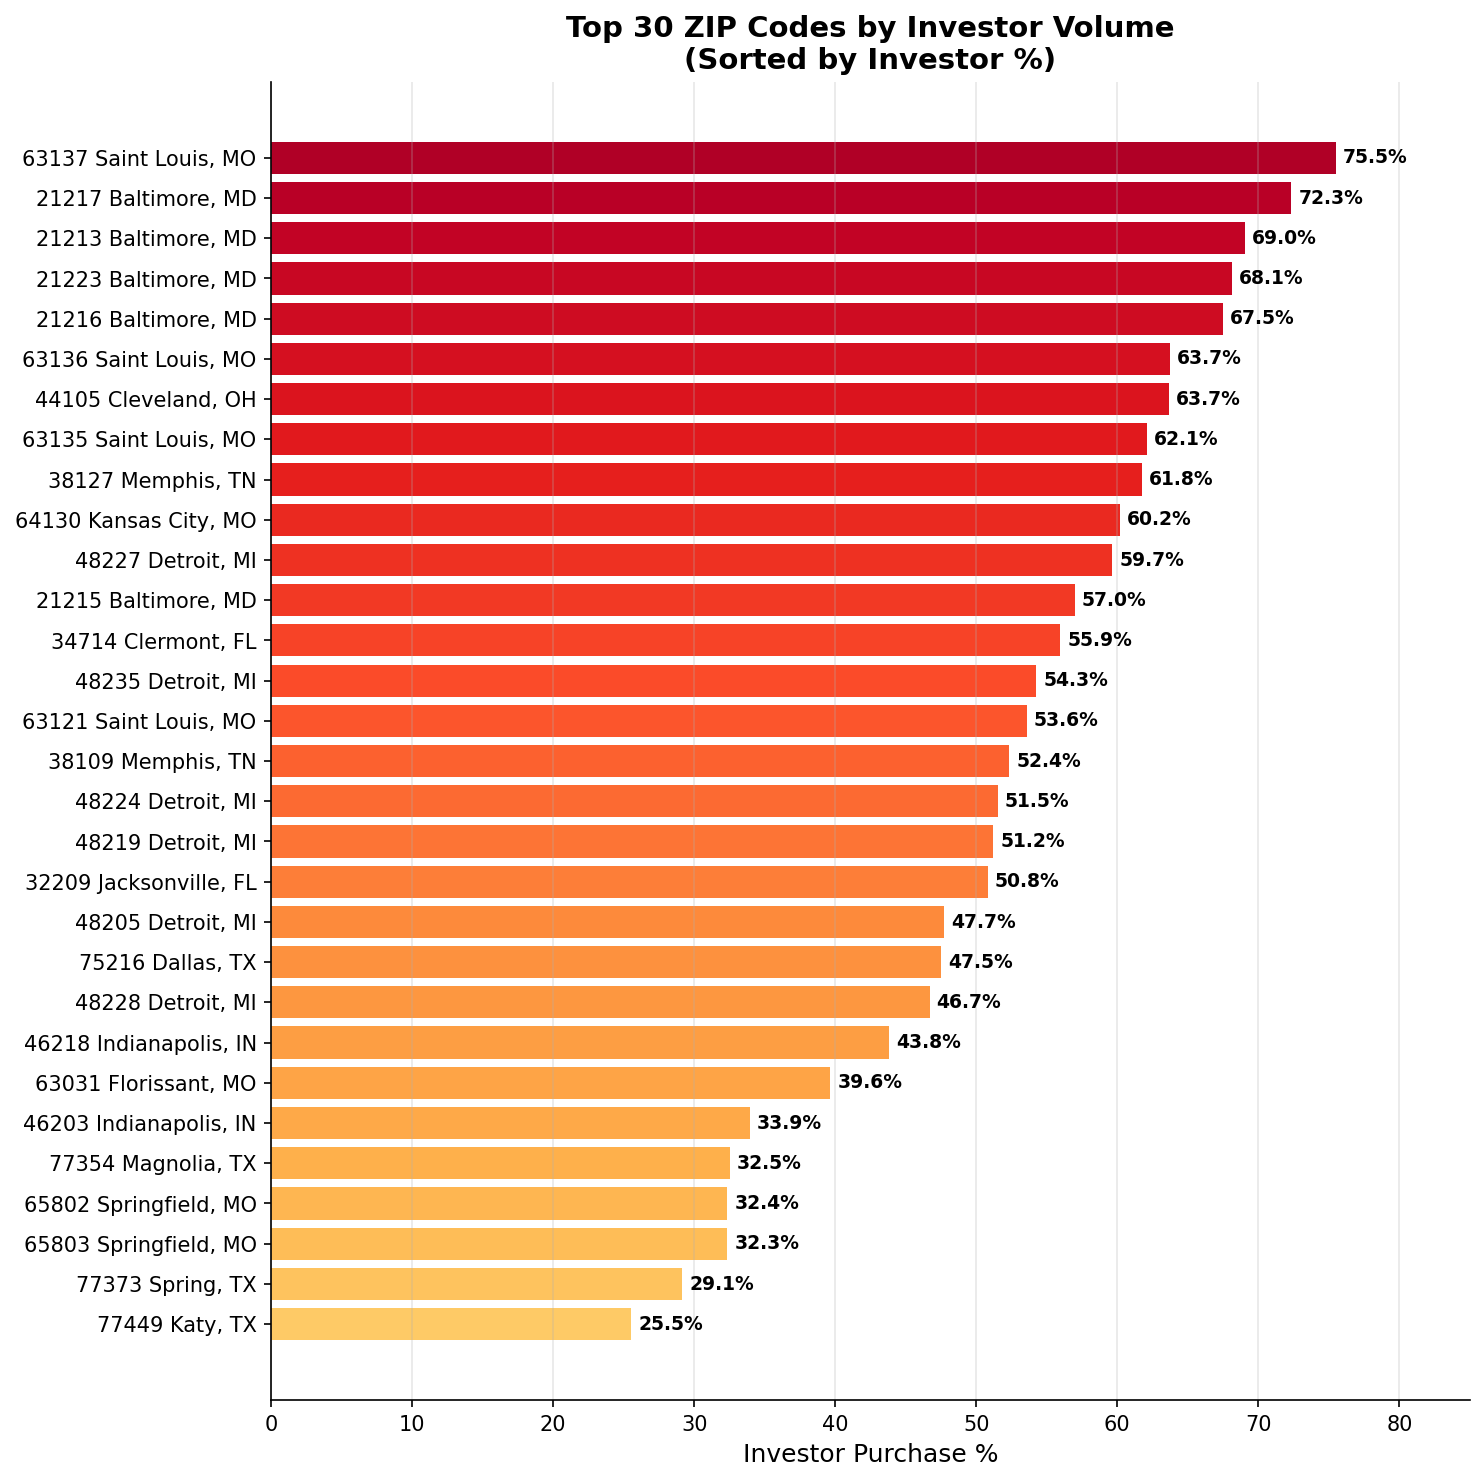
The top 15 ZIPs by volume cluster in just five metros: St. Louis (4), Detroit (5), Baltimore (3), Kansas City, Memphis, Cleveland, and Dallas (1 each).
The Price Band Effect
One of the clearest patterns in the data: investor activity is inversely correlated with home values.
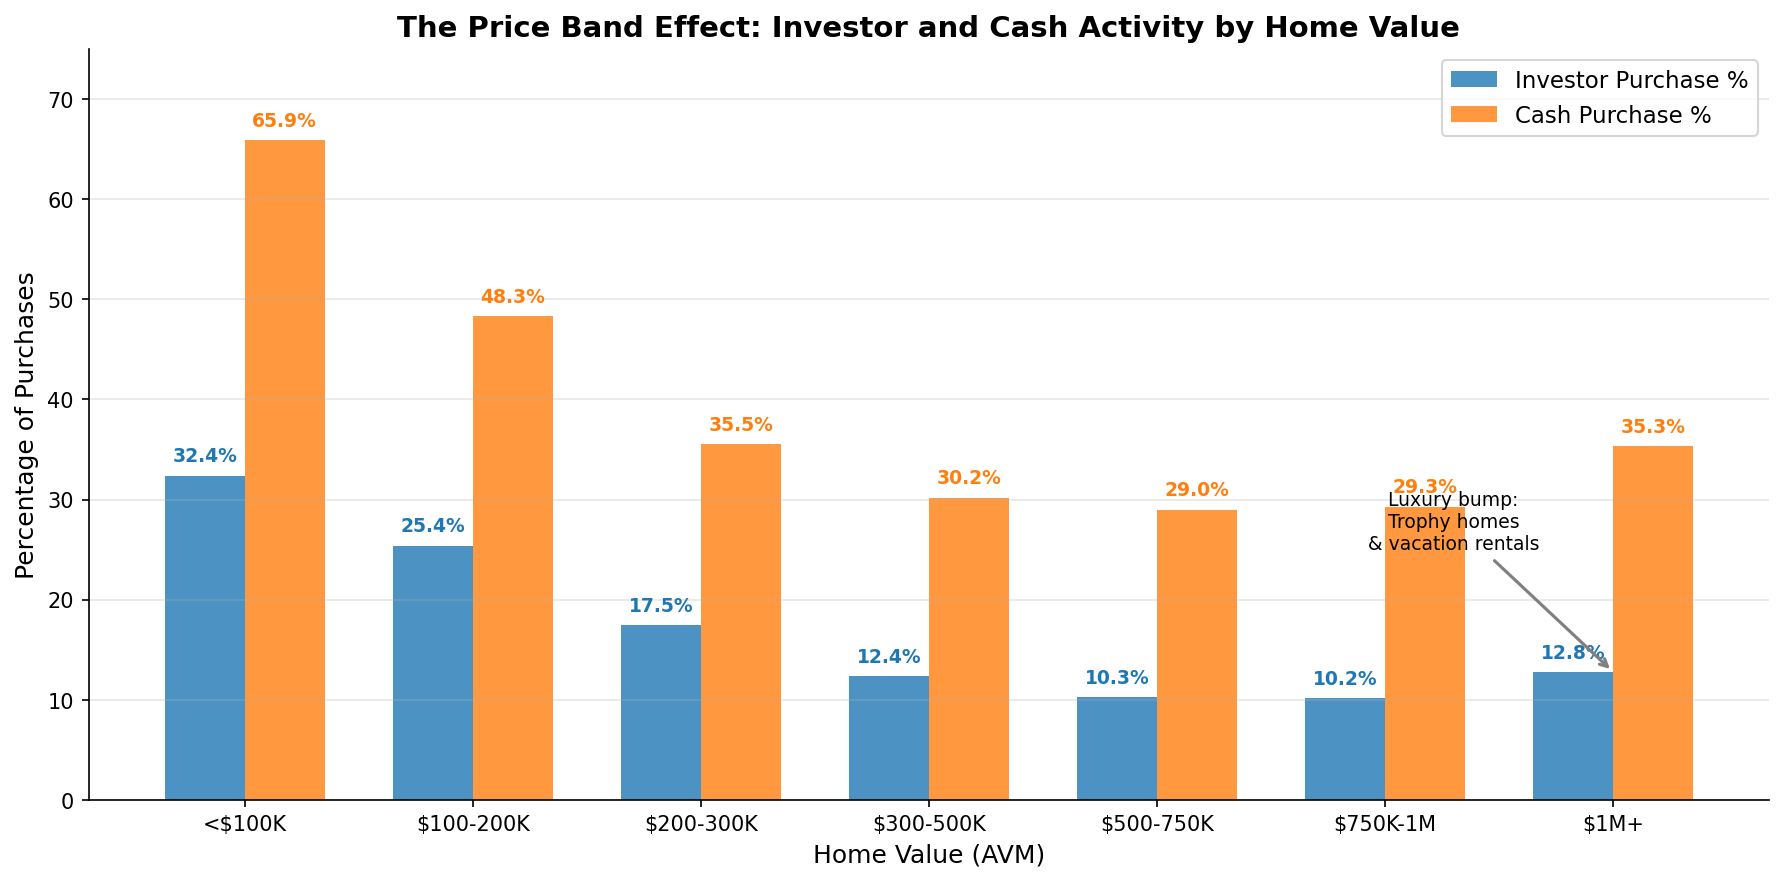
In the sub-$100K band, nearly 1 in 3 purchases go to investors. At these prices, even modest rents generate double-digit gross yields. Often these properties need significant rehab to get them rent-ready.
Investor activity rises again above $1M (12.8%). These aren’t yield plays—they’re LLCs buying trophy homes for privacy, vacation rentals, or speculation.
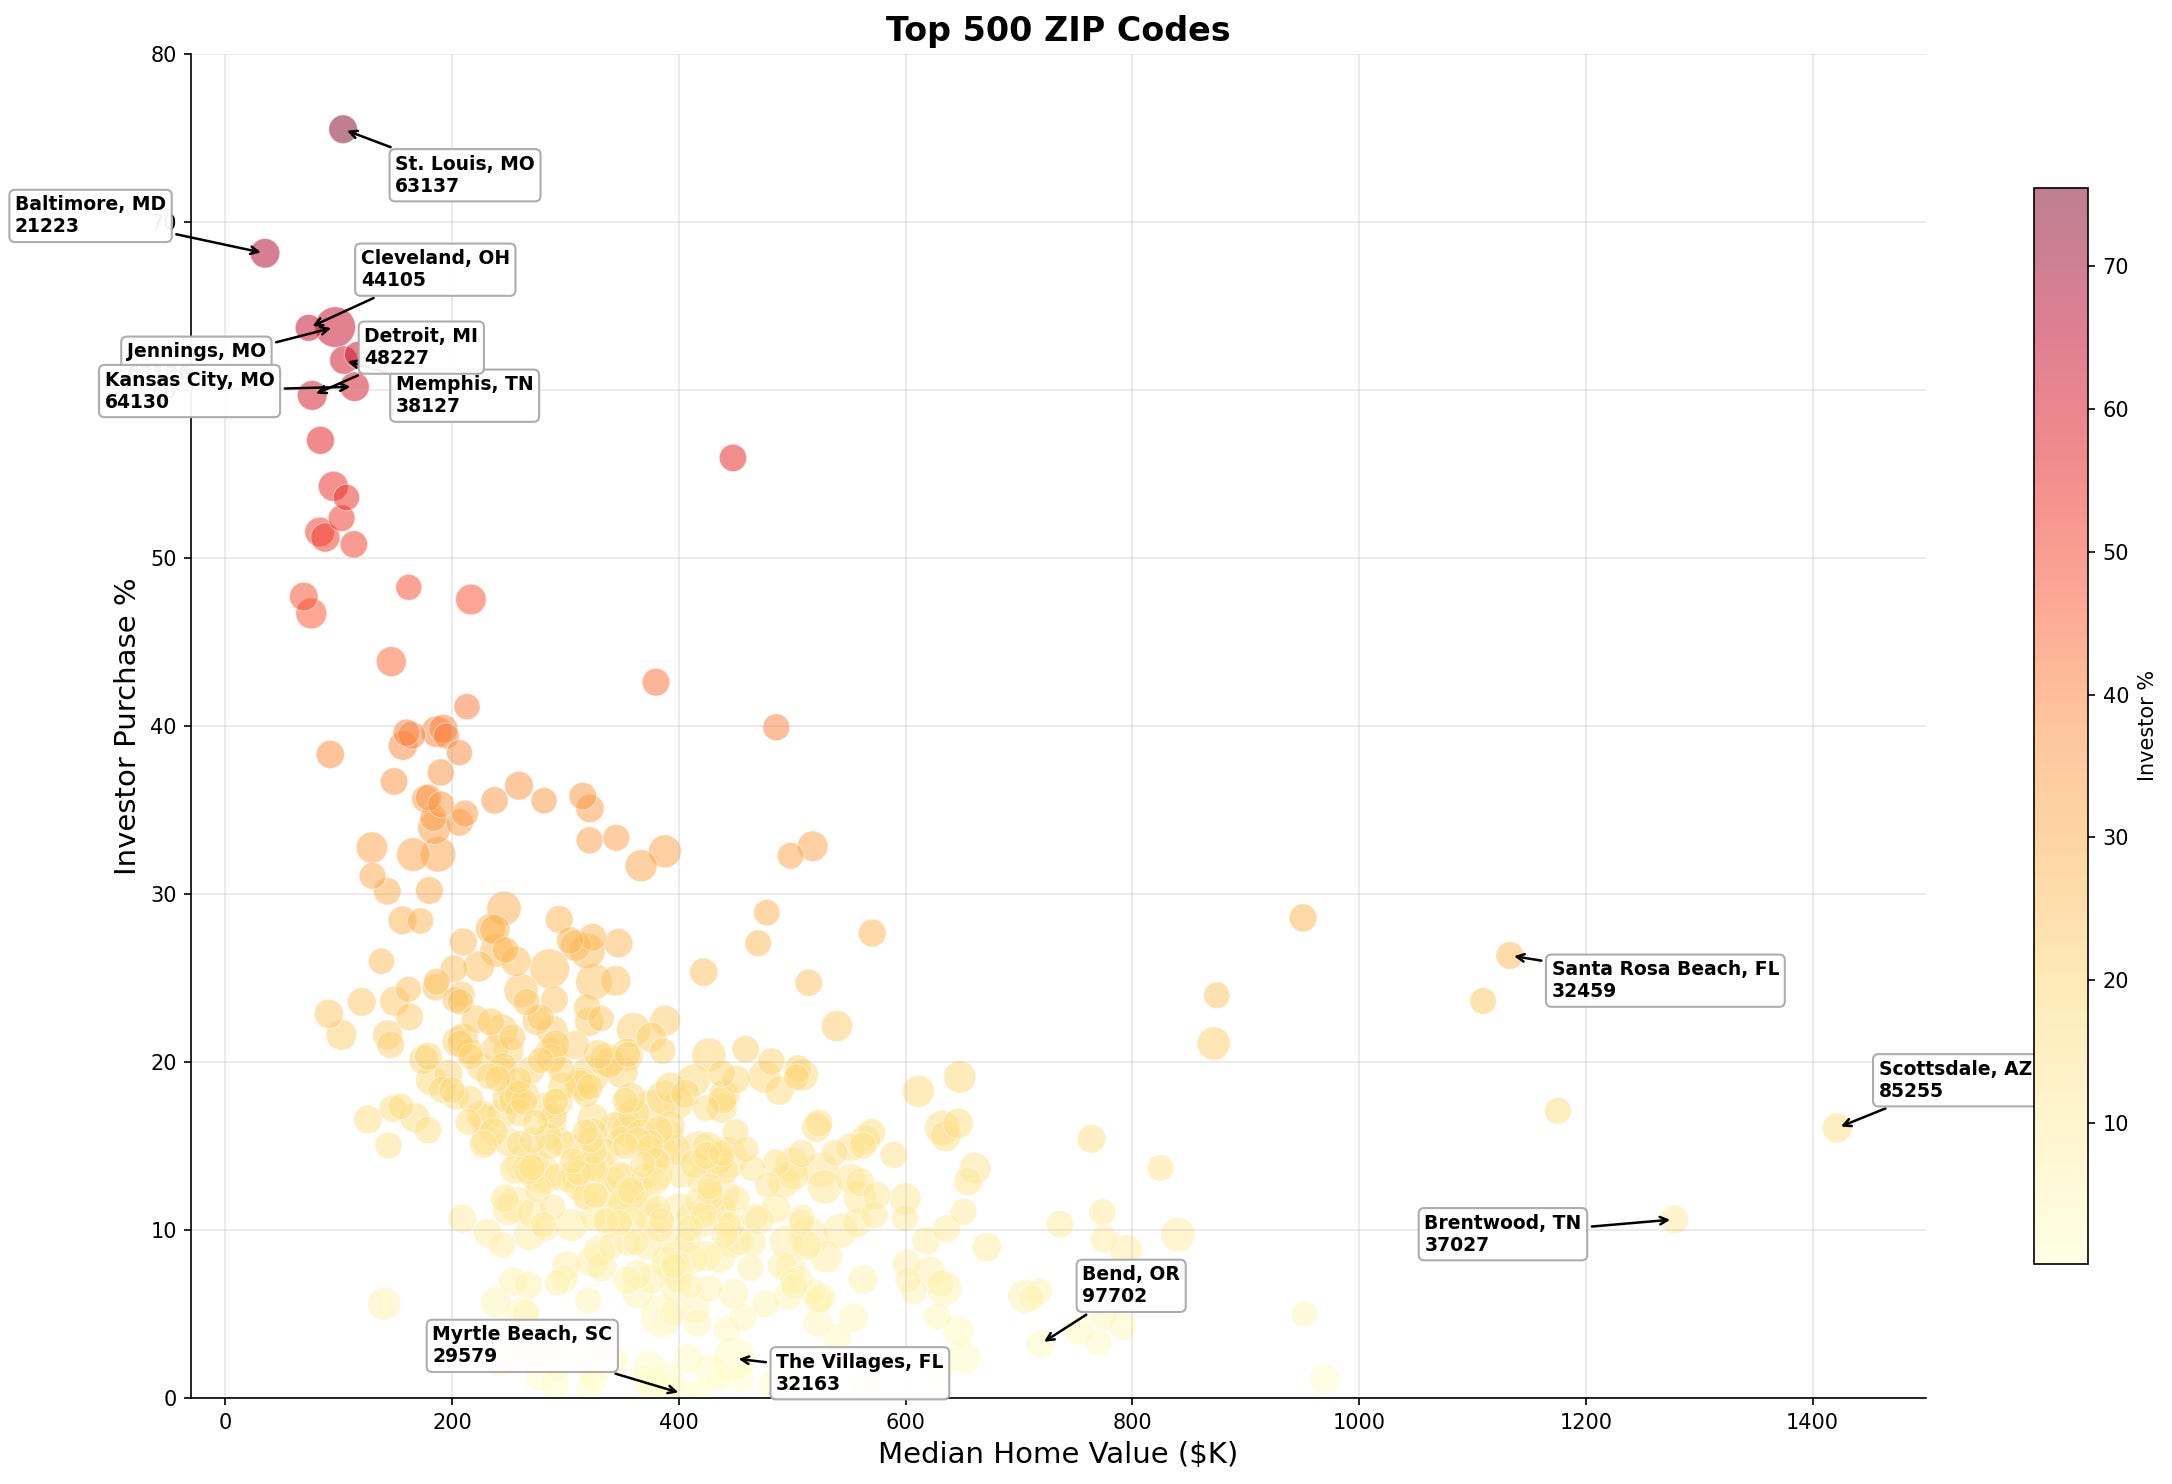
Below: the full range of median home value vs. investor purchase share.
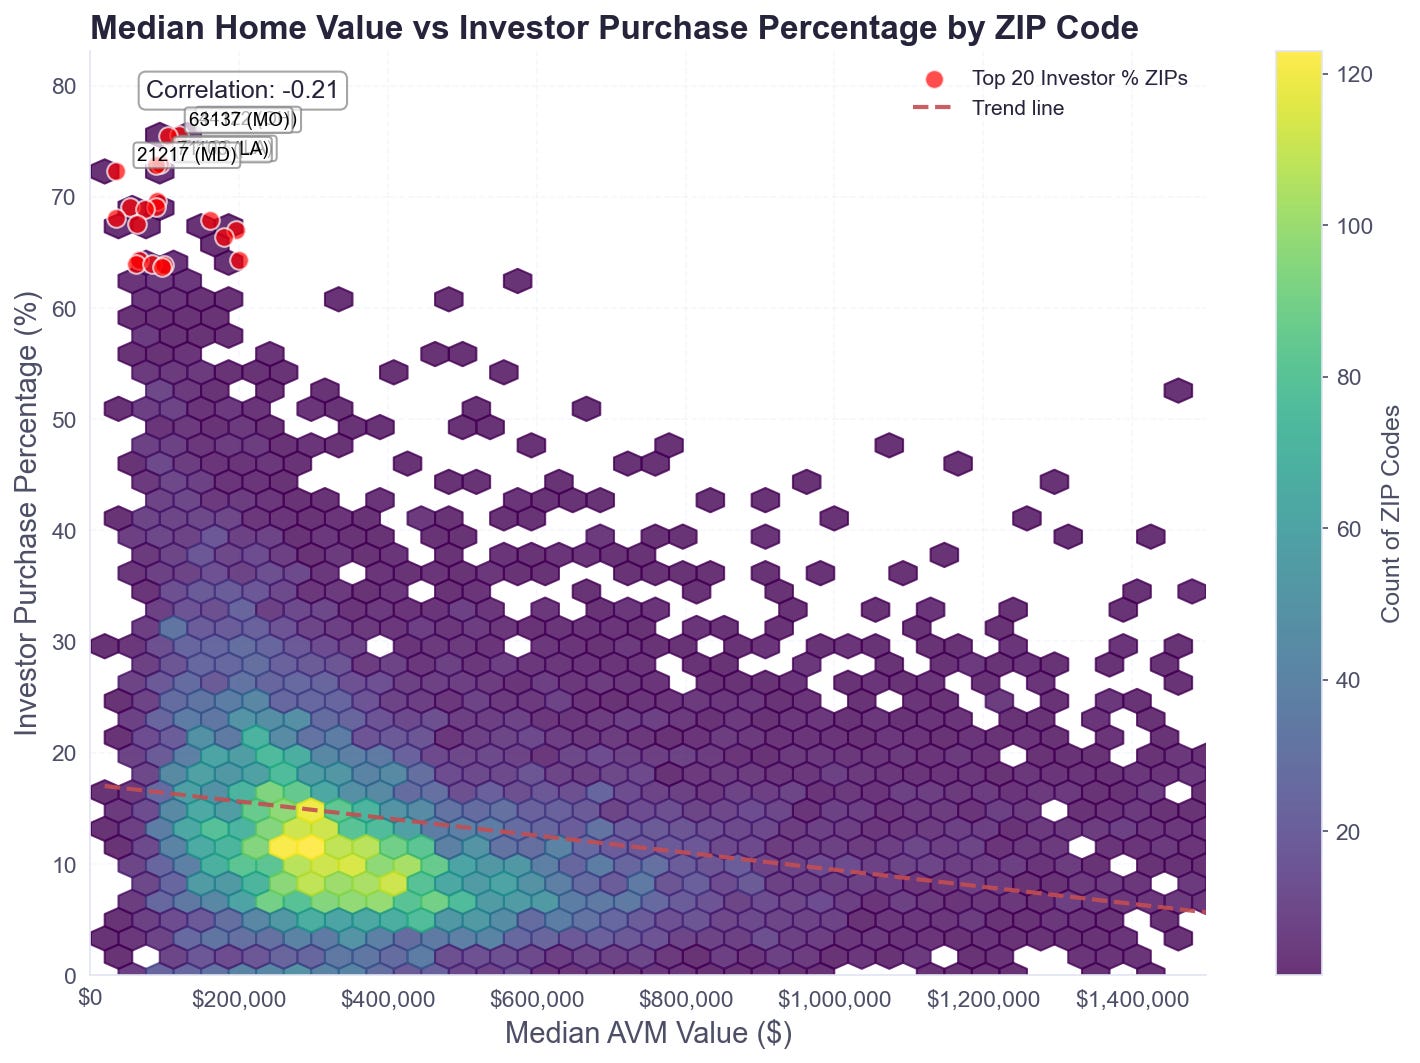
All Properties Purchased by Investors in 2025
Interested in getting a list of all properties purchased by investors in 2025?
Send us an email!