

2025 SFR Rental Acquisitions Overview
Gross Yields, Waning Markets, Gaining Markets, and More
We looked at 80,000 single family homes that were purchased in 2025 and subsequently listed online for rent to see how gross yields and market activity are changing.
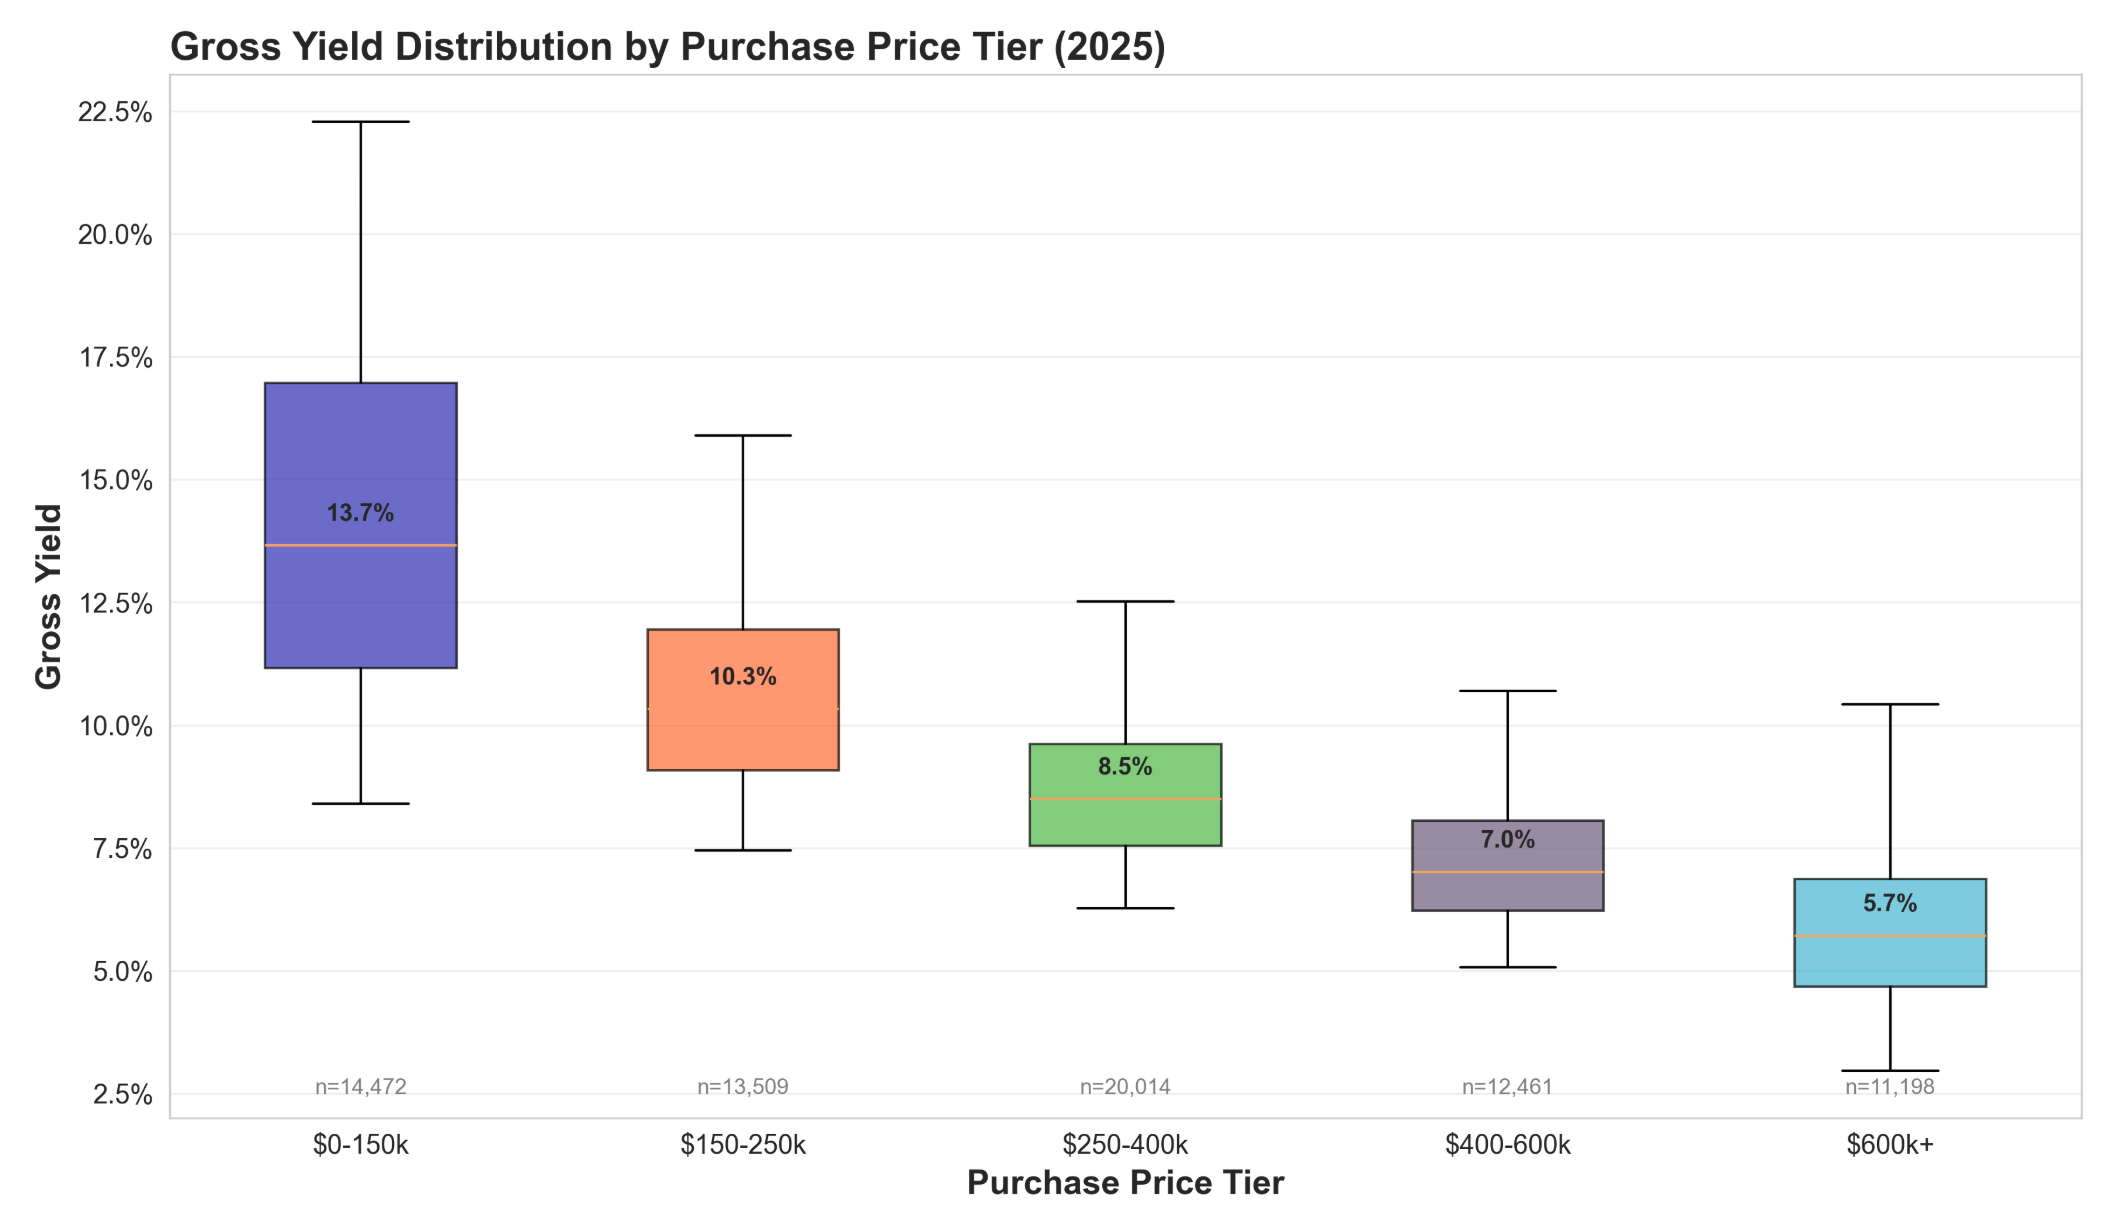
Nationwide, gross yields are coalescing around 9% with an average purchase price in the high $200,000 range.
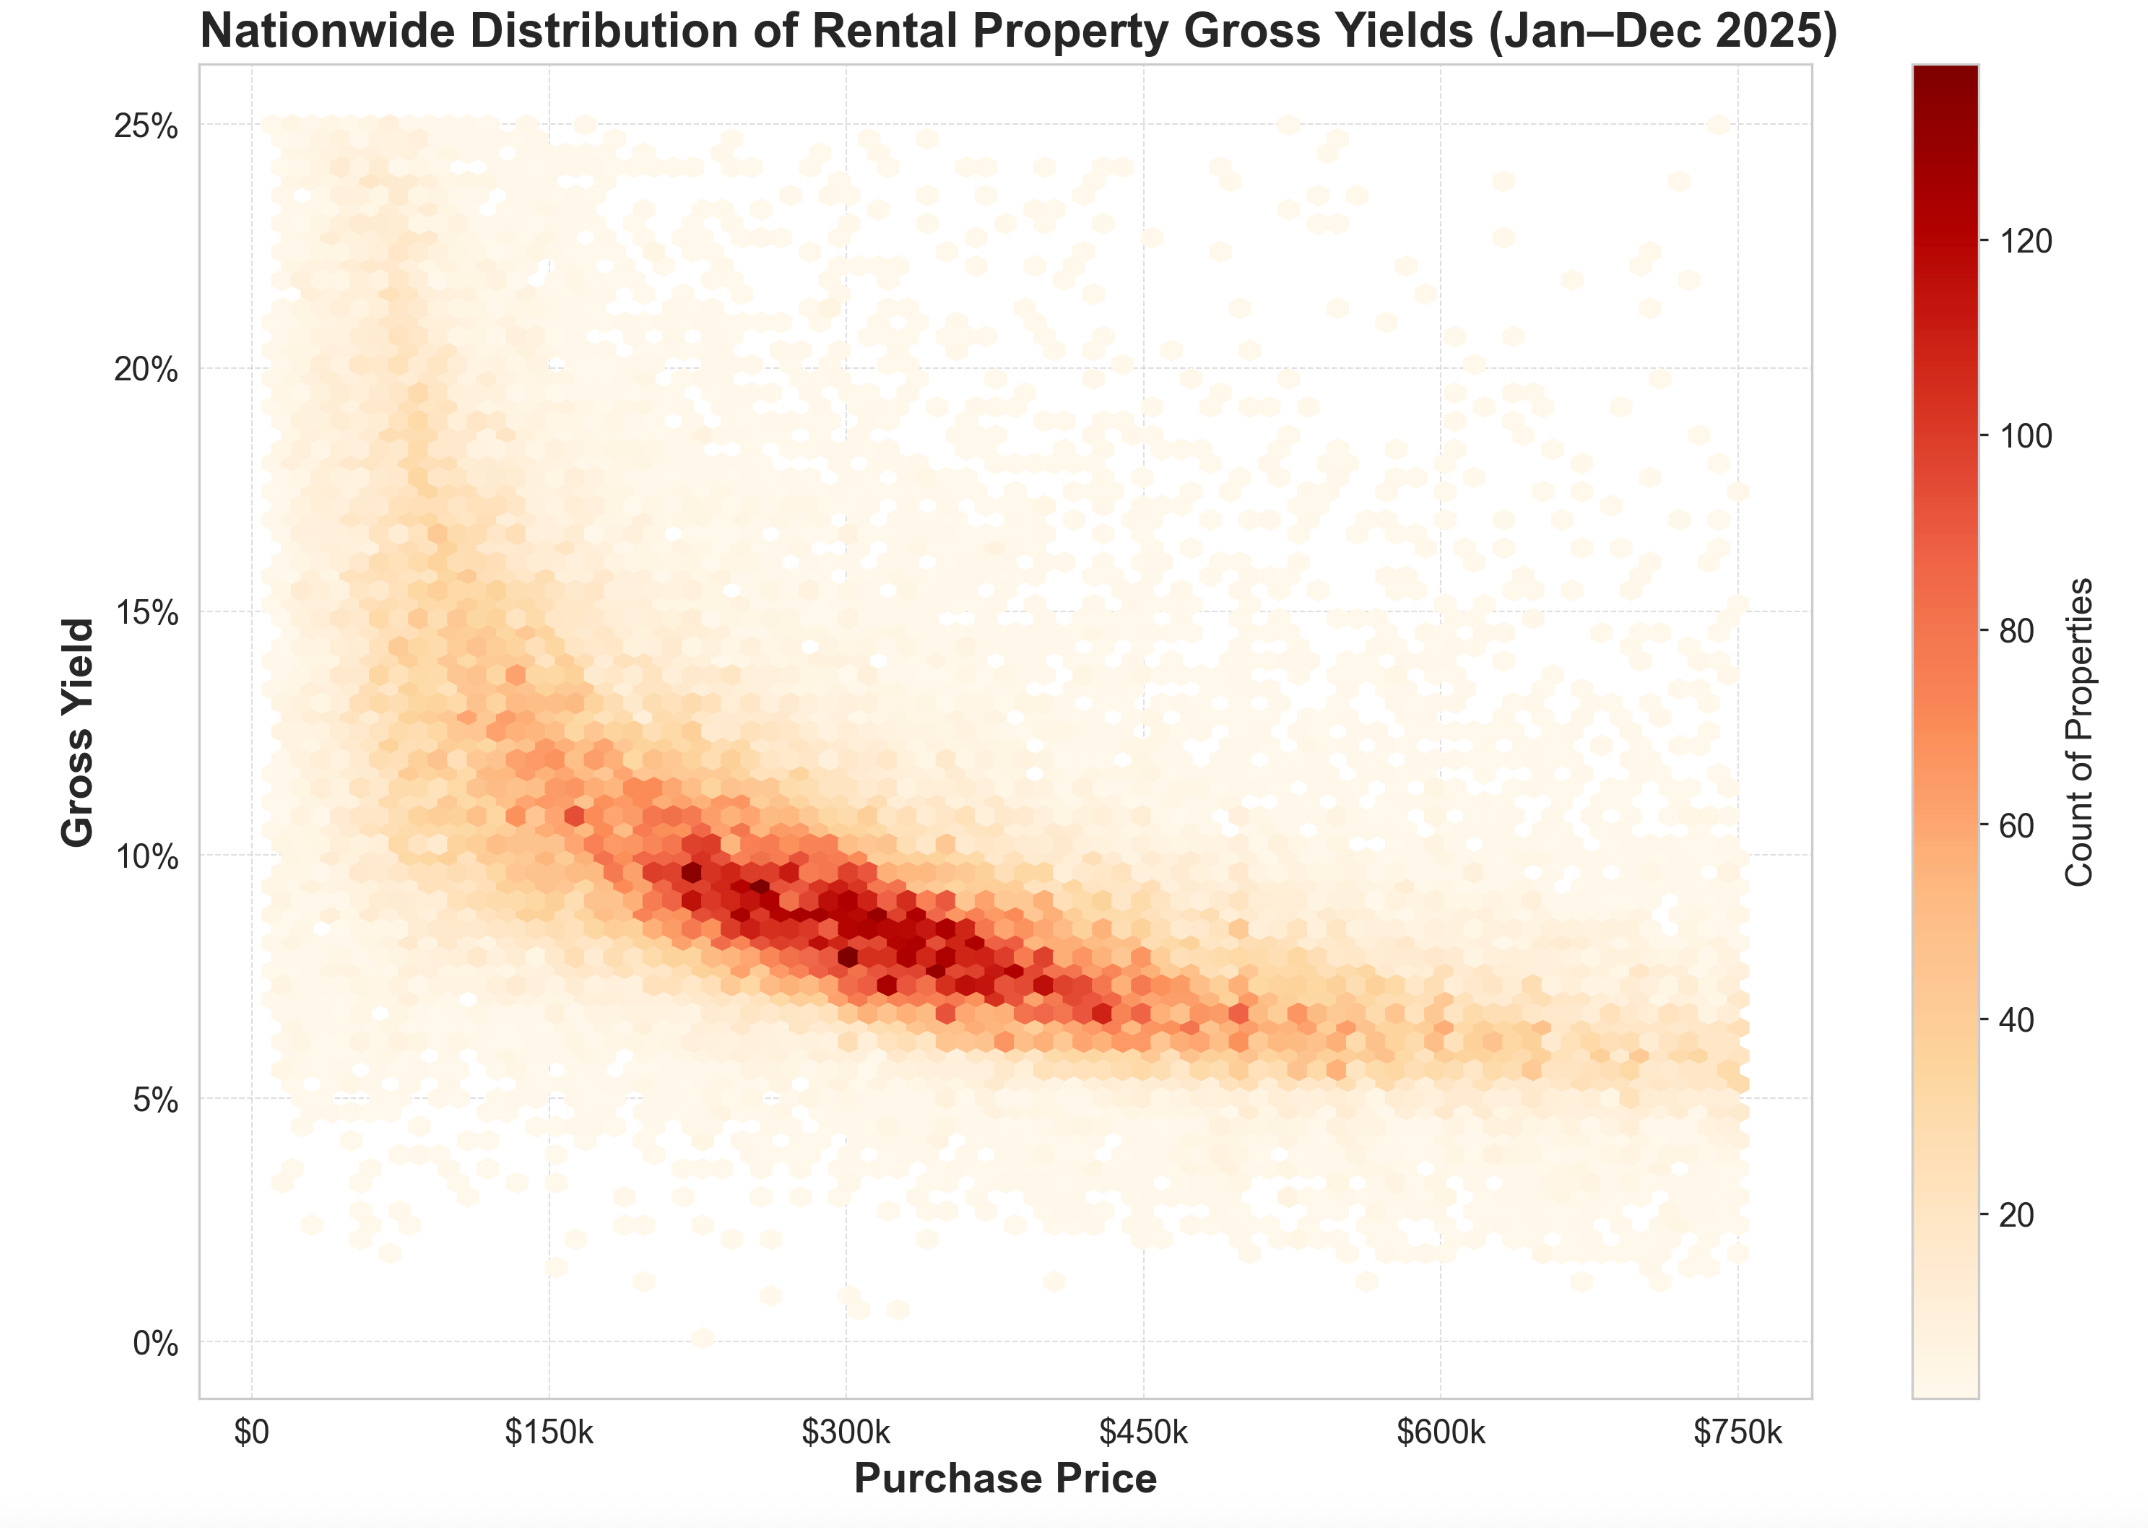
As expected, as purchase price increases, gross yields decrease. Note, this is calculating gross yield (annualized rent / purchase price), so if a property is bought cheaply but needs a lot of work it will have an artificially high gross yield and likely to have higher capex.
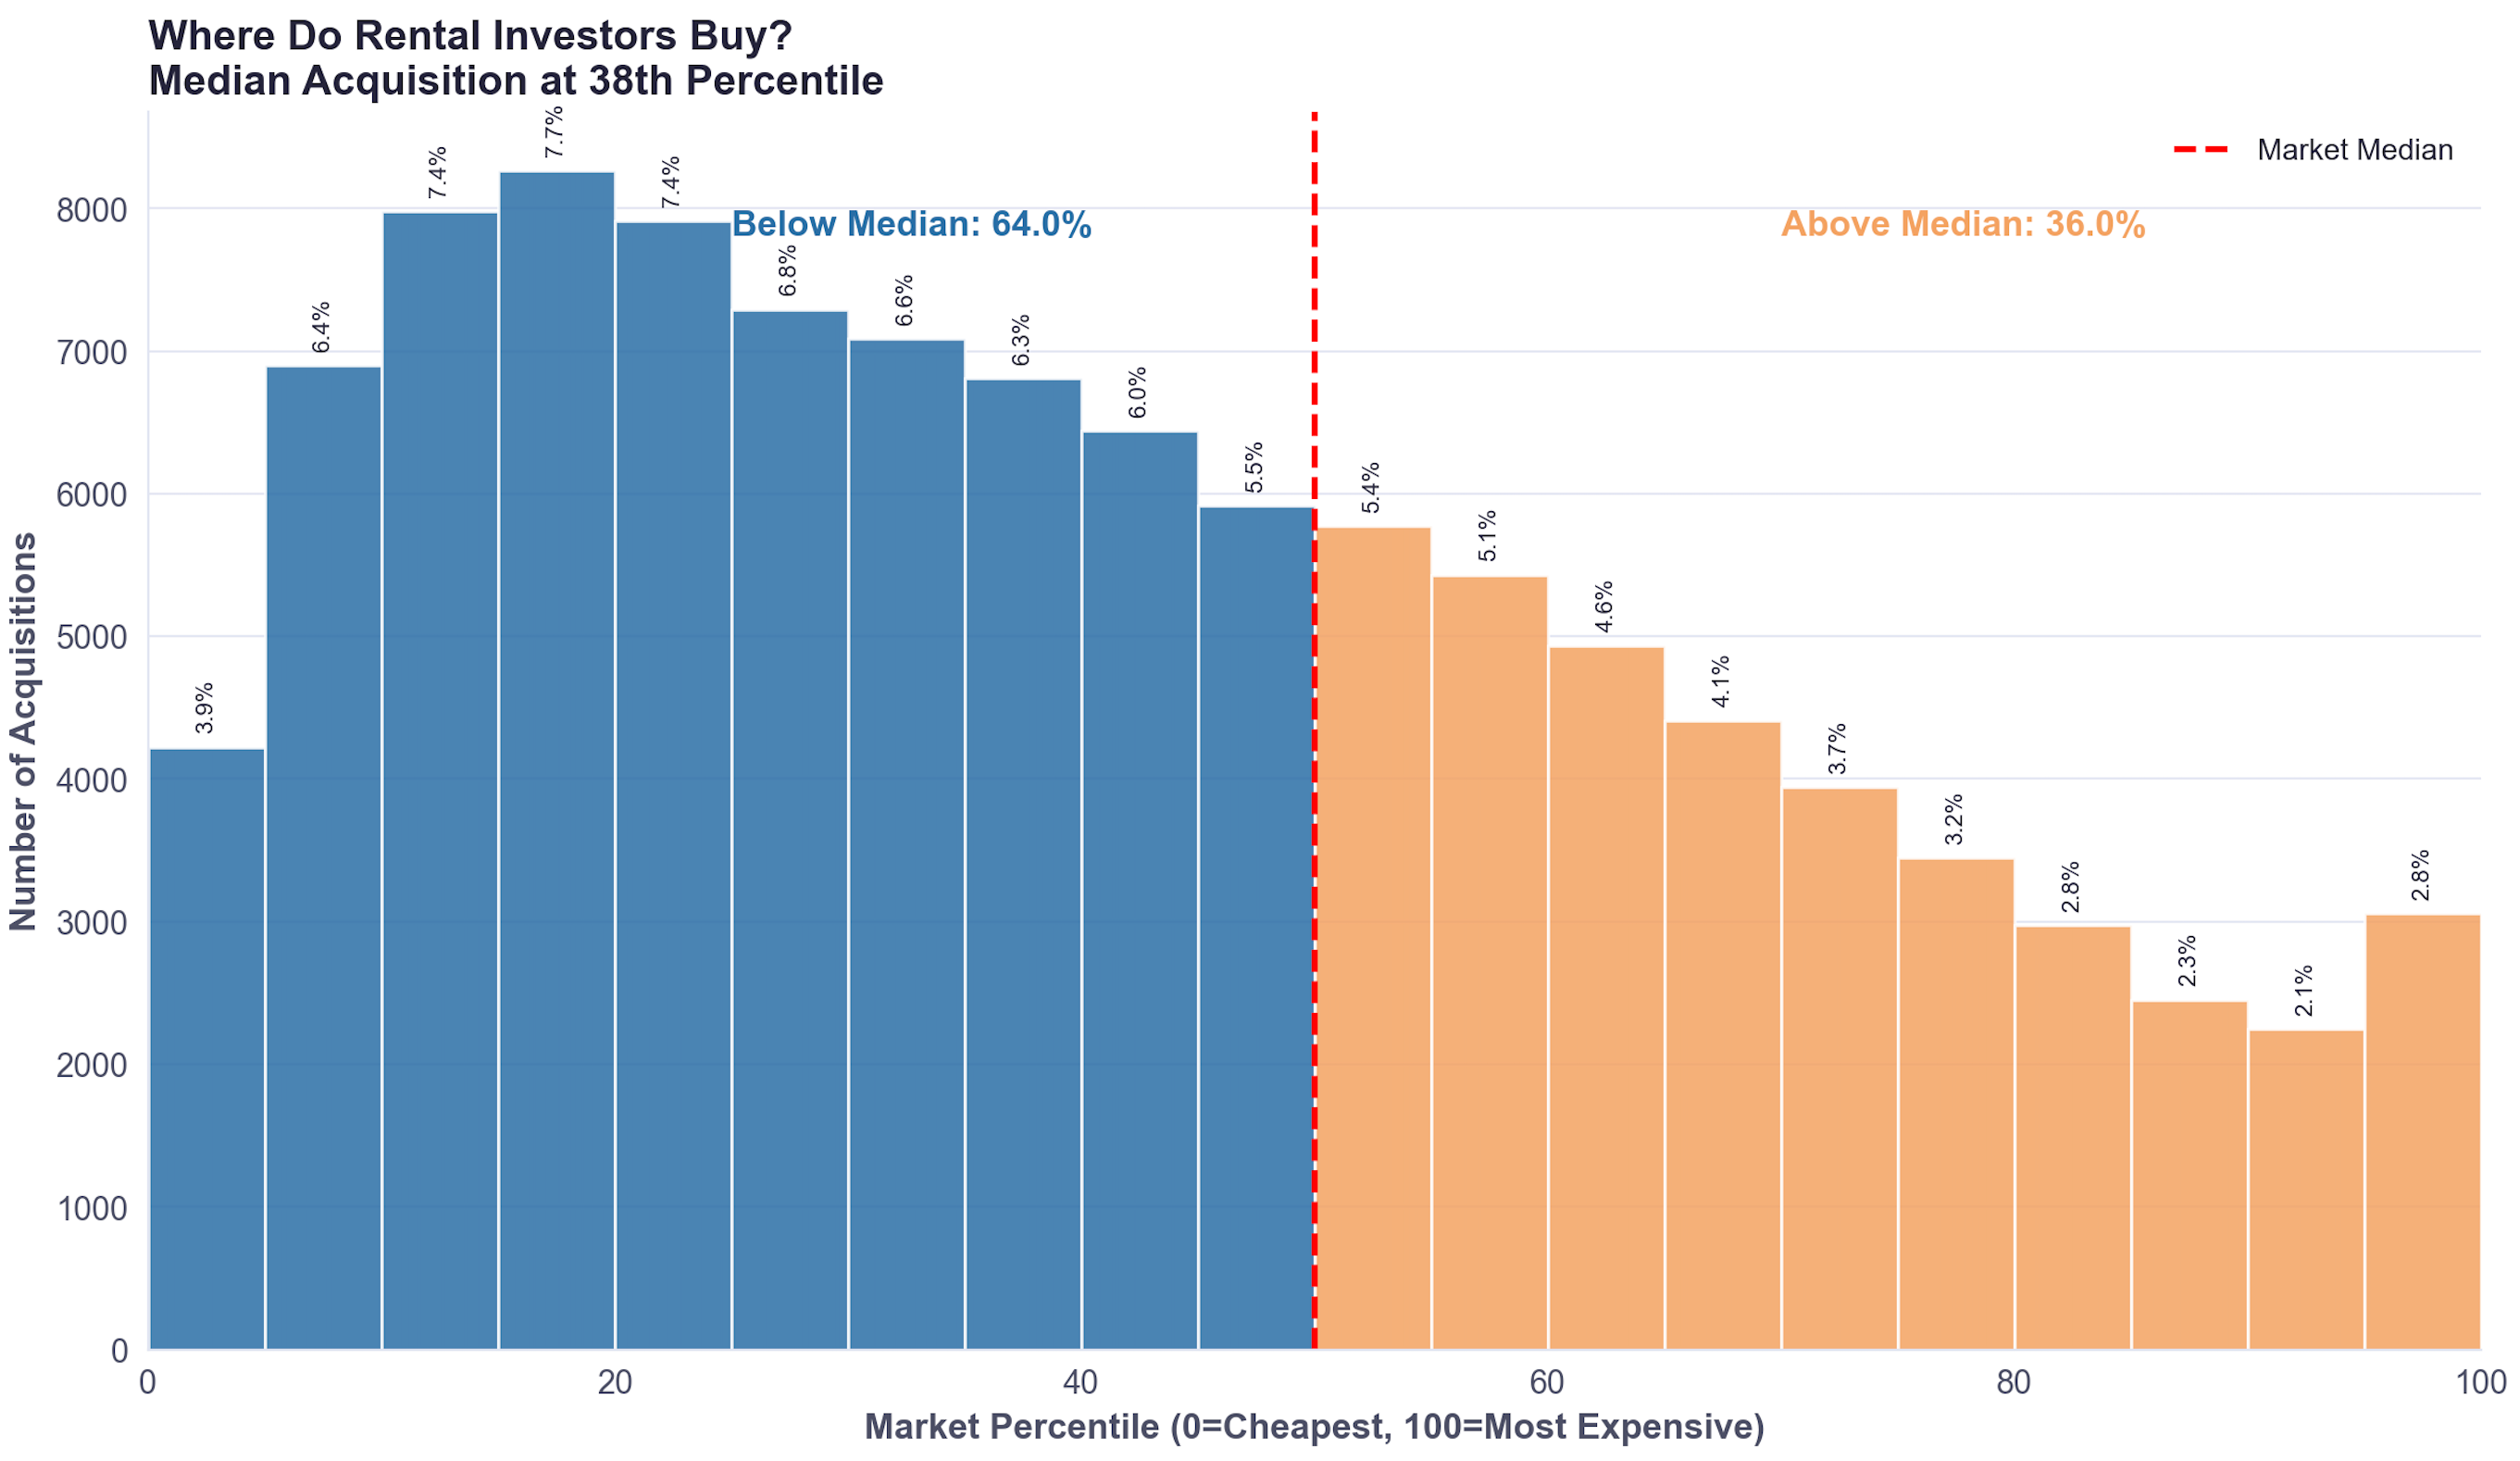
When comparing rental purchases to the median price in their MSA, the majority are bought for under the median and 35% of them were bought in the bottom quartile of price ranges.
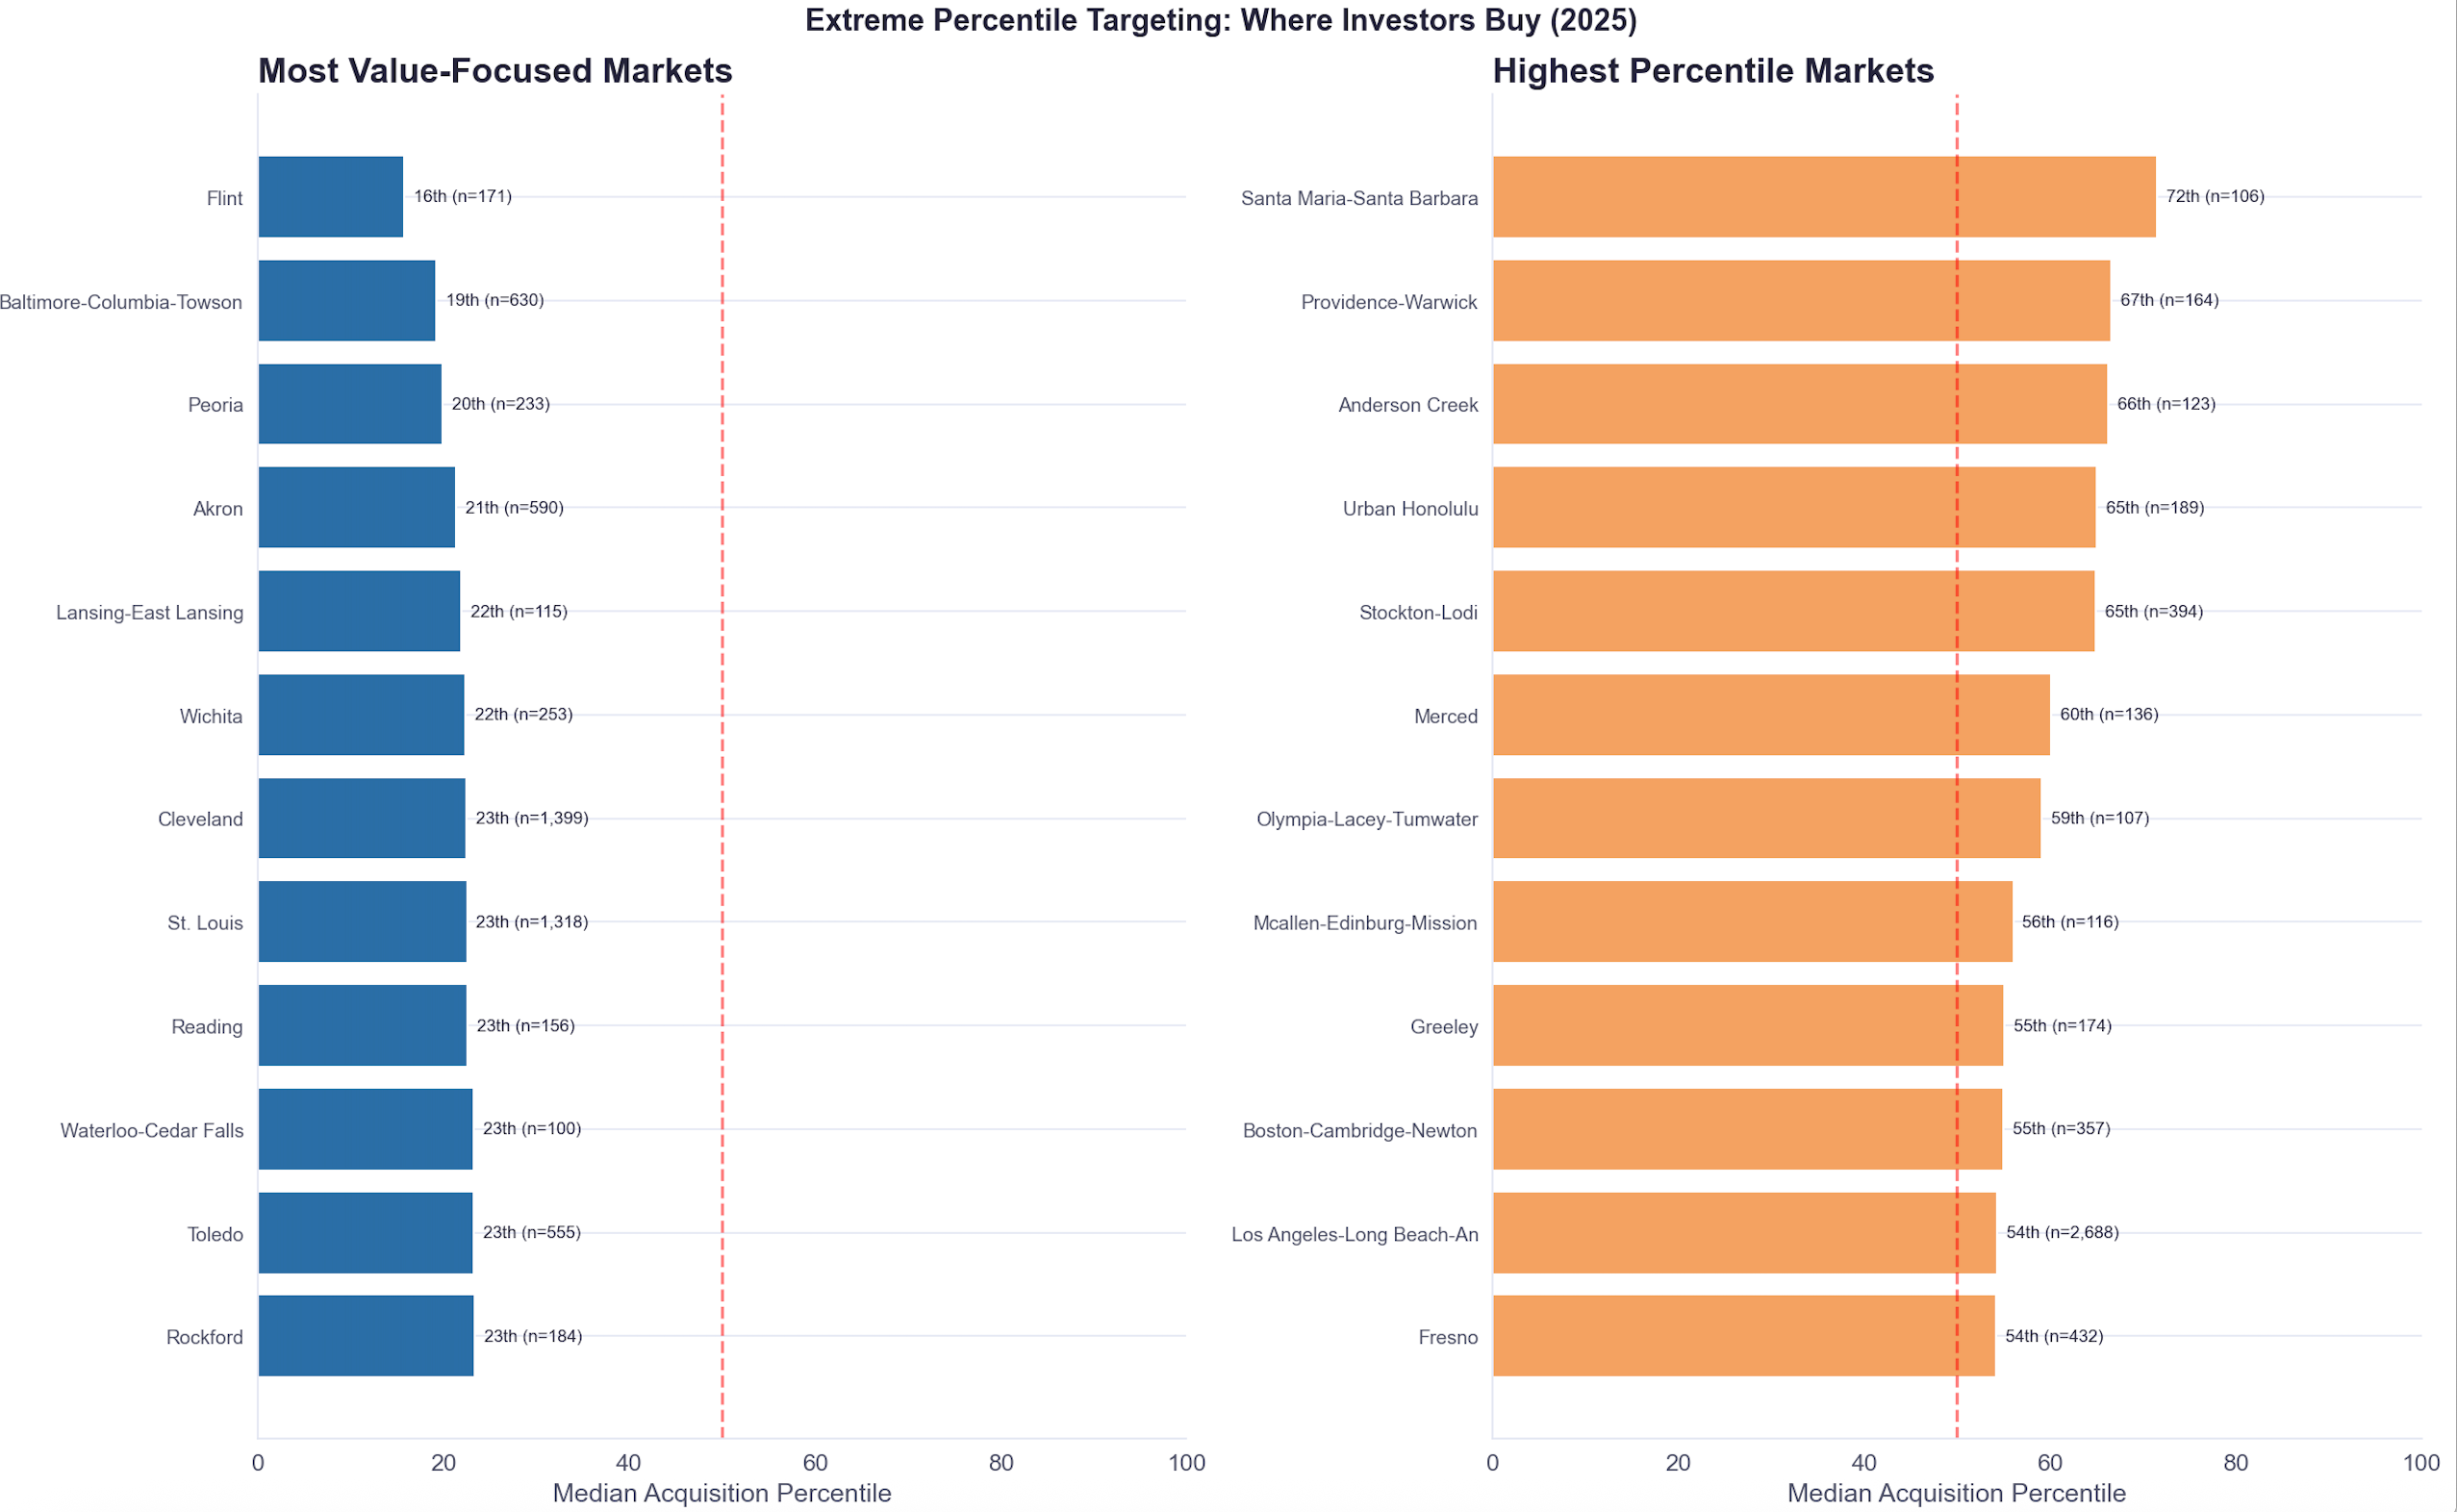
We looked at which markets had the lowest and highest median purchase price for rentals compared to their MSA and found that Rust Belt cities over-indexed on buying cheaper rental properties to rent out with Akron, Flint, and Baltimore having a median rental purchase price in the bottom quarter percentile of the market.
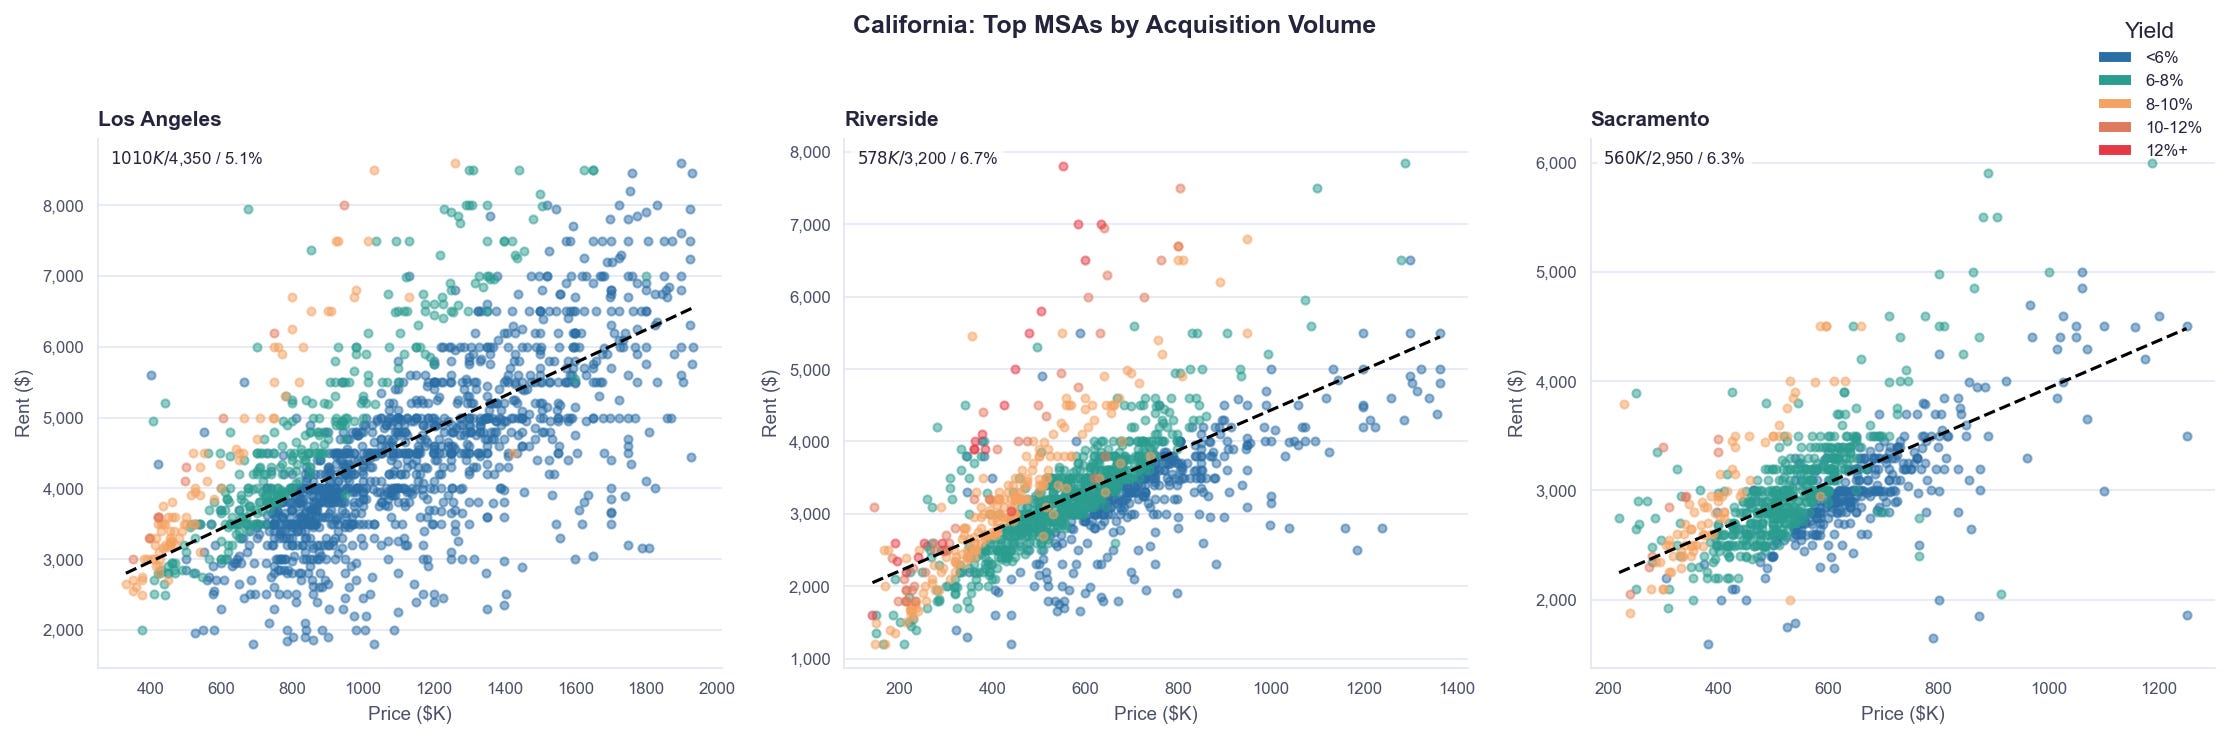
California on the other hand dominated above market median rentals, especially the Central Valley cities like Bakersfield, Visalia, and Modesto.
As a reminder, the subset of data we’re looking at is properties that were purchased this year and subsequently rented out via an online portal which leads to a variety of biases.
That being said, the markets that gained the most compared to 2024 were a lot of core SFR markets including Atlanta, Dallas, and Phoenix. Strong high yield cities like Detroit and Cleveland also saw the most volume increases.
Austin, and many Florida metros topped the charts for the largest rental acquisition decreases. Plagued by sharp home price depreciation and increases in operating costs, a lot of the cities represented have become much more difficult to acquire rentals in.
Rust belt cities topped the charts in markets that saw yields increase. As we previously noted - workforce housing has faired especially strong in rent growth. A lot of the markets topping the yield increase charts are ones that have strong acquisition of workforce housing.
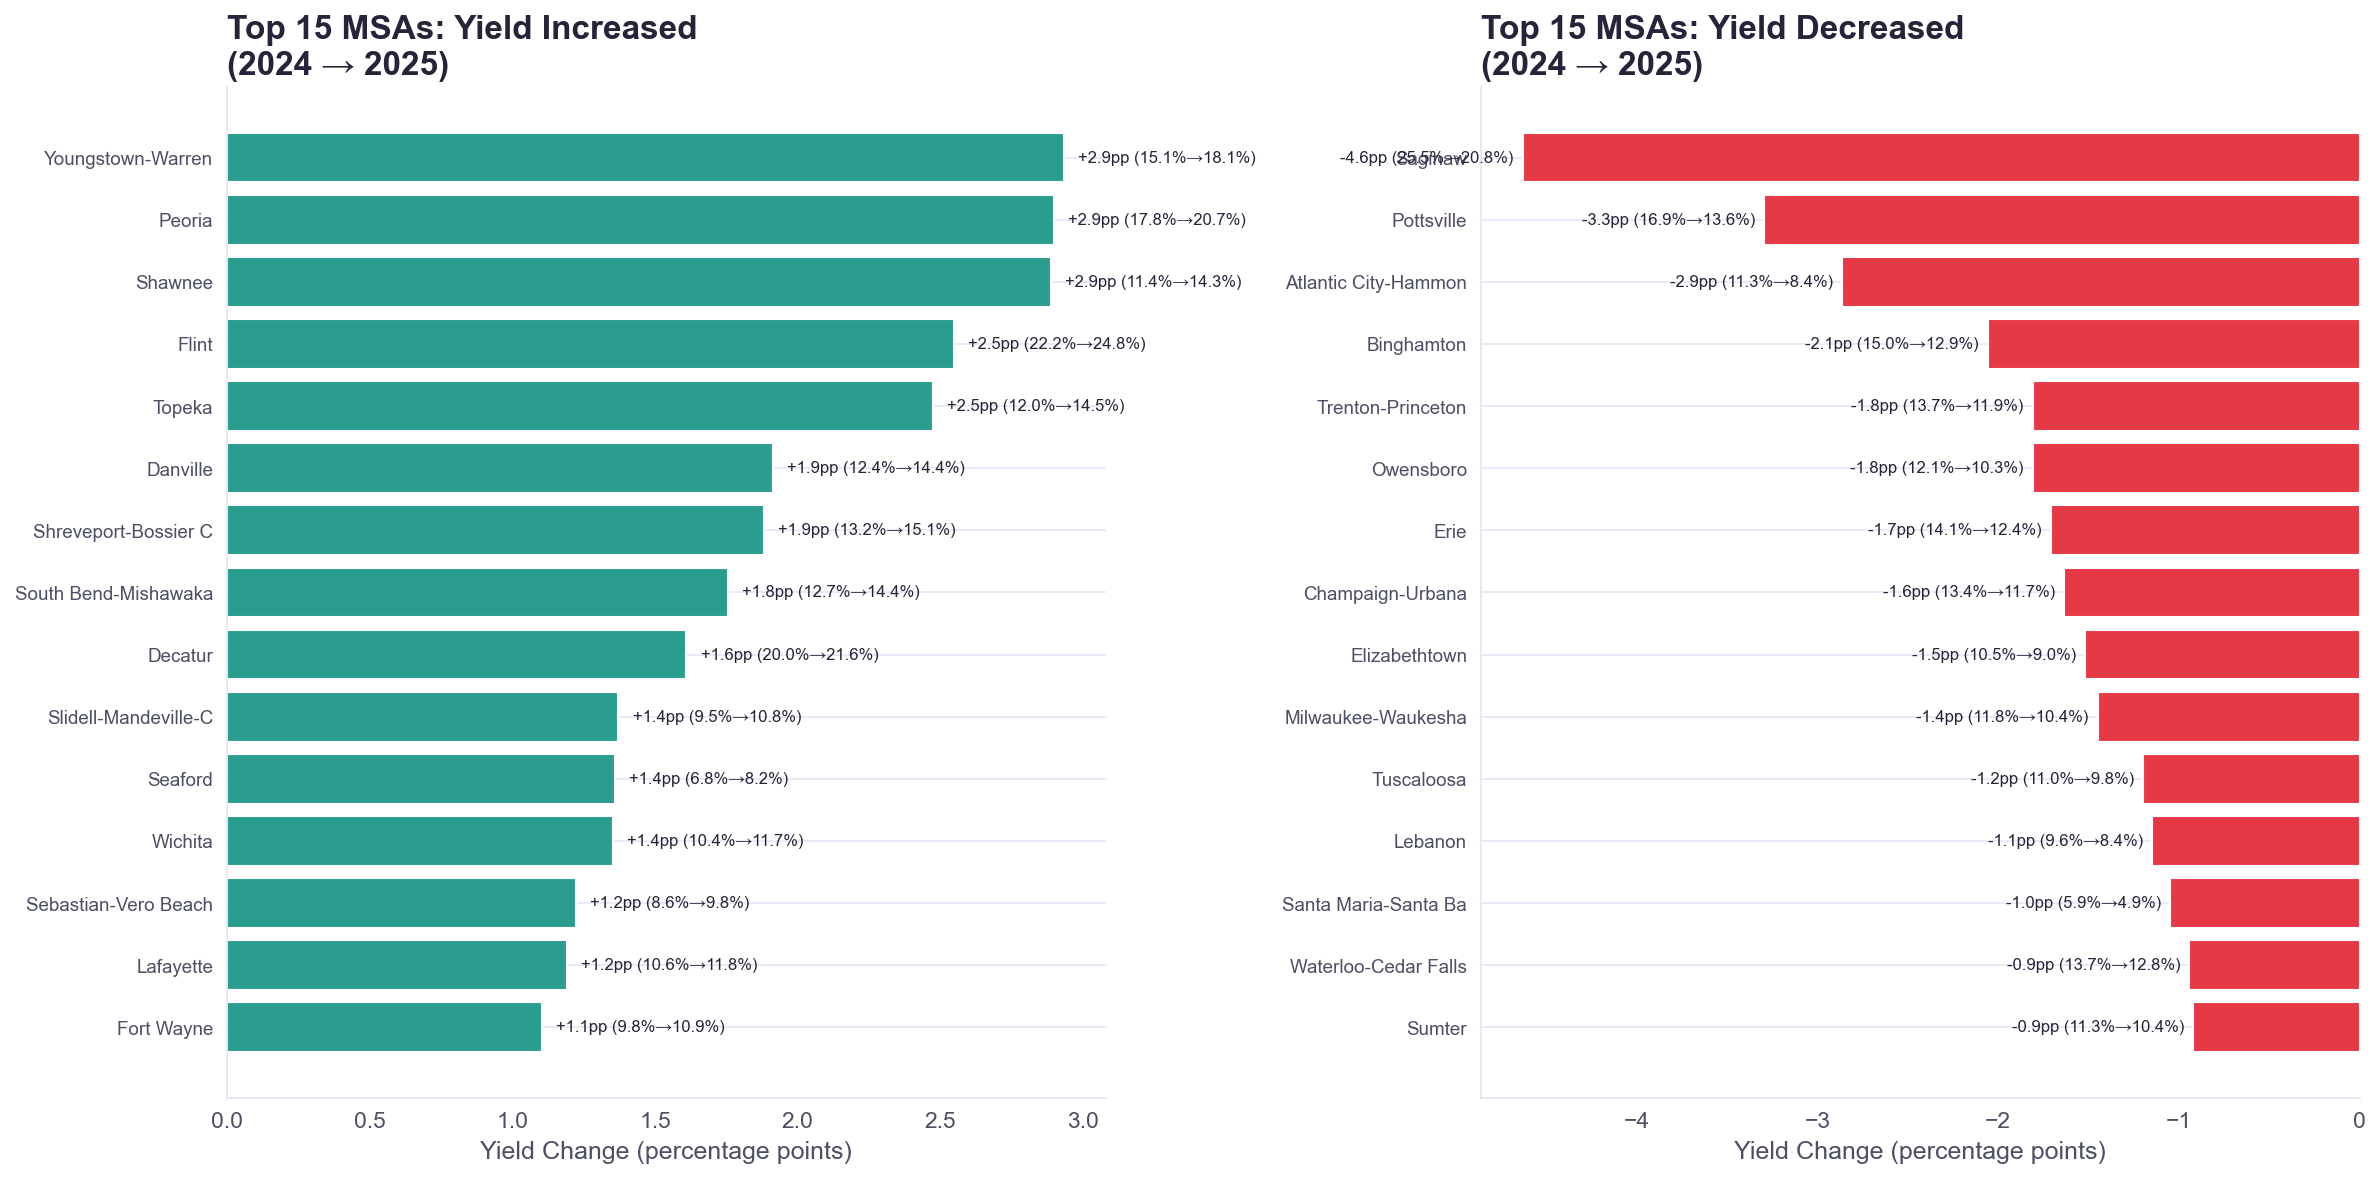
The West Coast dominates low yield markets, with all major metros besides Boulder being on the West Coast.
The Rust Belt dominates high gross yield markets with gross yields being mostly unchanged compared to last year.
When strictly looking at count, you see many core SFR markets represented, but then also just ones with very large populations (LA, Riverside).
Below we go state-by-state and highlight the purchase price vs rent along with the gross yields.
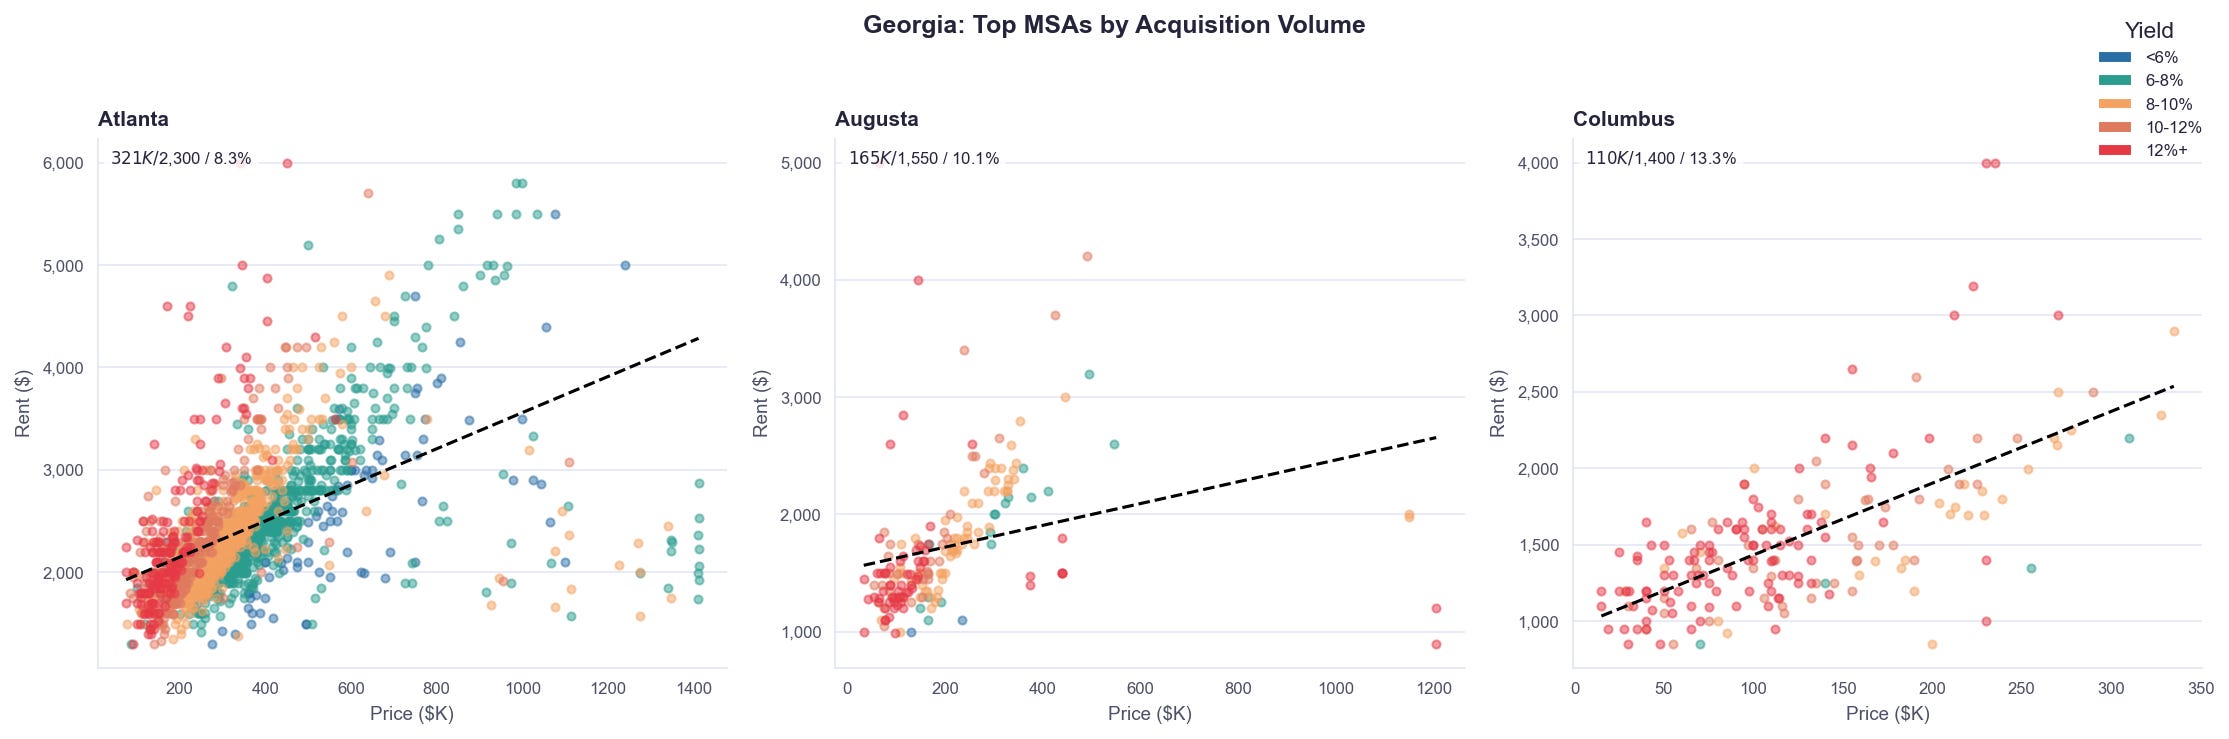
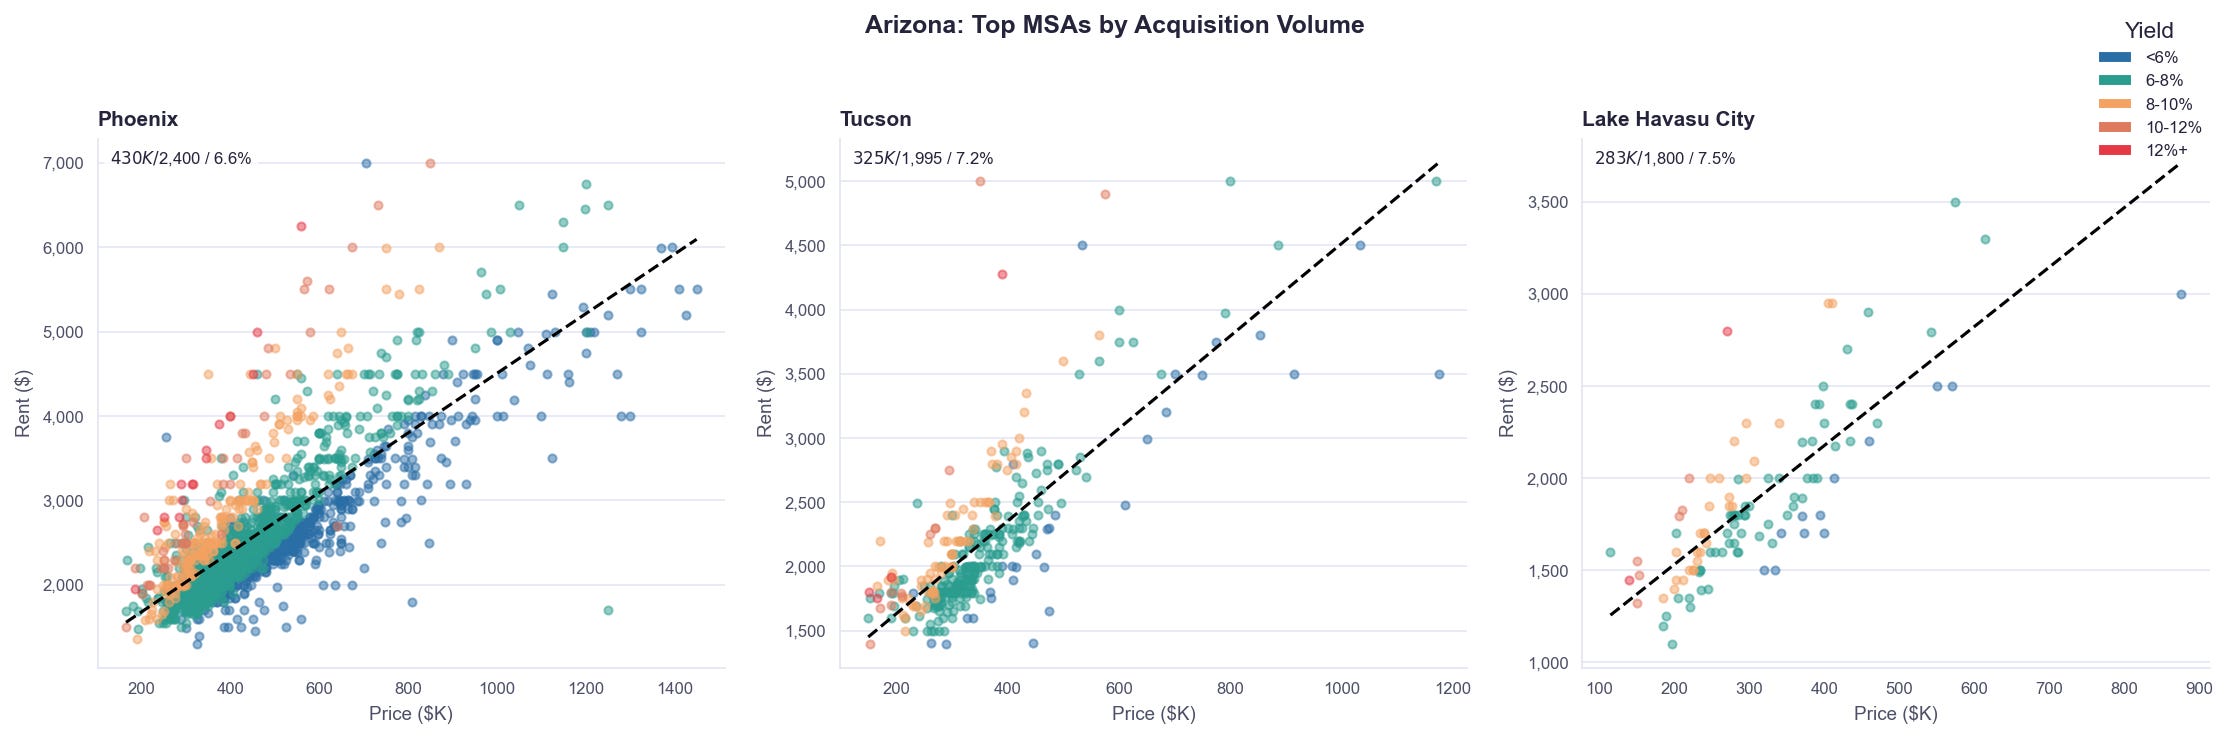
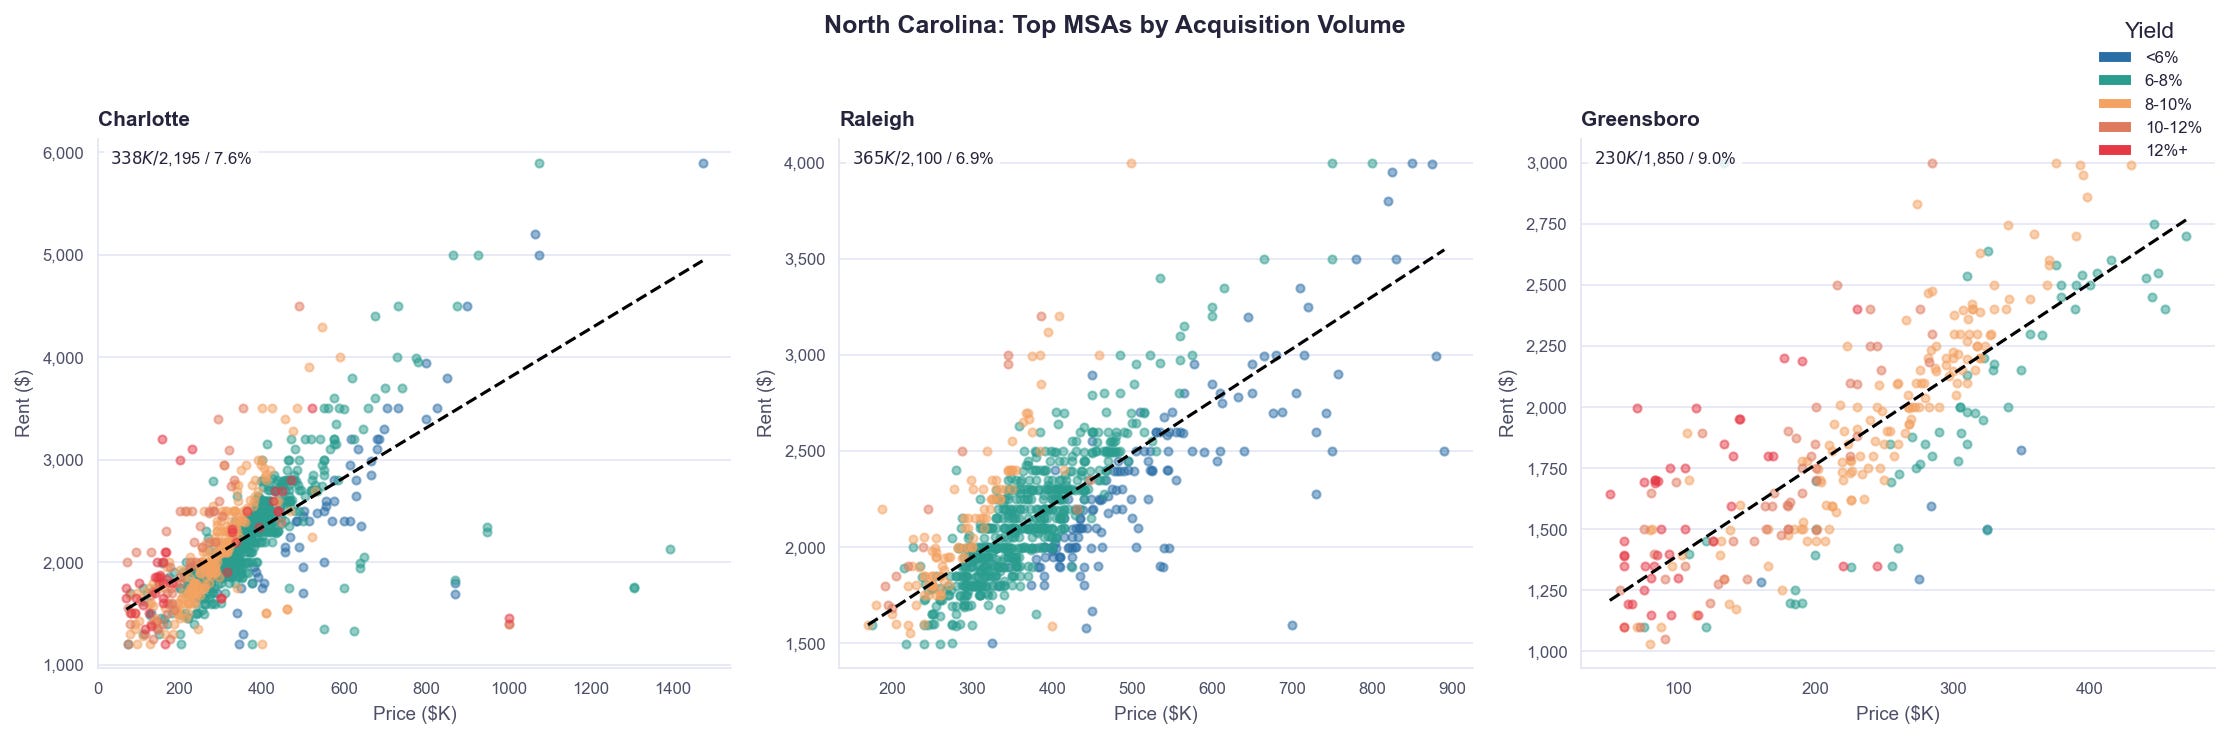
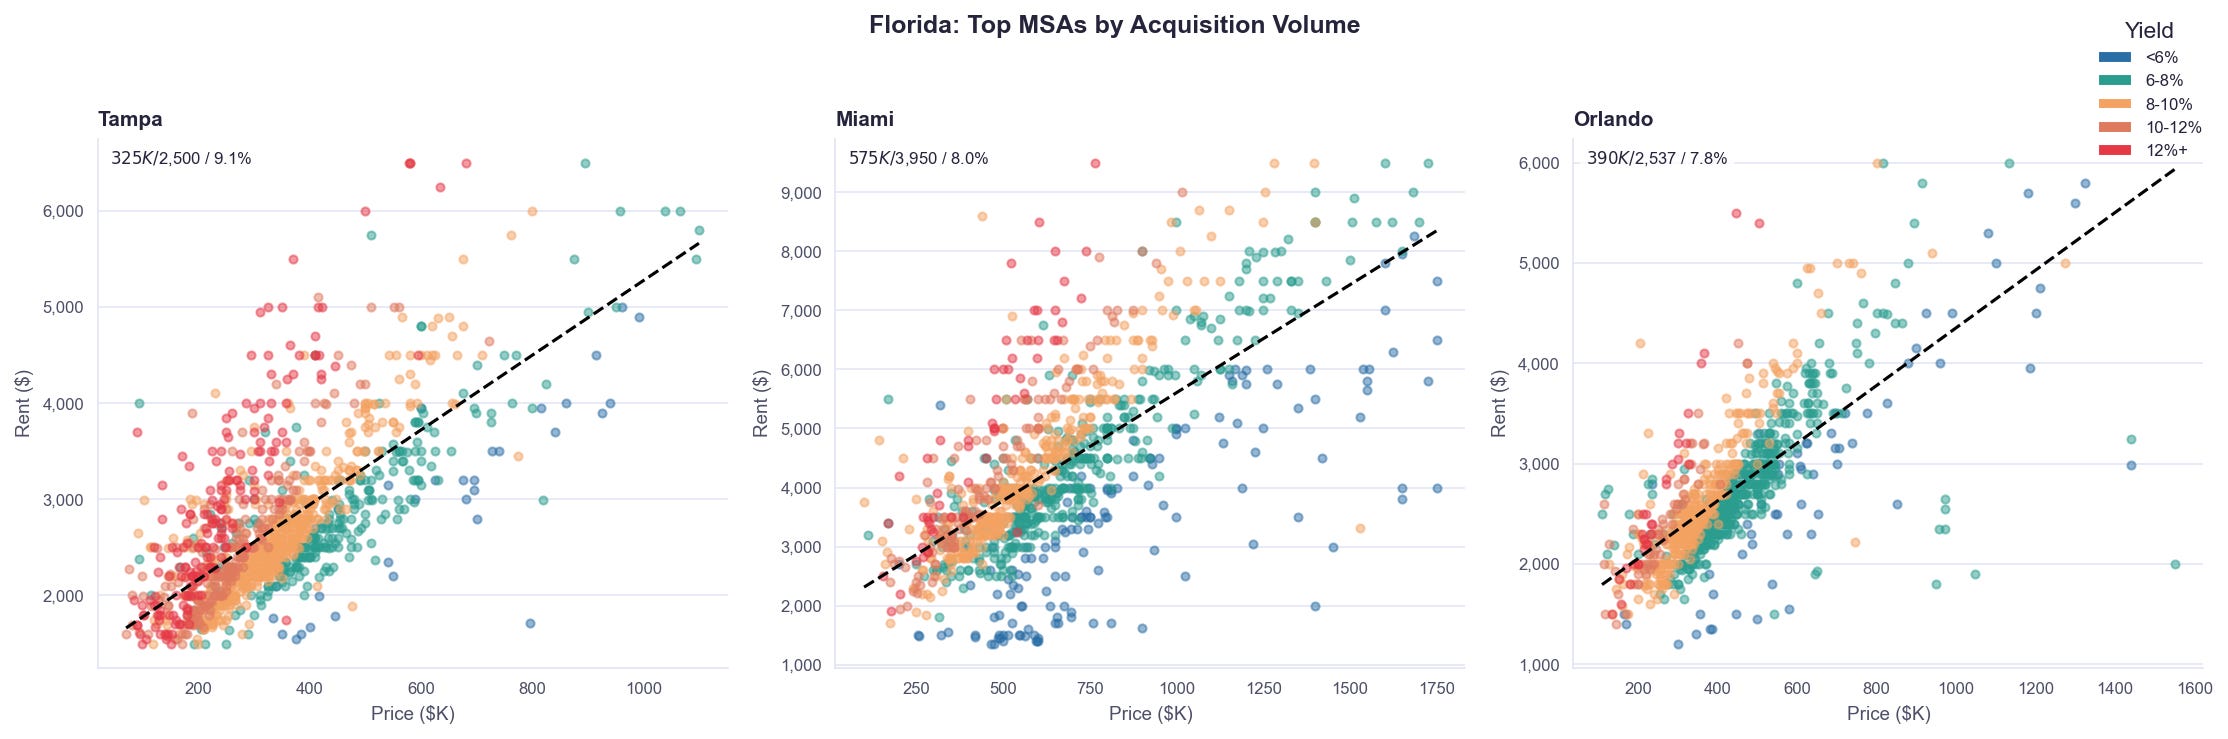
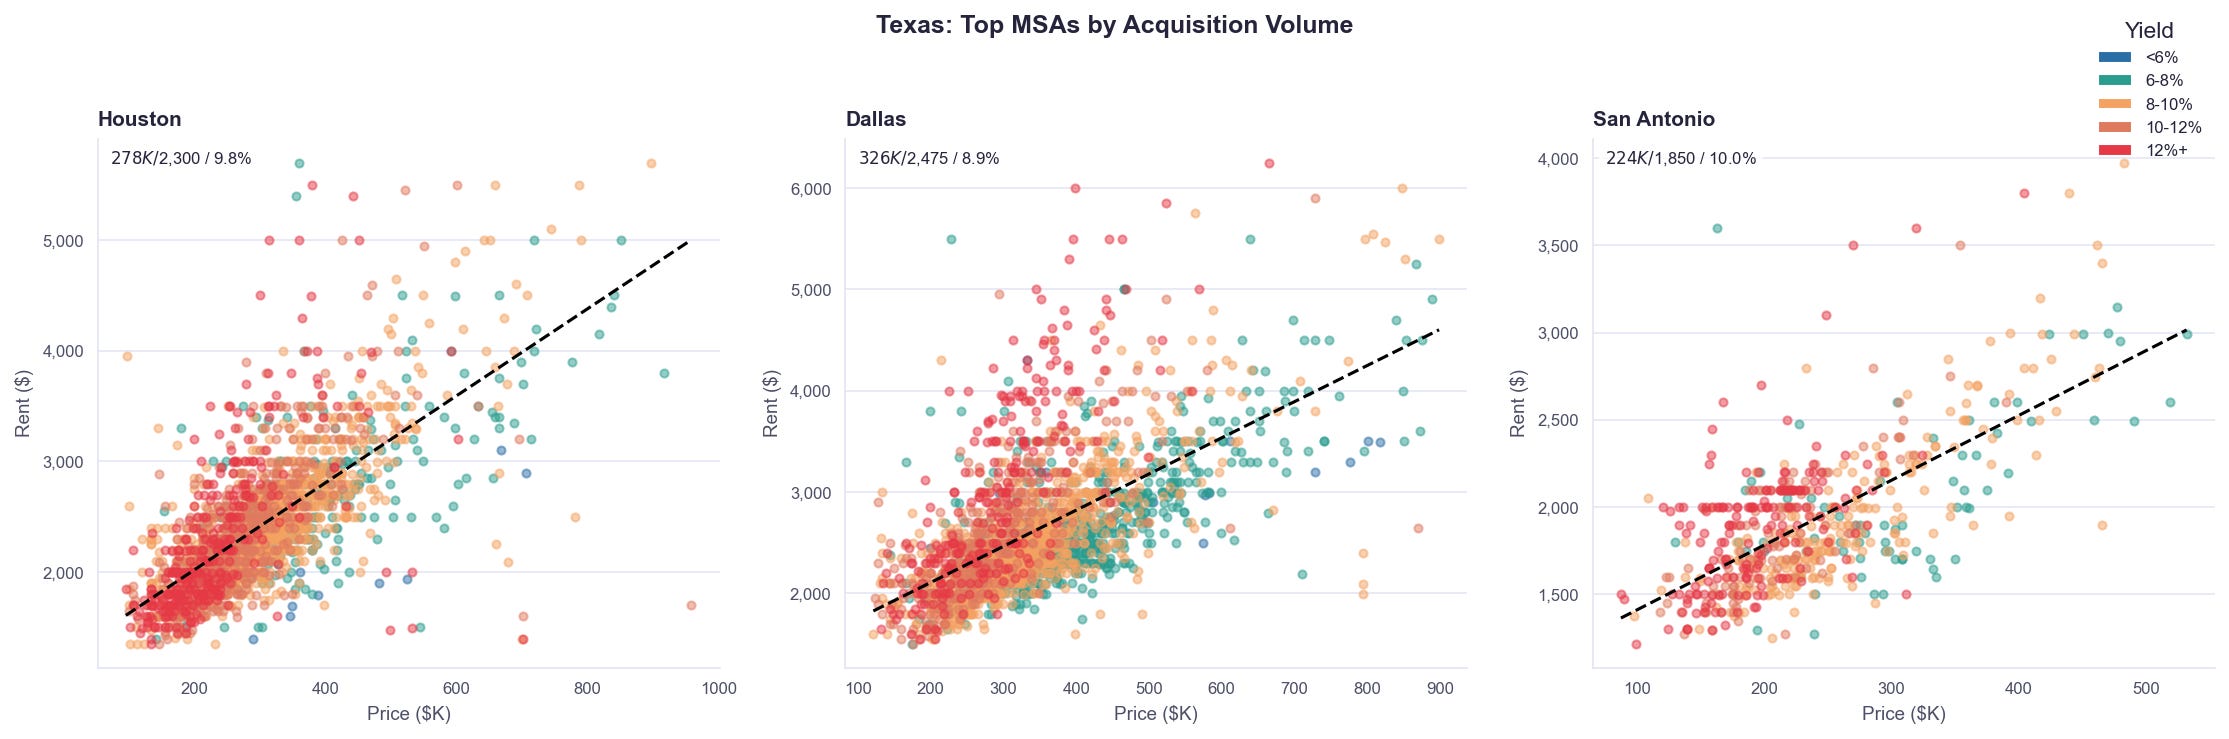
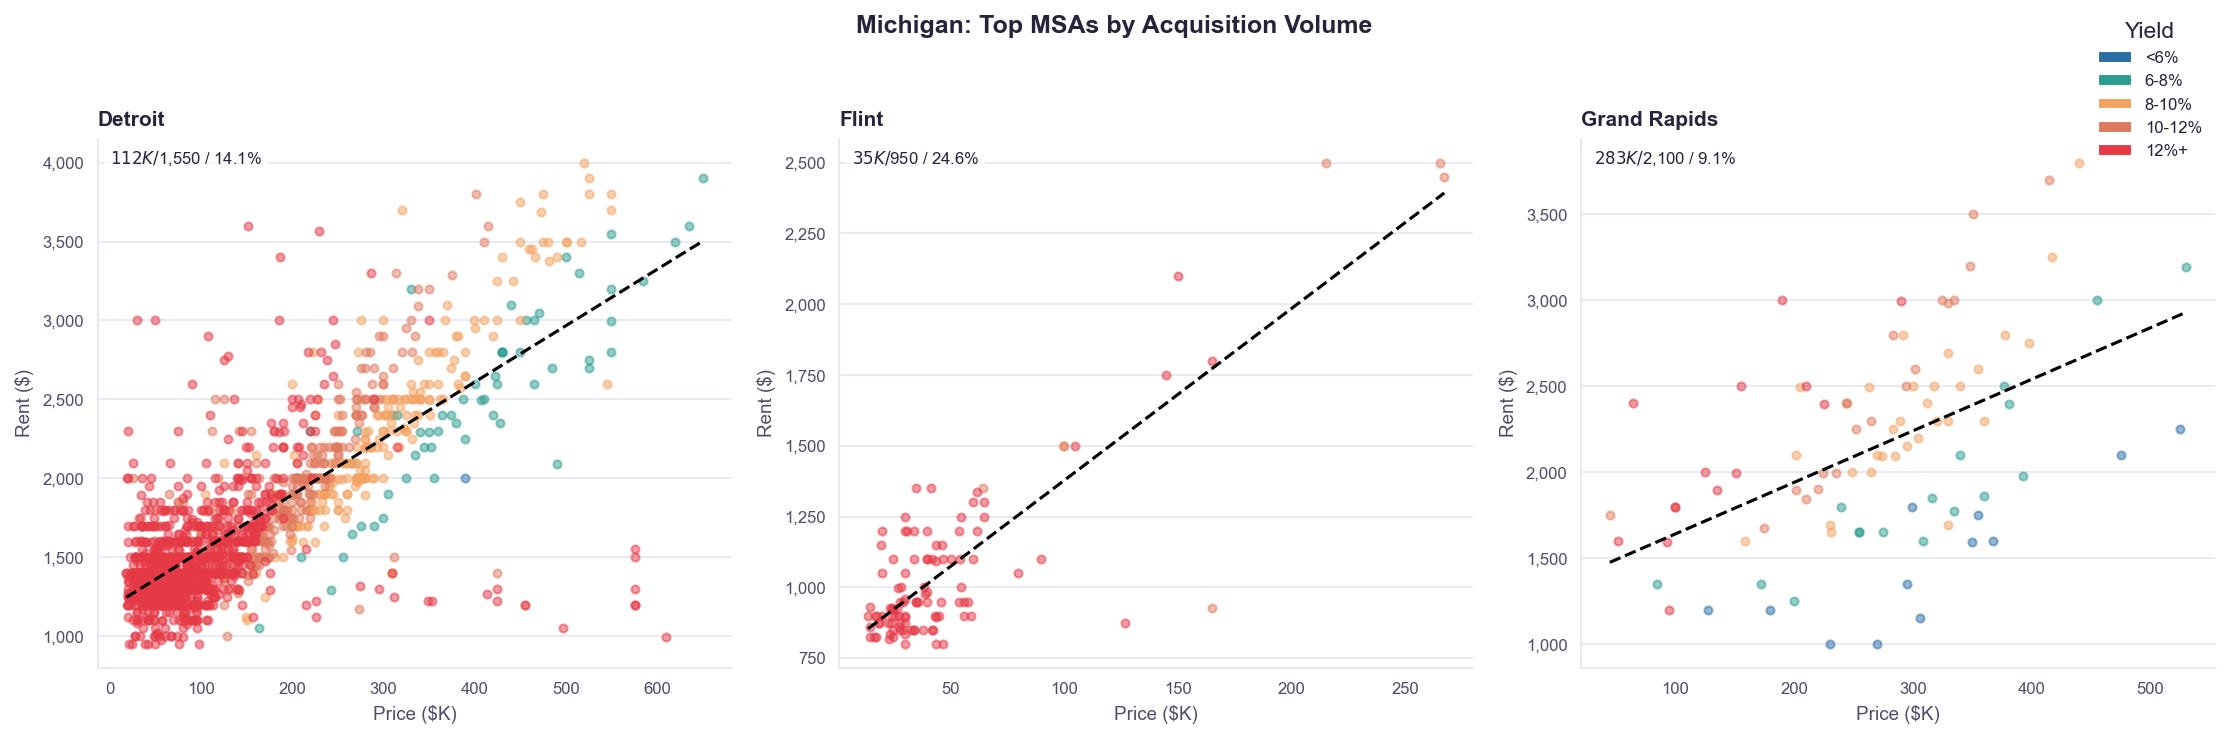
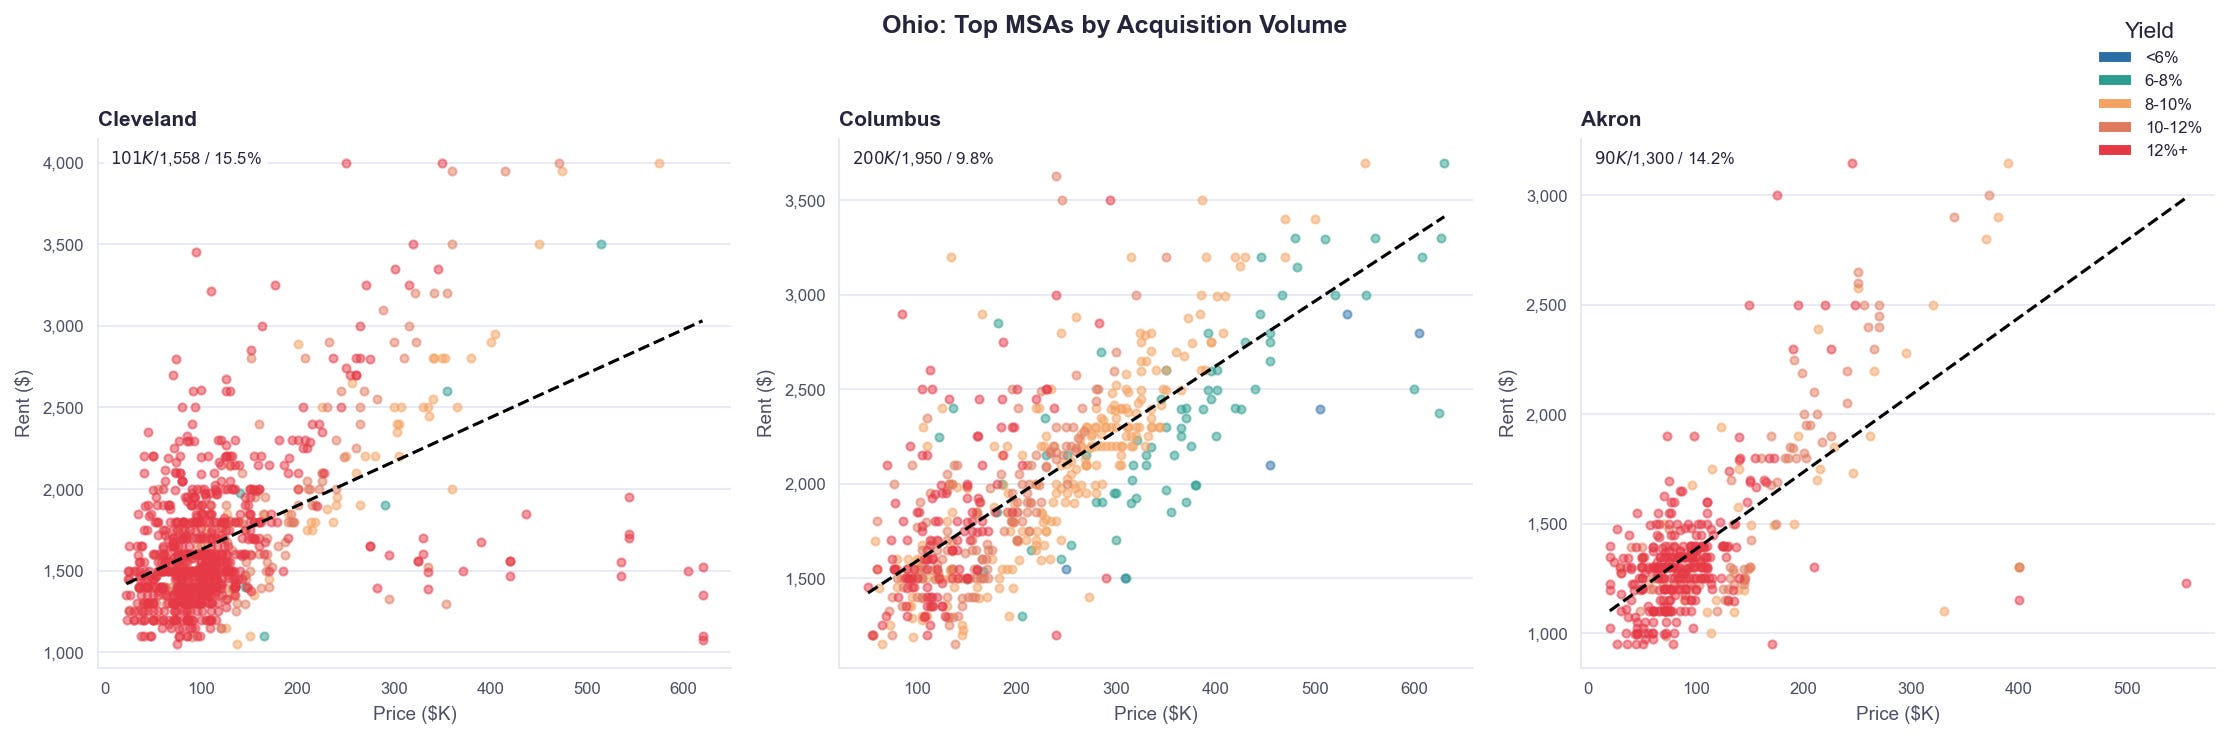
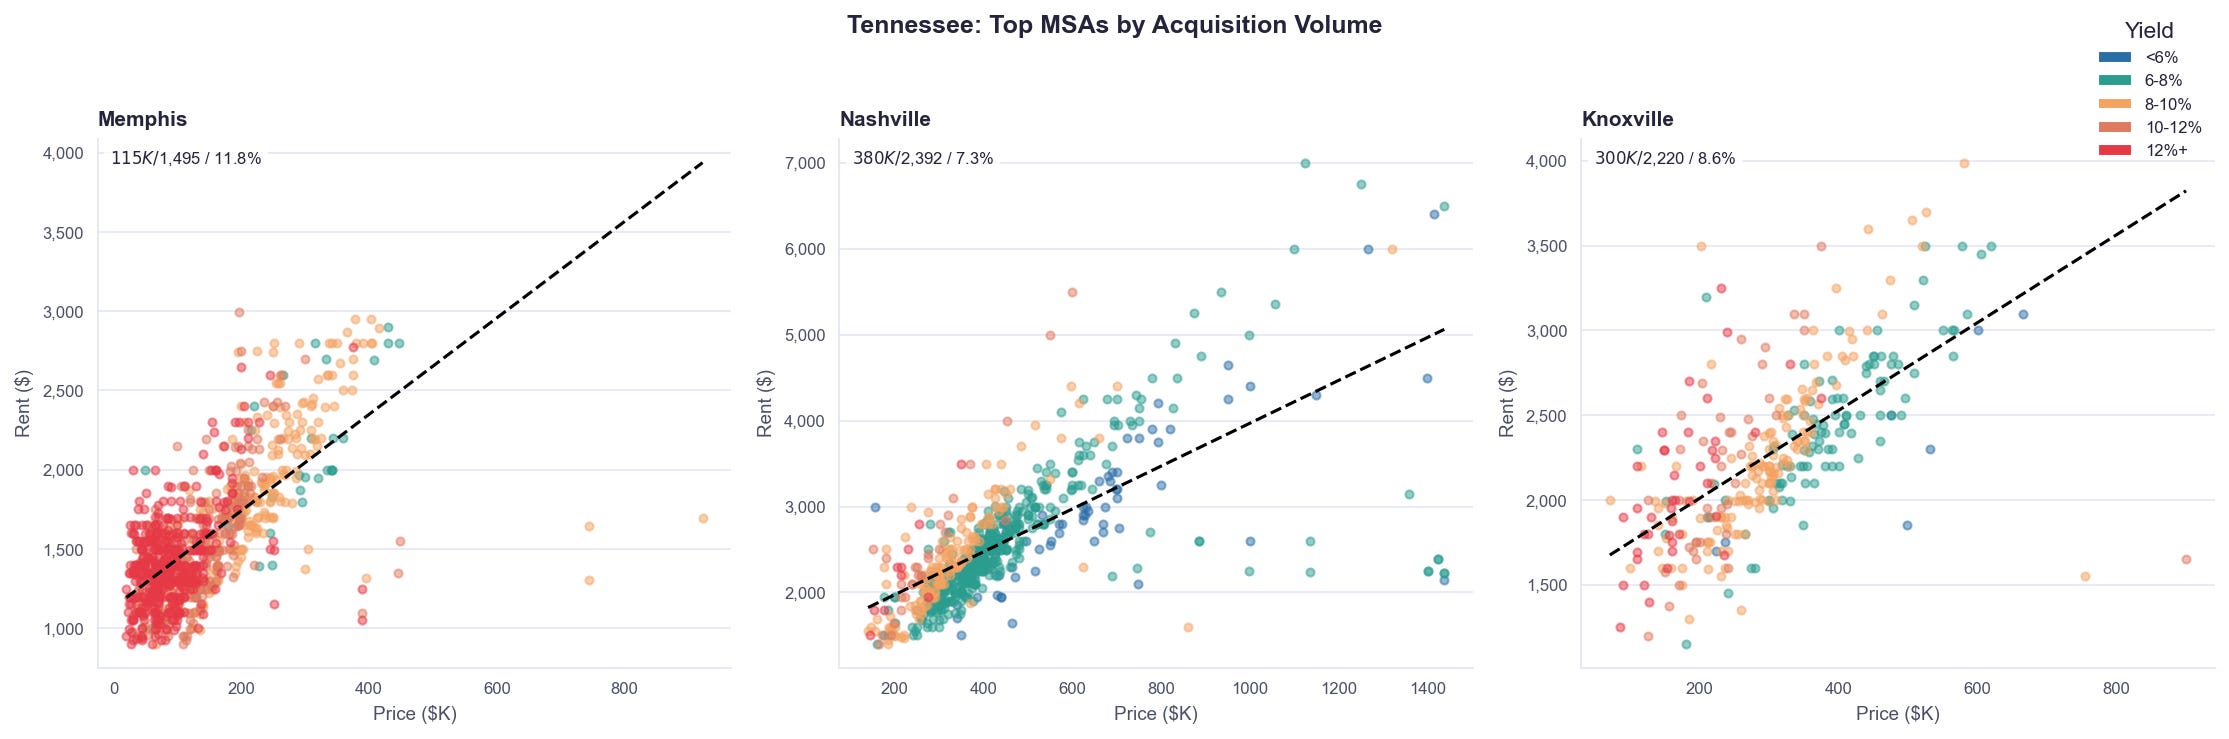
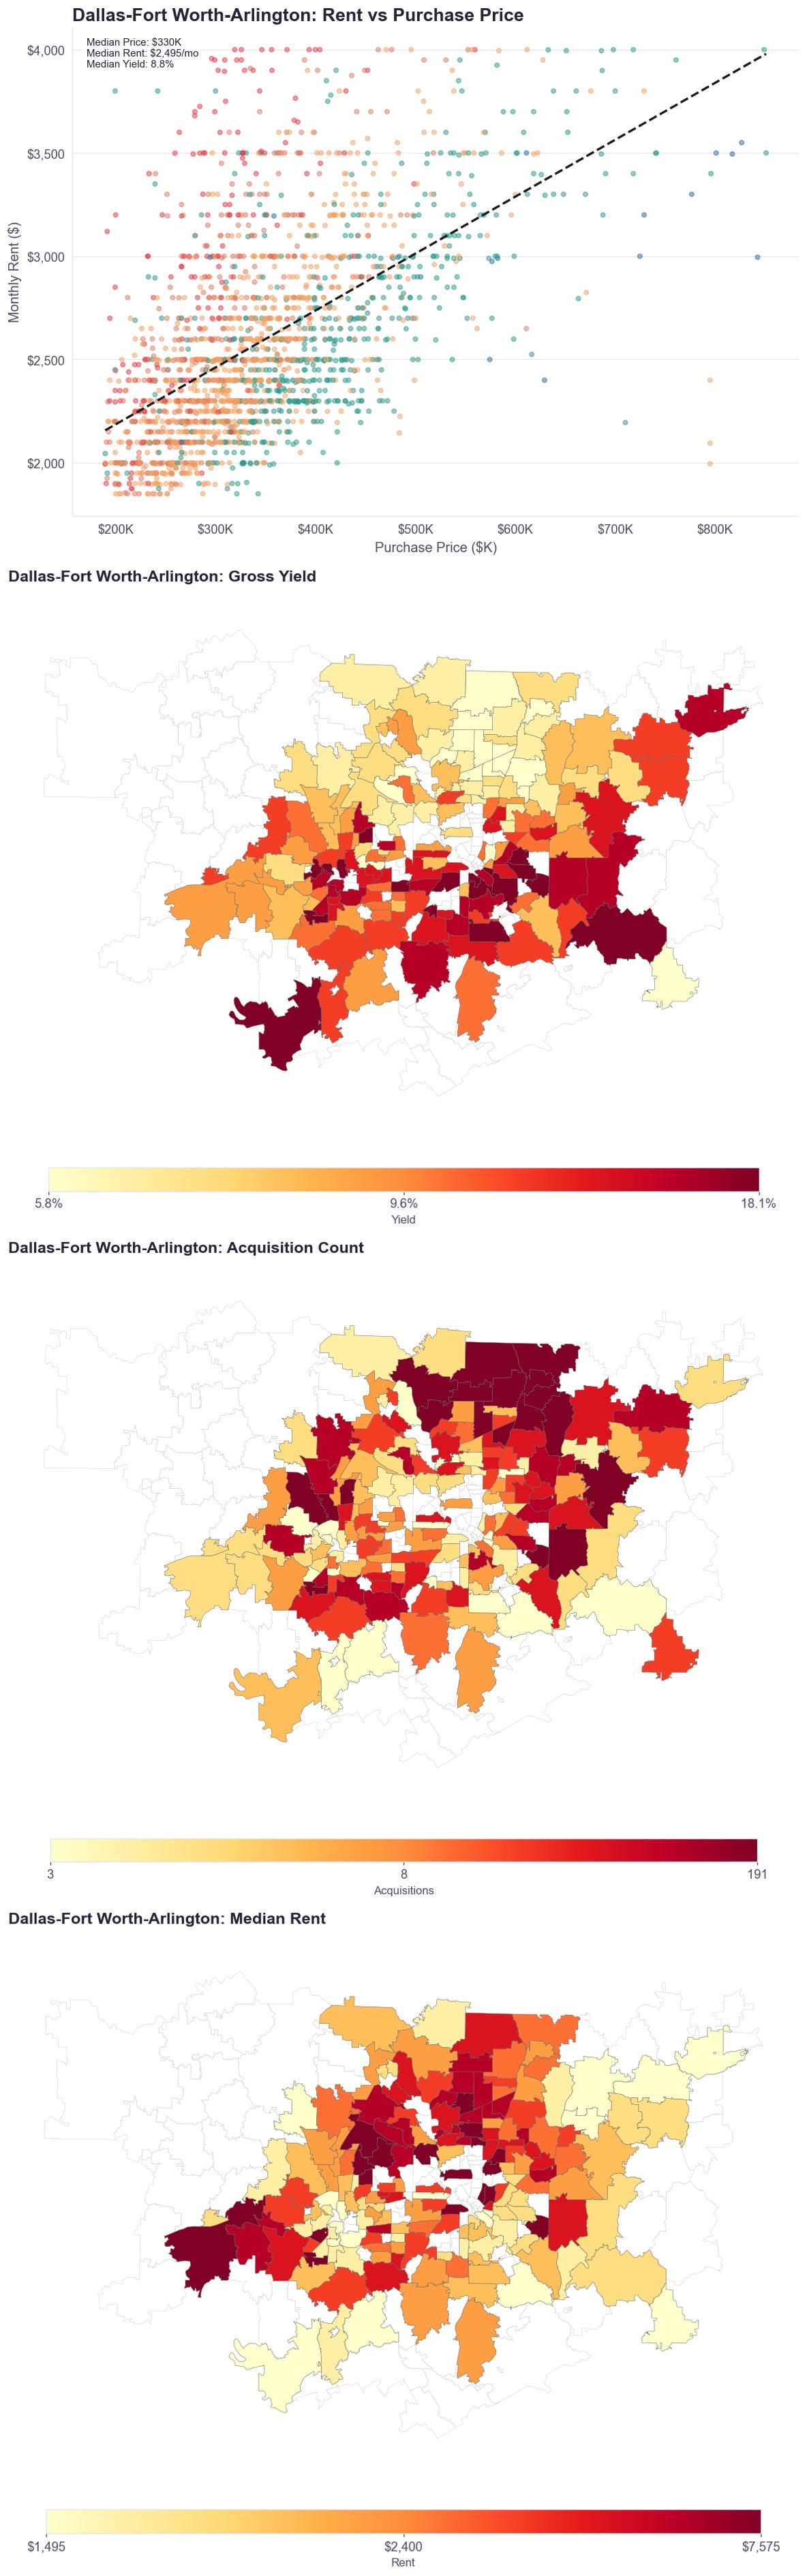
Below we go through the top 100 metro areas and show scatterplots of purchase price vs rent; heatmaps of gross yield, median rents, number of acquisitions, and what the average percentile or rental purchase price is compared to all sales of single family homes in the MSA.
To see the rest of the charts below, become a paid subscriber (we show an example of DFW below):
To see the rest, become a paid subscriber: