

2025 SFR Rent Growth: Workforce Housing Holding Up Strongest
Same Store rent growth trends by MSA, price band, and more
We analyzed same store rent growth for >300,000 single family rentals that have been listed for rent in 2025.
To calculate, we look at single family rentals that were rented out in both 2024 and 2025 and see how their rents have changed. This gives an interesting view because it shows the performance of the same assets over time.
Nationwide, the median same store rent growth was 2.1%.
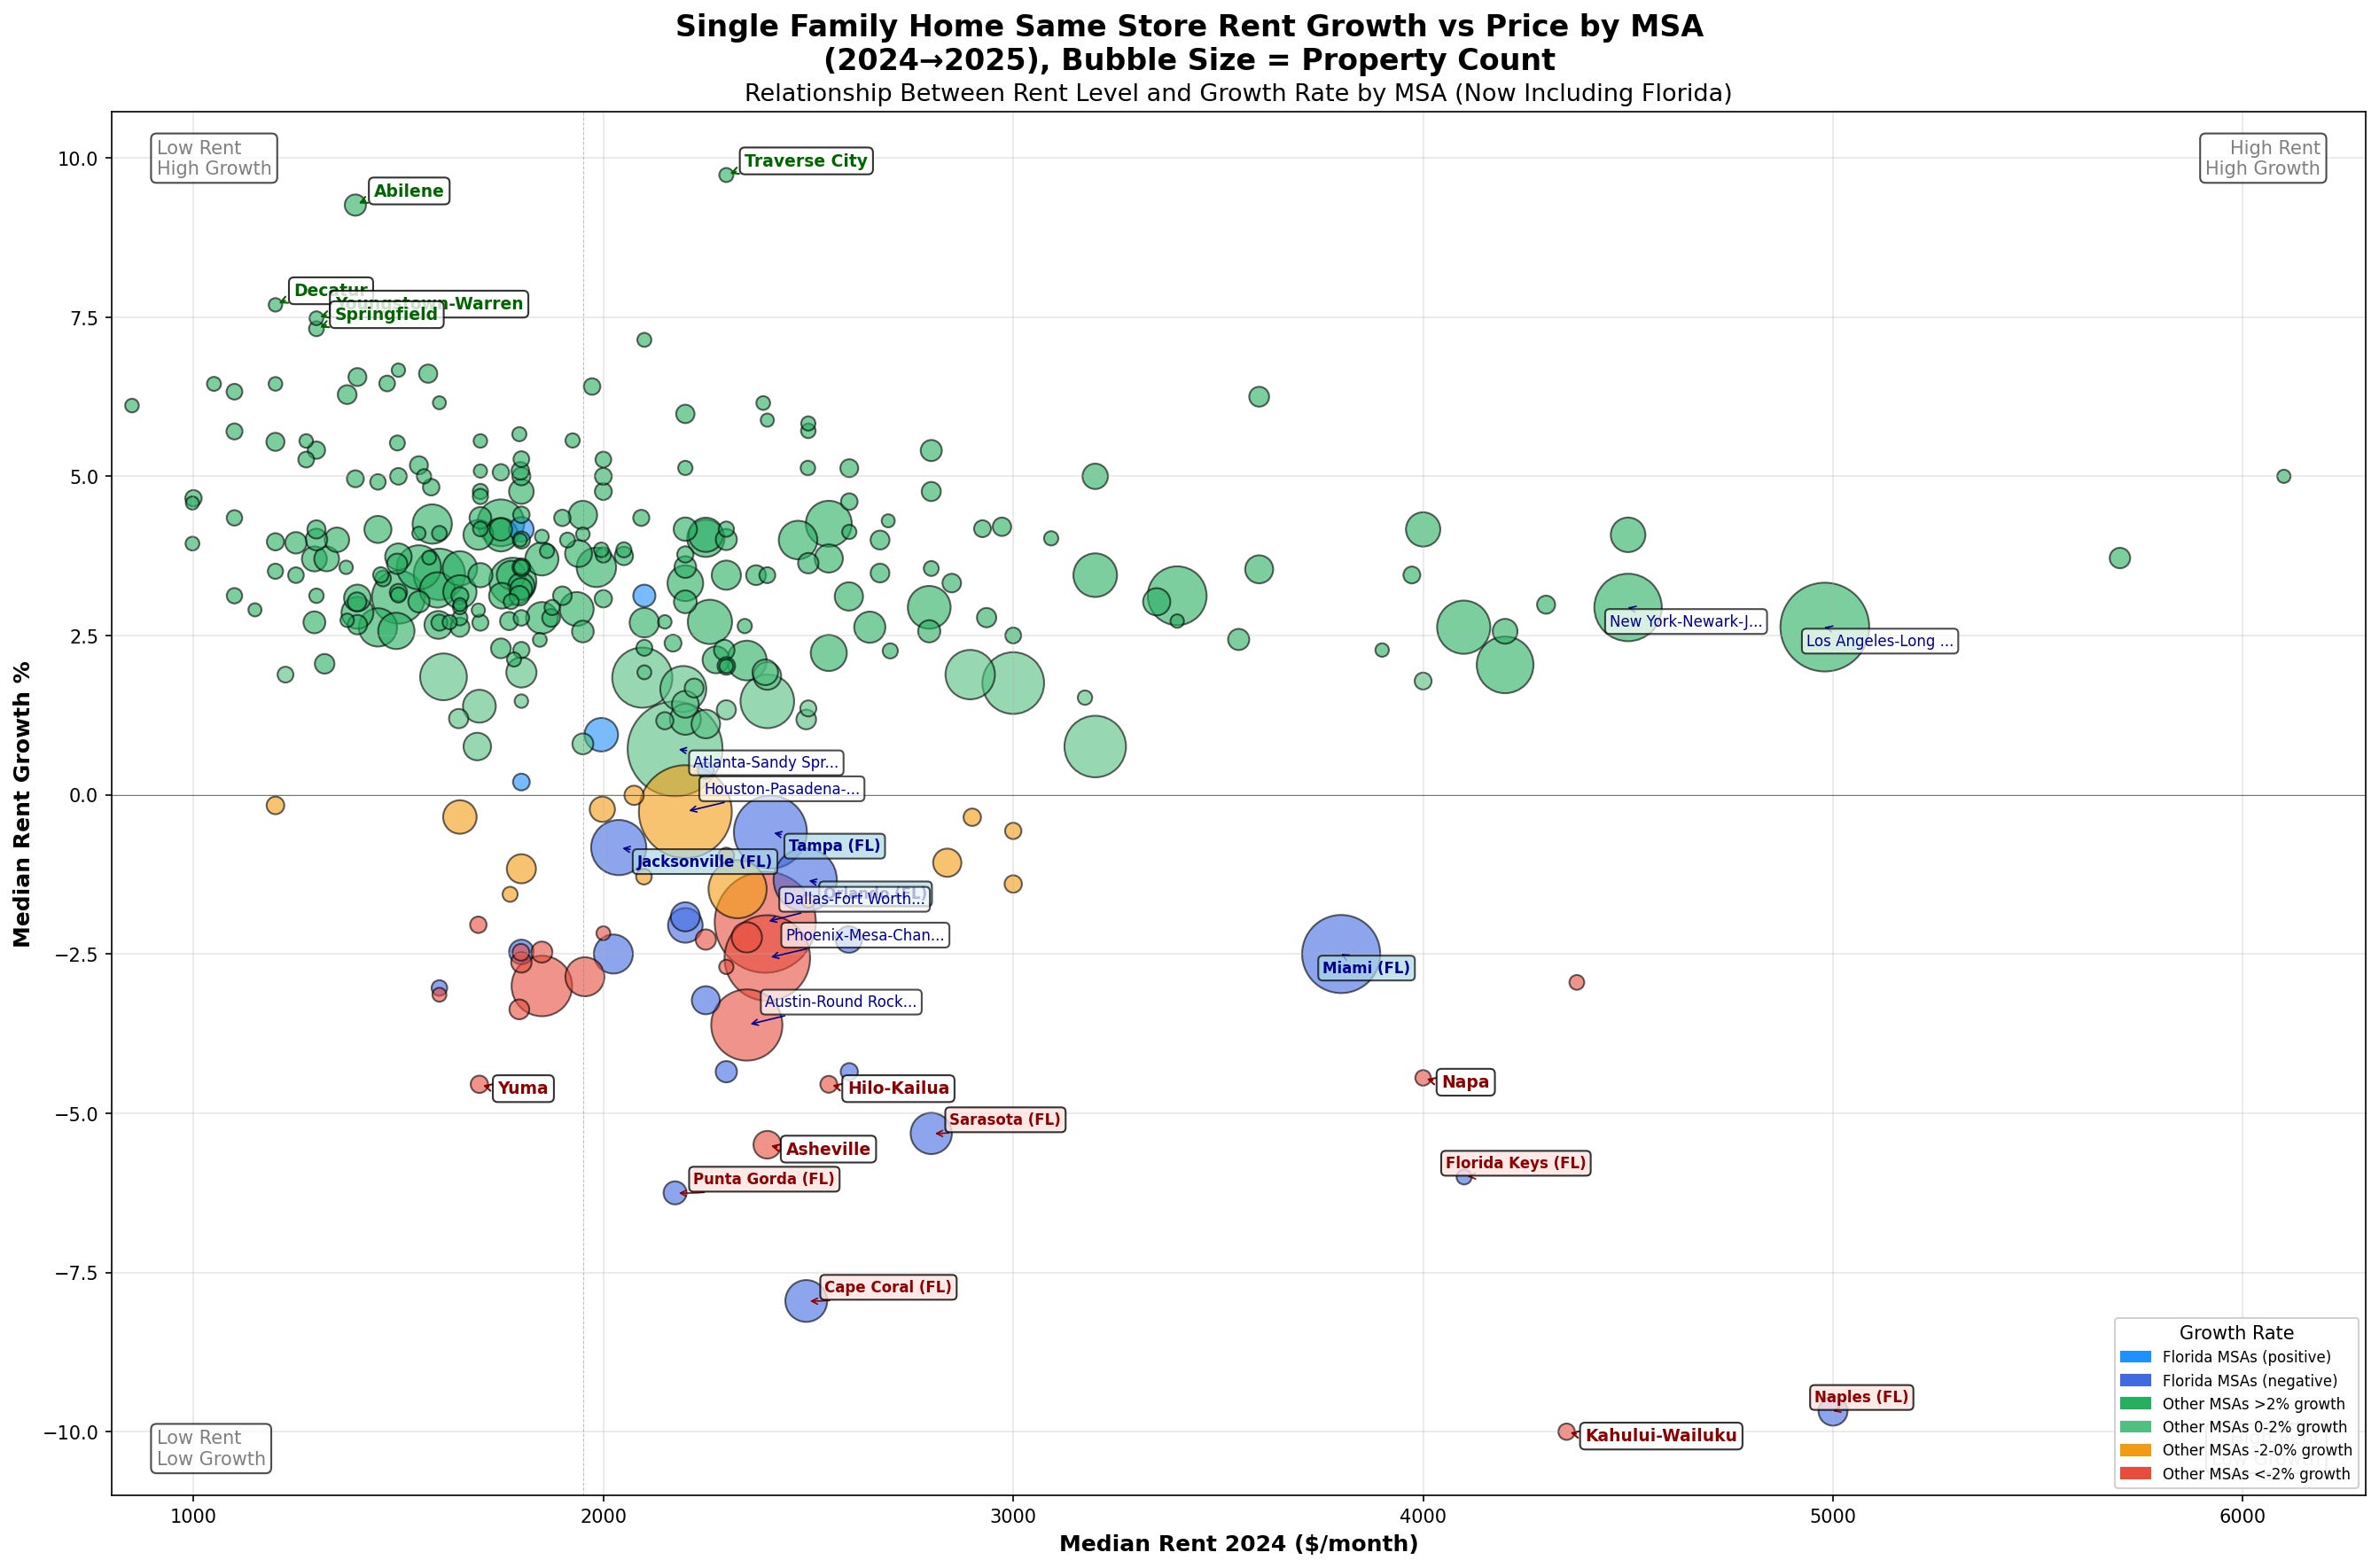
There’s a tight band of markets that hover around the 2-3% mark, with a clustering of larger markets falling below that between -3% and 2%.
The top performing markets are strong midwest markets like Kansas City, Pittsburgh, Minneapolis, and large Ohio markets. Besides those, strong job markets like San Jose (Silicon Valley) and Boston make up the top performers.
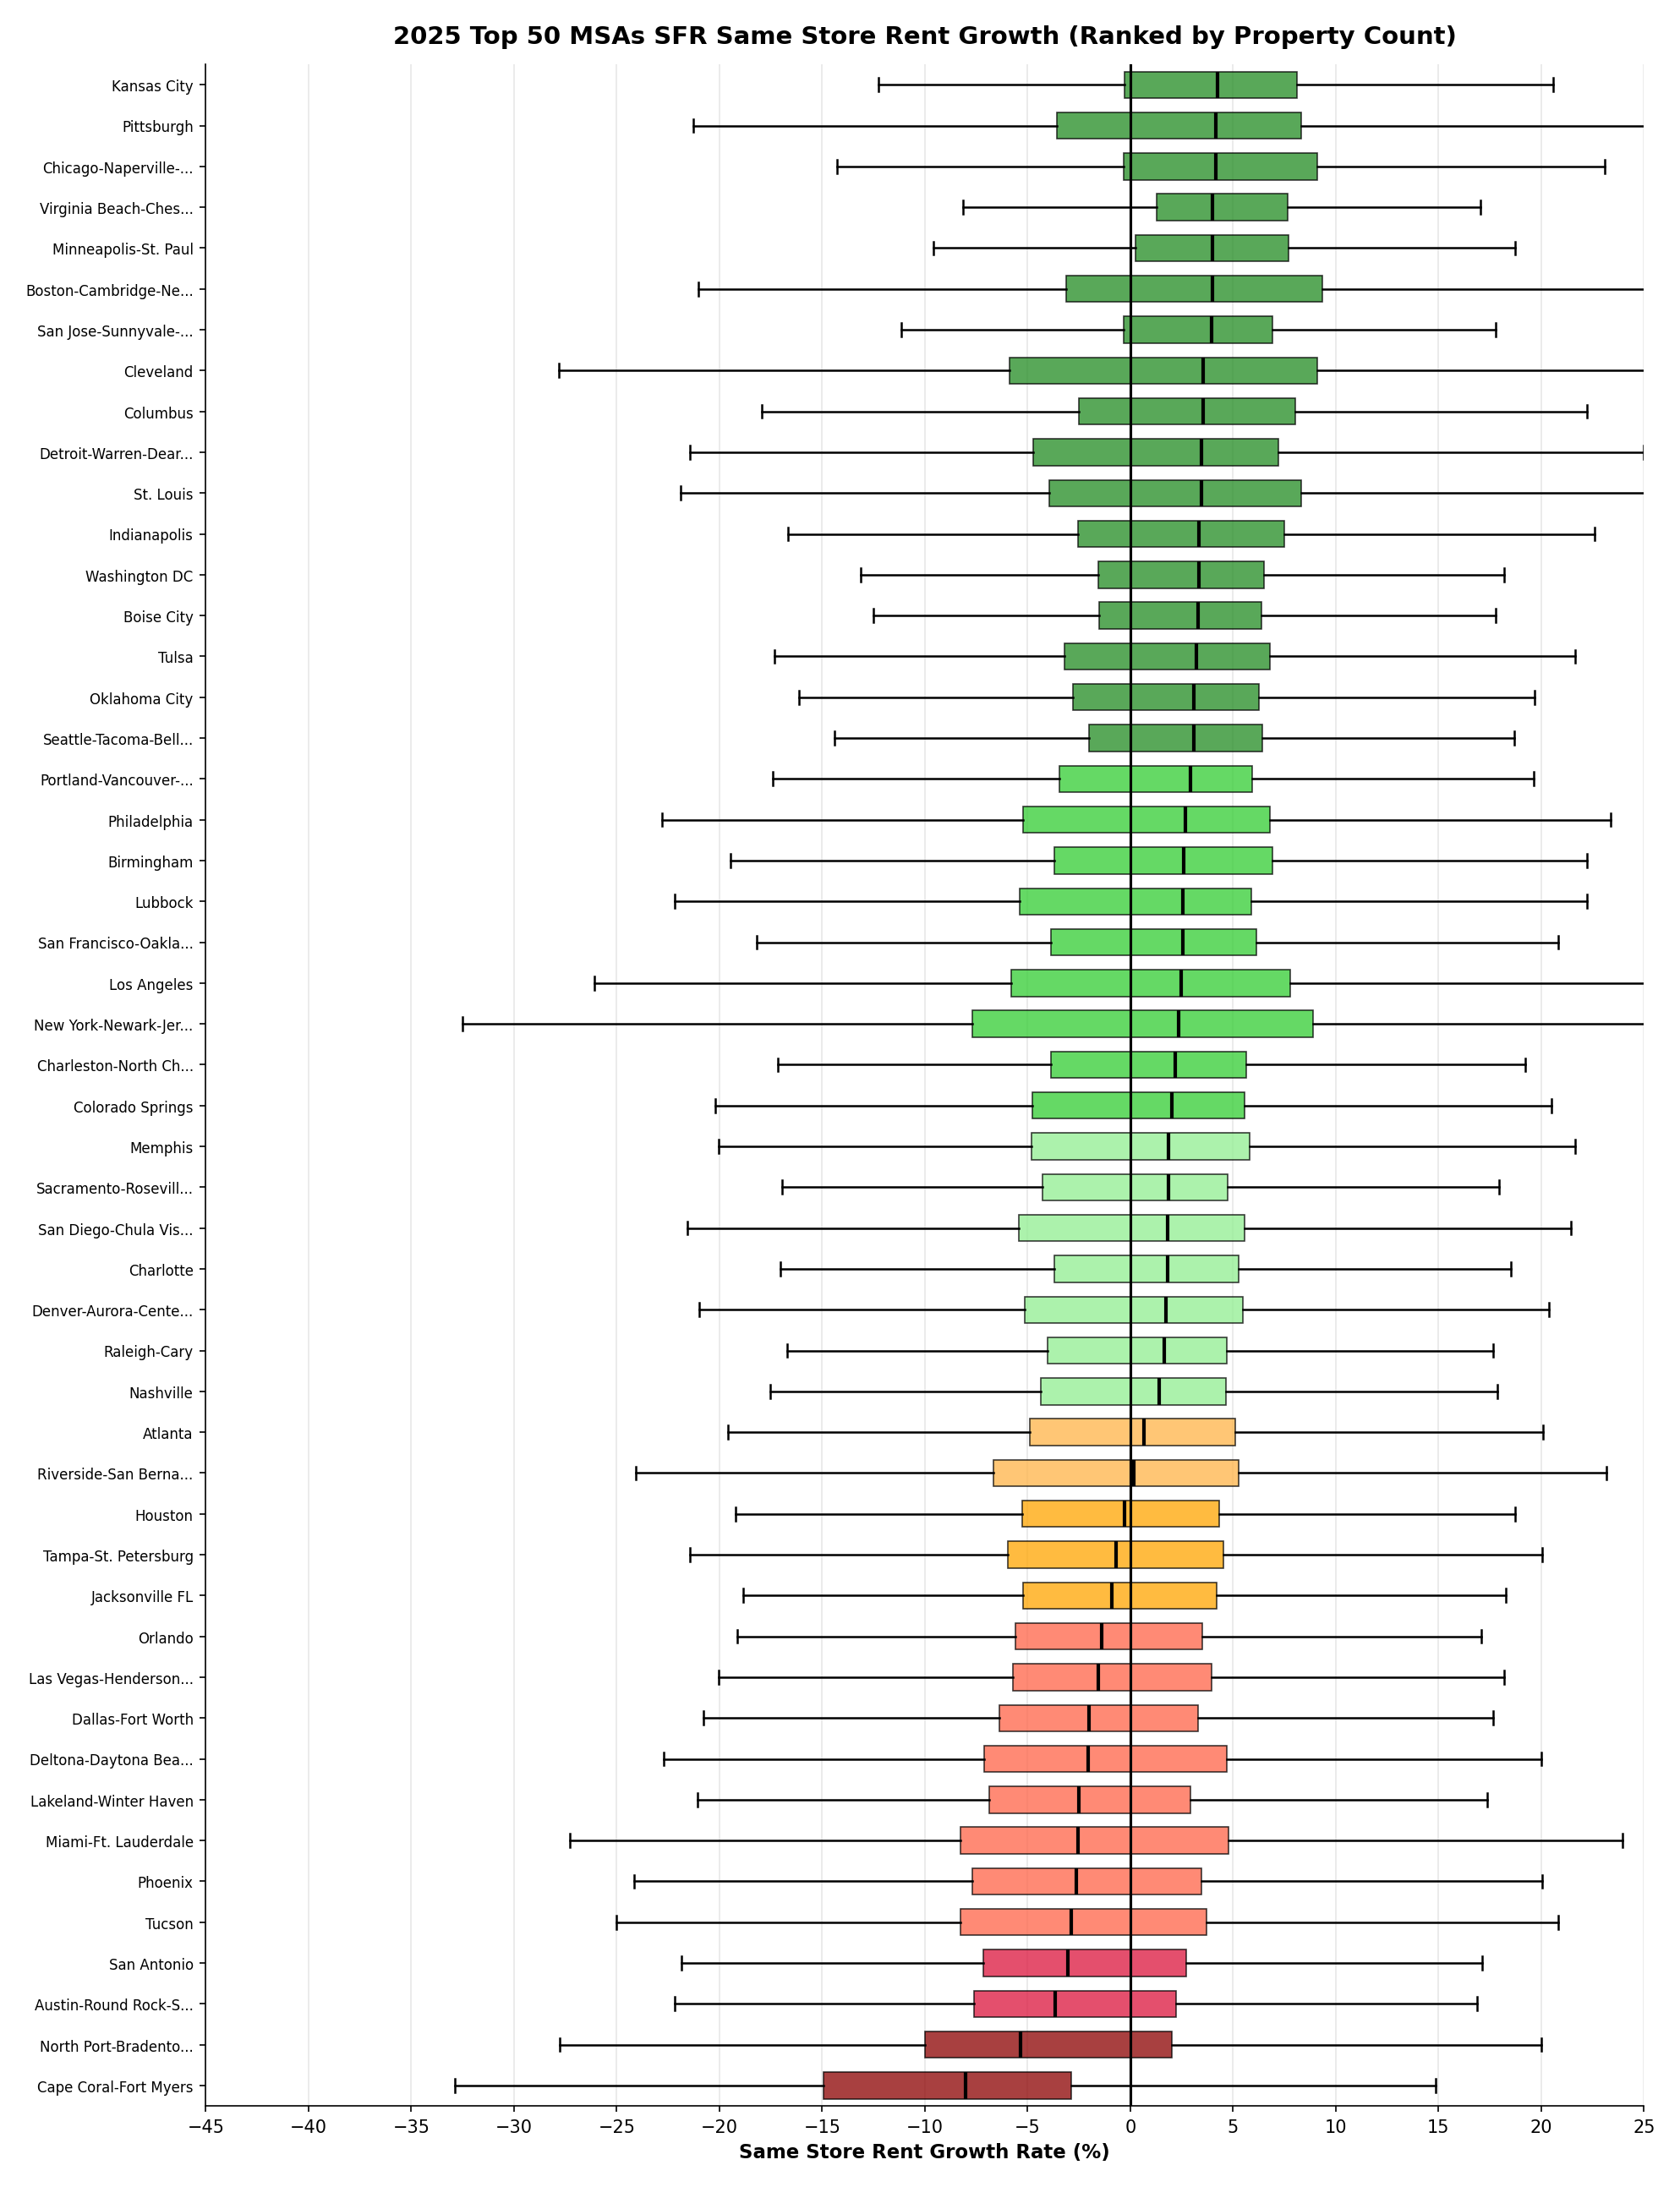
For lower performers, Florida dominates with 5 of the top 10 worst performing markets (in the top 50 MSAs). Arizona metros, Austin, Vegas, and DFW pack the rest out. The clear theme here are markets where there’s heavy supply increases and were very hot markets in 2020-2022 that experience massive rent growth.
For smaller metros, heavy STR rental markets were among the worst offenders. Napa, Heber UT, and Kahului (Maui) had the largest rent declines for non-Florida markets. This is likely due to a supply shock of underperforming STR being converted into long term rentals and dragging prices down.
However, looking at rent growth at an MSA level doesn’t tell the full story — rent growth has been highly variable within a market dependent on price band.
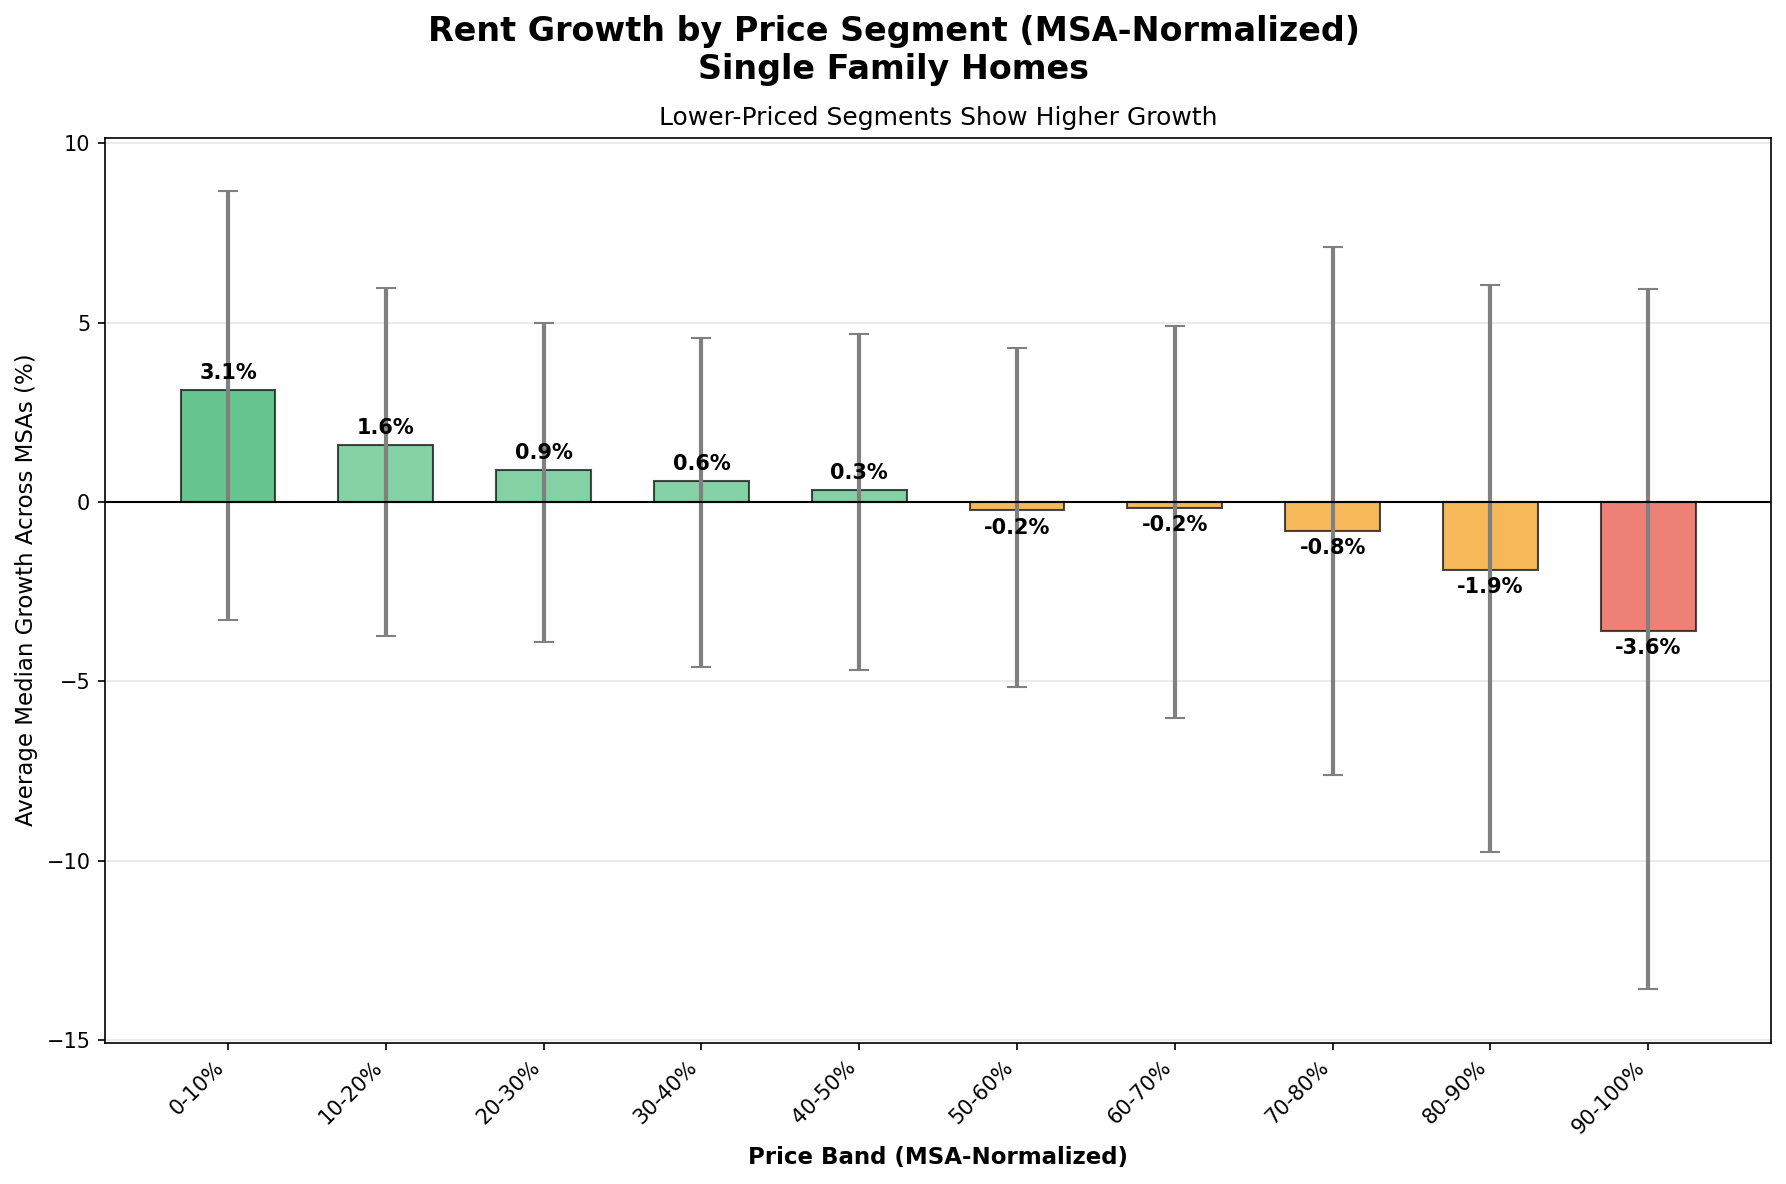
When looking at decile rental price bands (normalized at a metro level) - you notice that workforce housing is strongly outperforming rentals at the top of the market. Nationwide, the bottom 50% priced rentals have had positive same store rent growth while the top 50% priced rentals face negative same store rent growth.
When breaking this down to a specific metro level, many interesting trends pop out. For the largest MSAs, only Los Angeles saw a relative increase in same store rent growth for the highest price rental homes vs less expensive homes. This may be due to displacement from the LA fires that caused a large demand shock at the high end of the market (the areas affected were predominately multi million dollar homes).
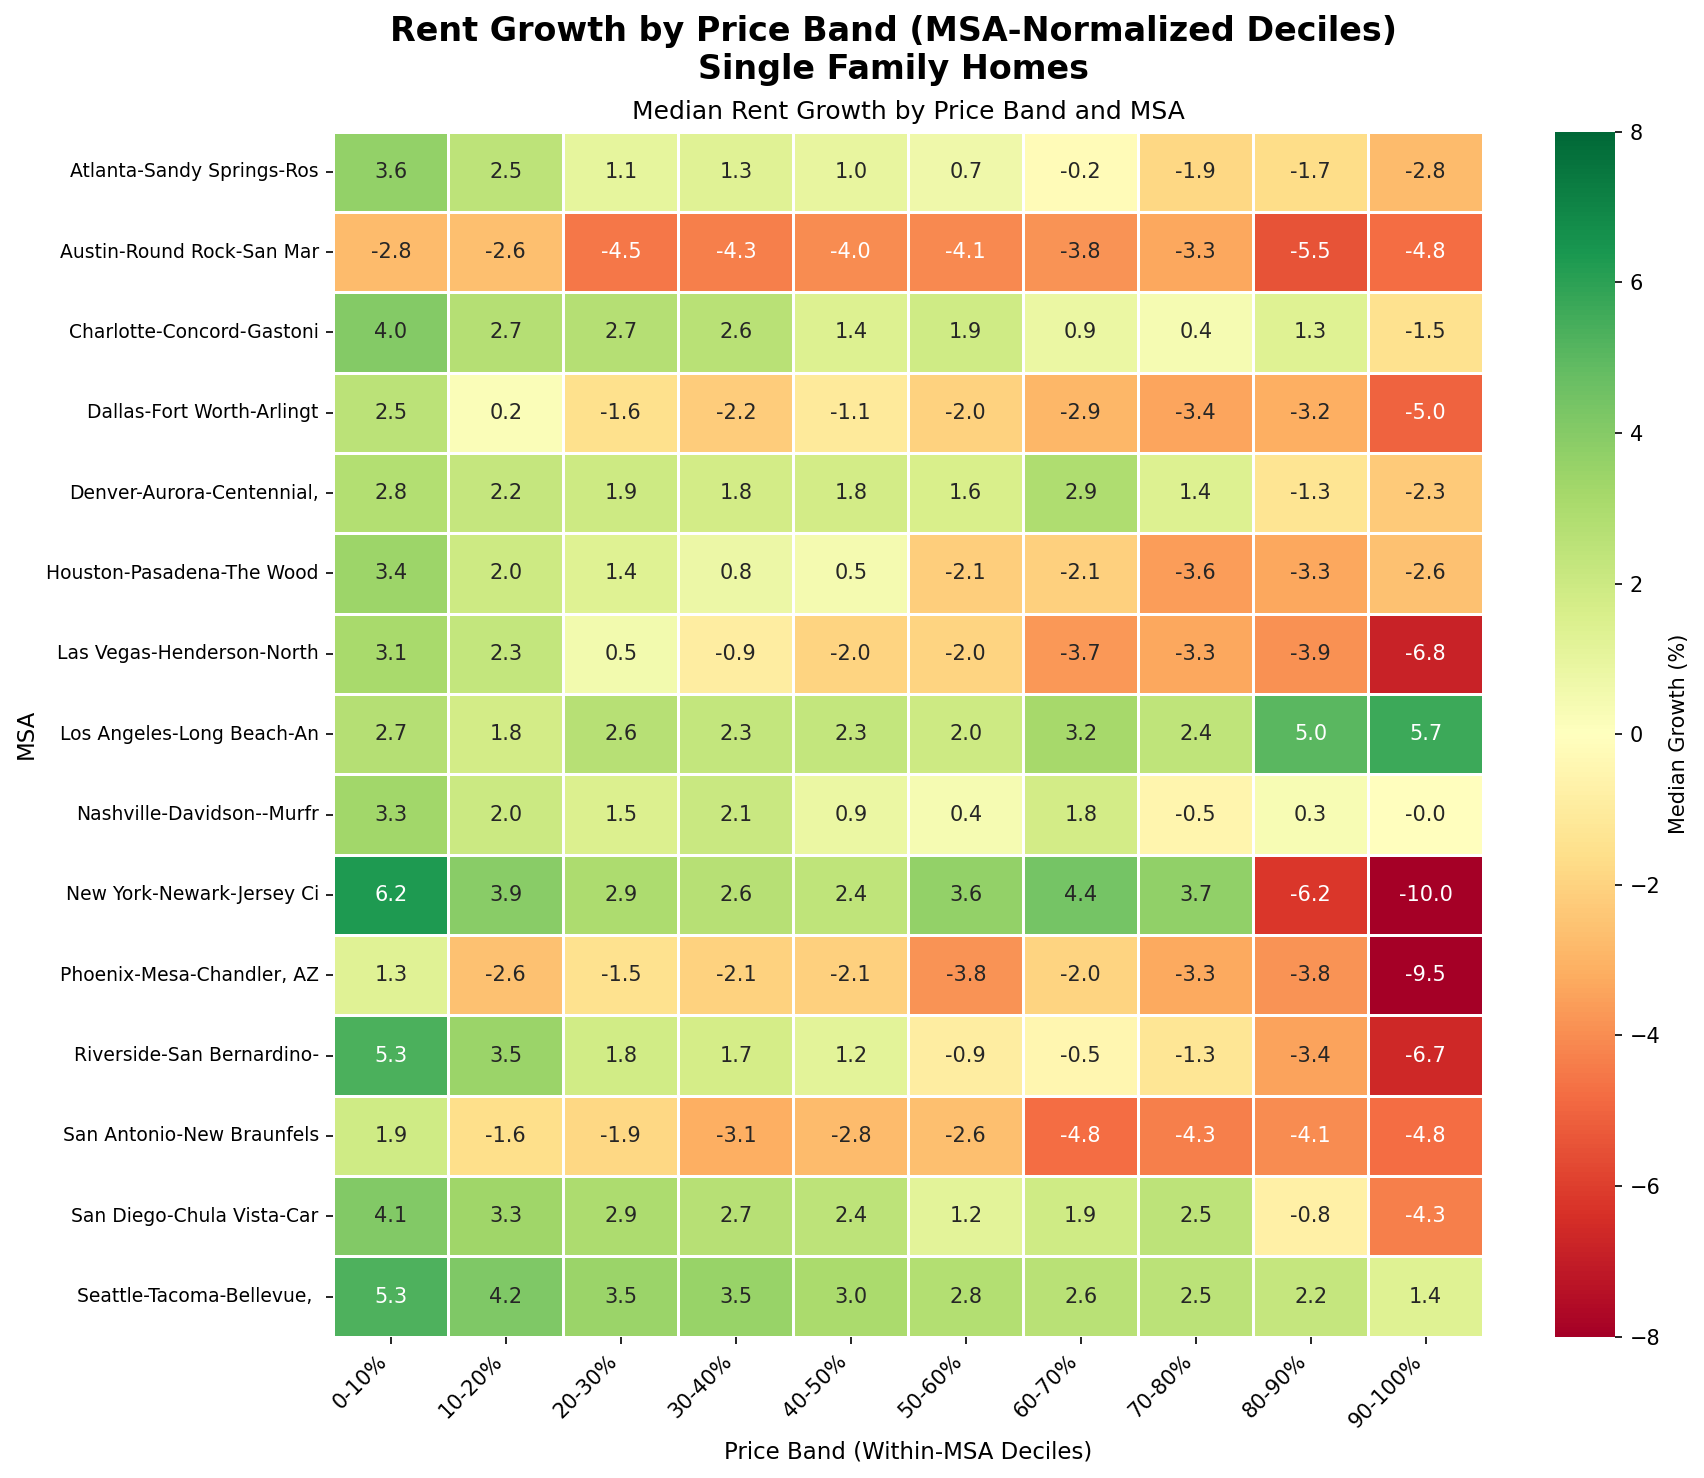
In almost every market, the least expensive rental properties had the highest rental growth. Markets like Houston, Dallas, and Vegas had positive rent growth for the bottom 30% of properties while the more expensive bands dragged down the median.
MSA Breakdowns By State
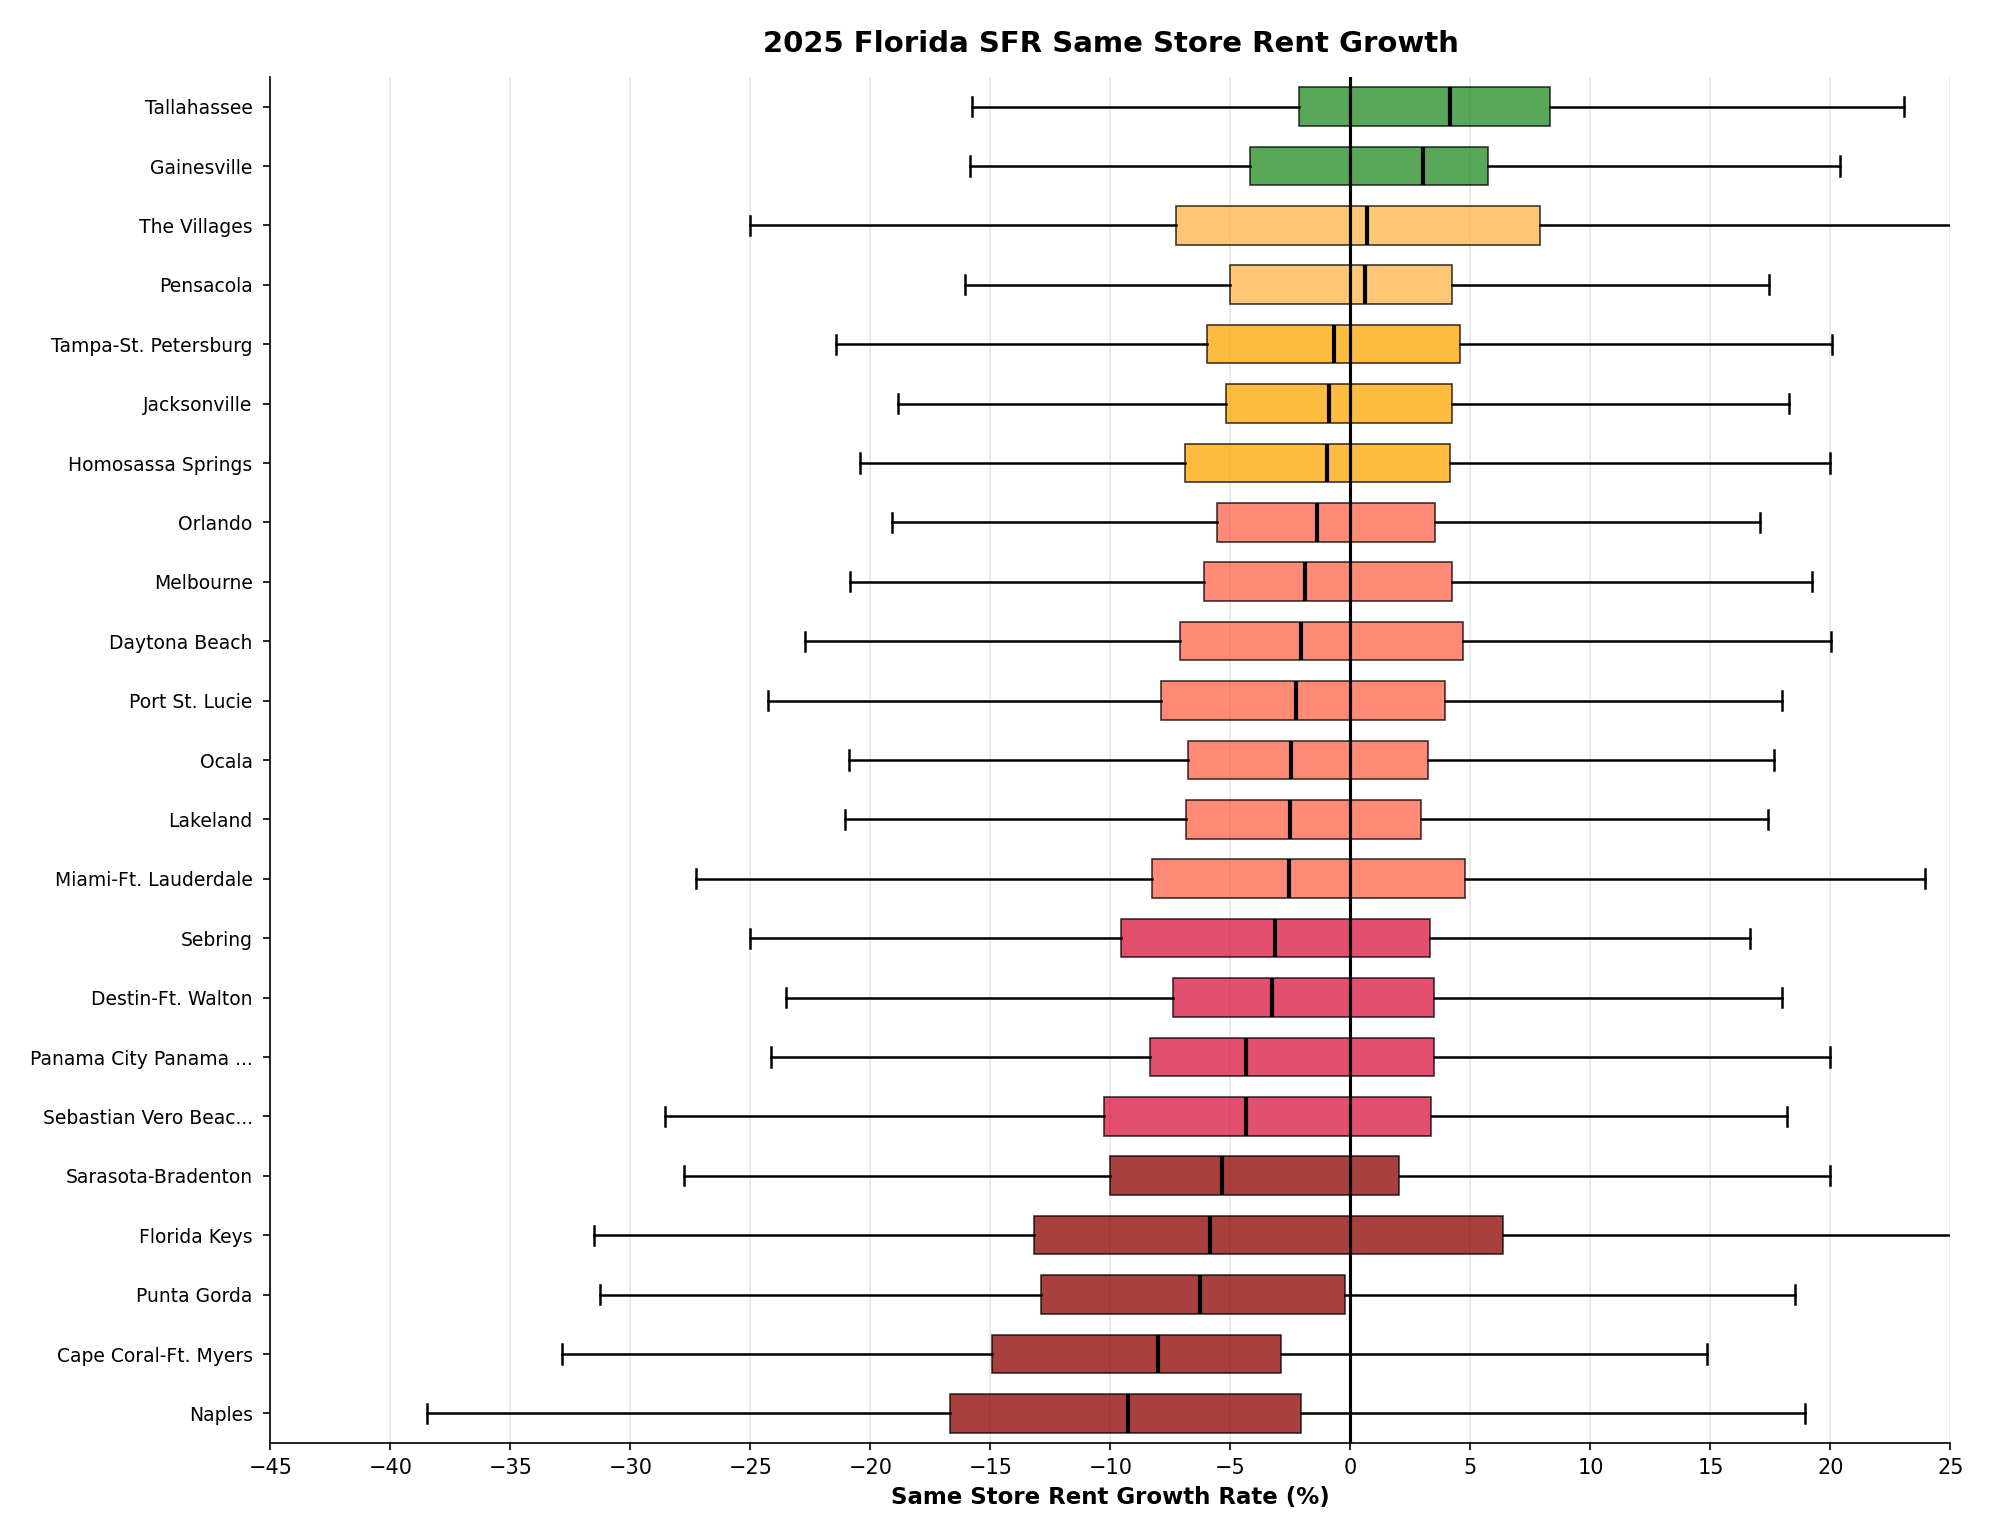
While Florida has been in the news a lot for a difficult housing market, there are still markets that are seeing positive rent growth.
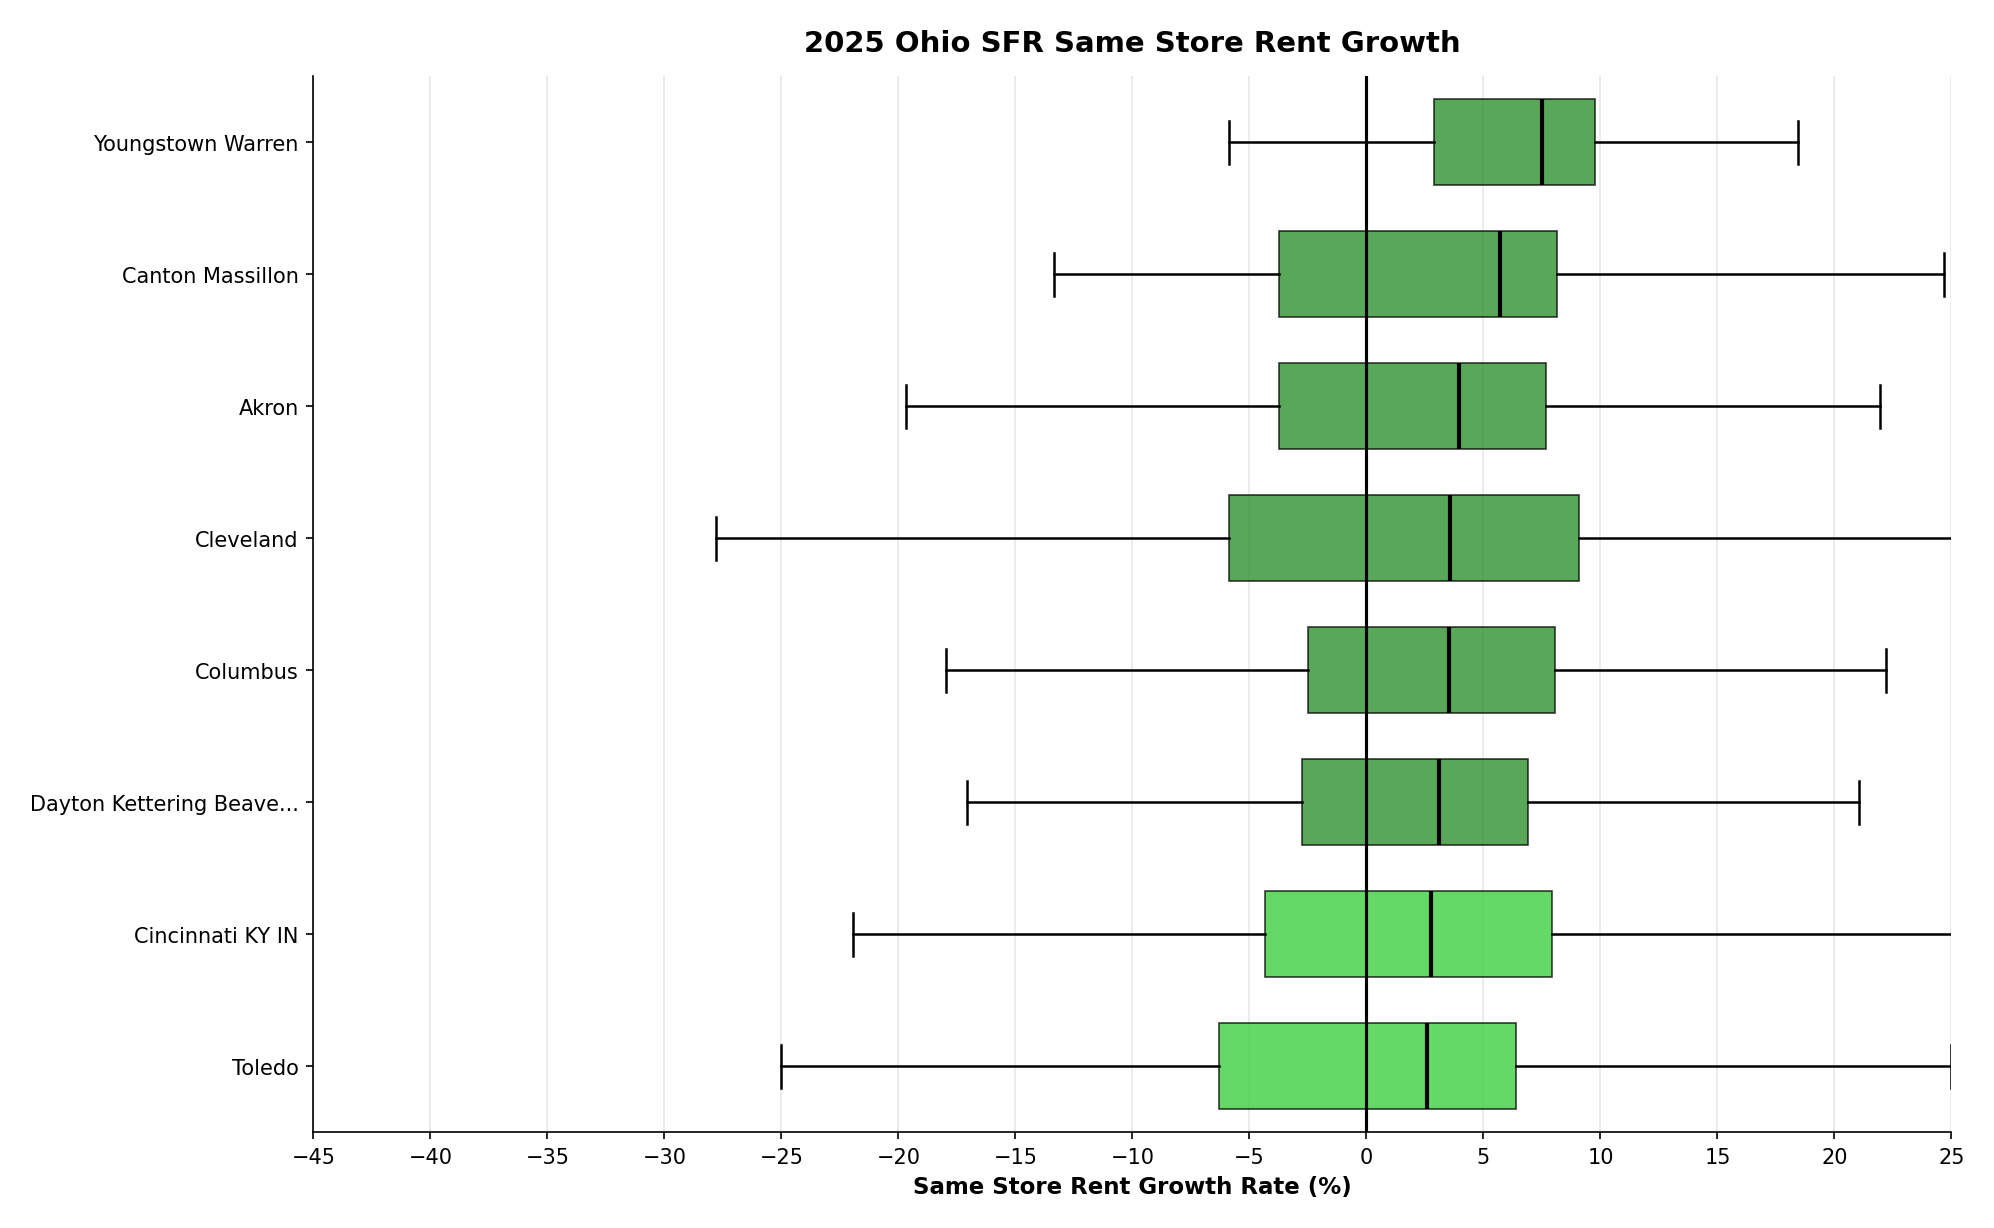
Every major MSA in Ohio had positive rent growth.
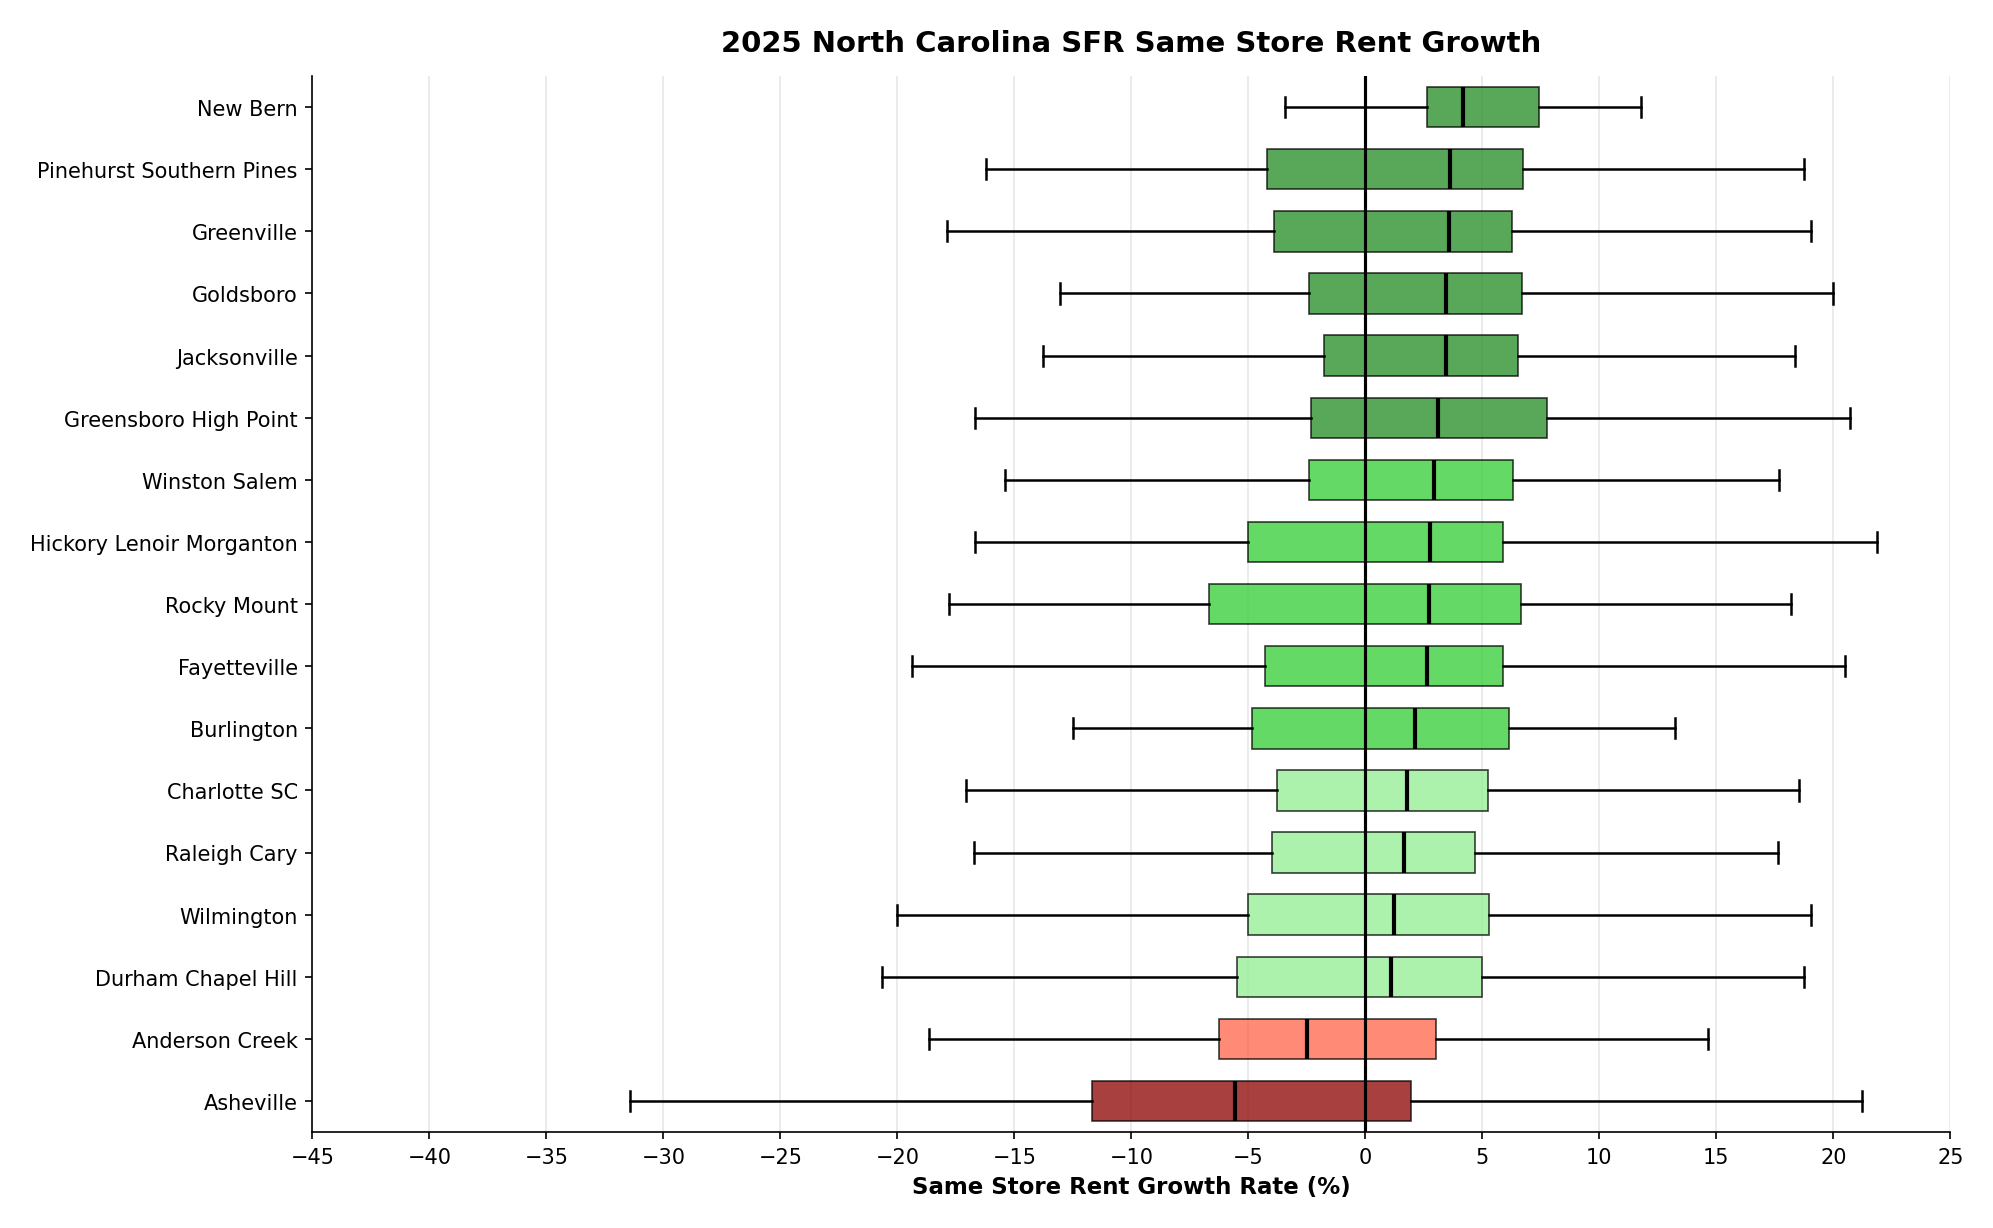
In North Carolina, virtually all major MSAs had positive rent growth except for Asheville.
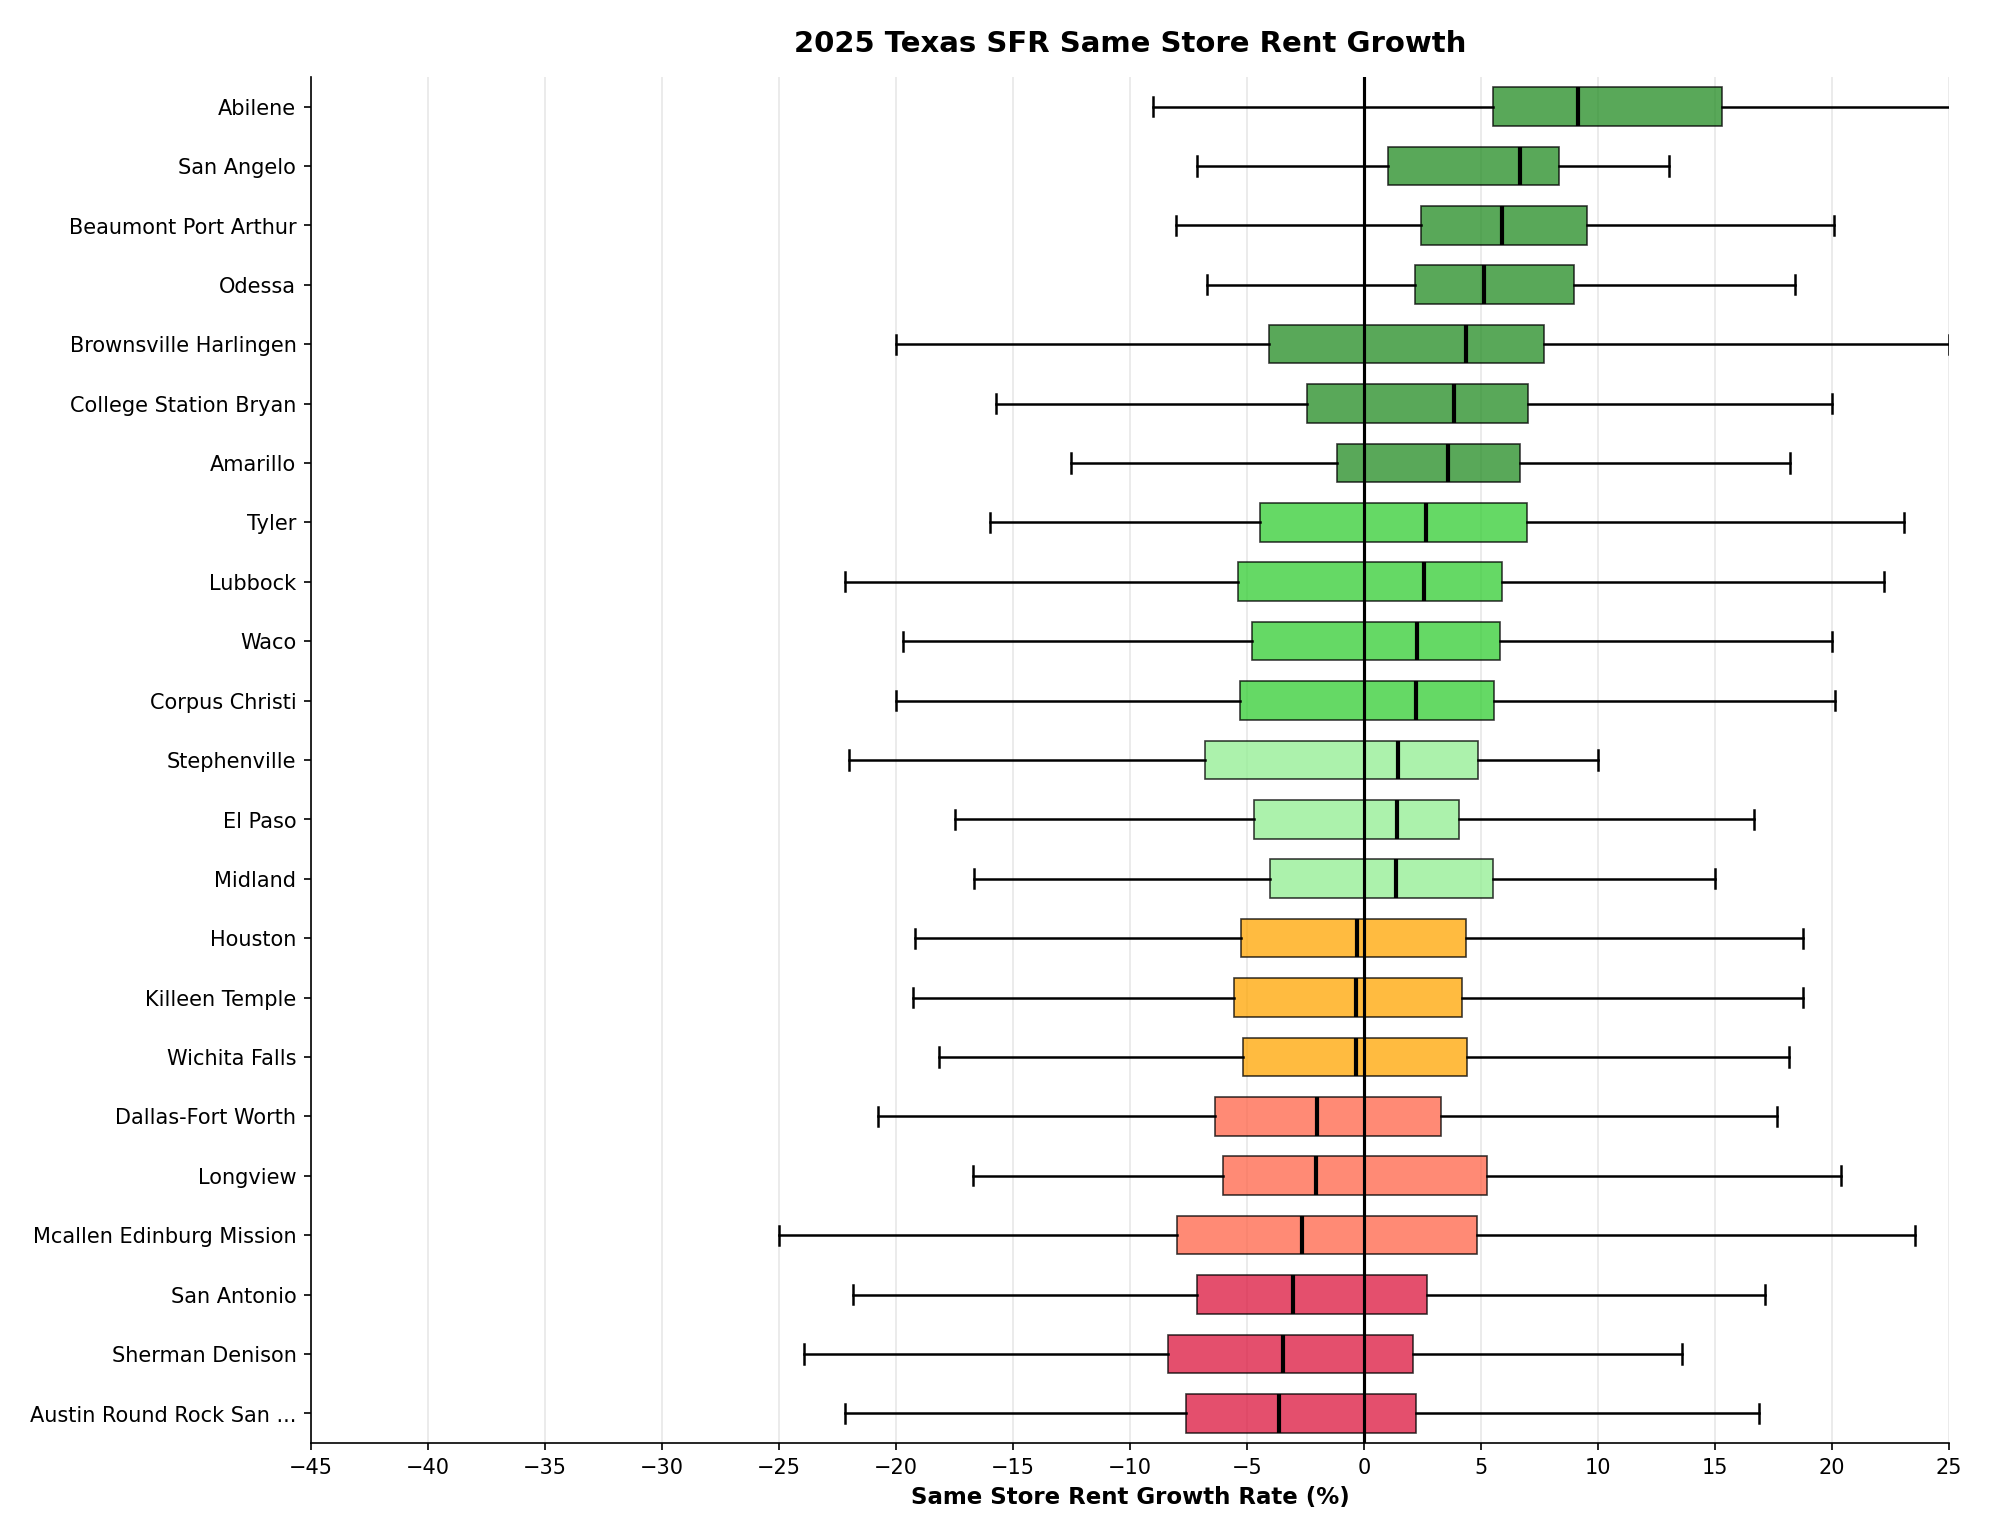
Texas was very varied at an MSA level and within an MSA and was one of the states with the highest variance in performance by metro.
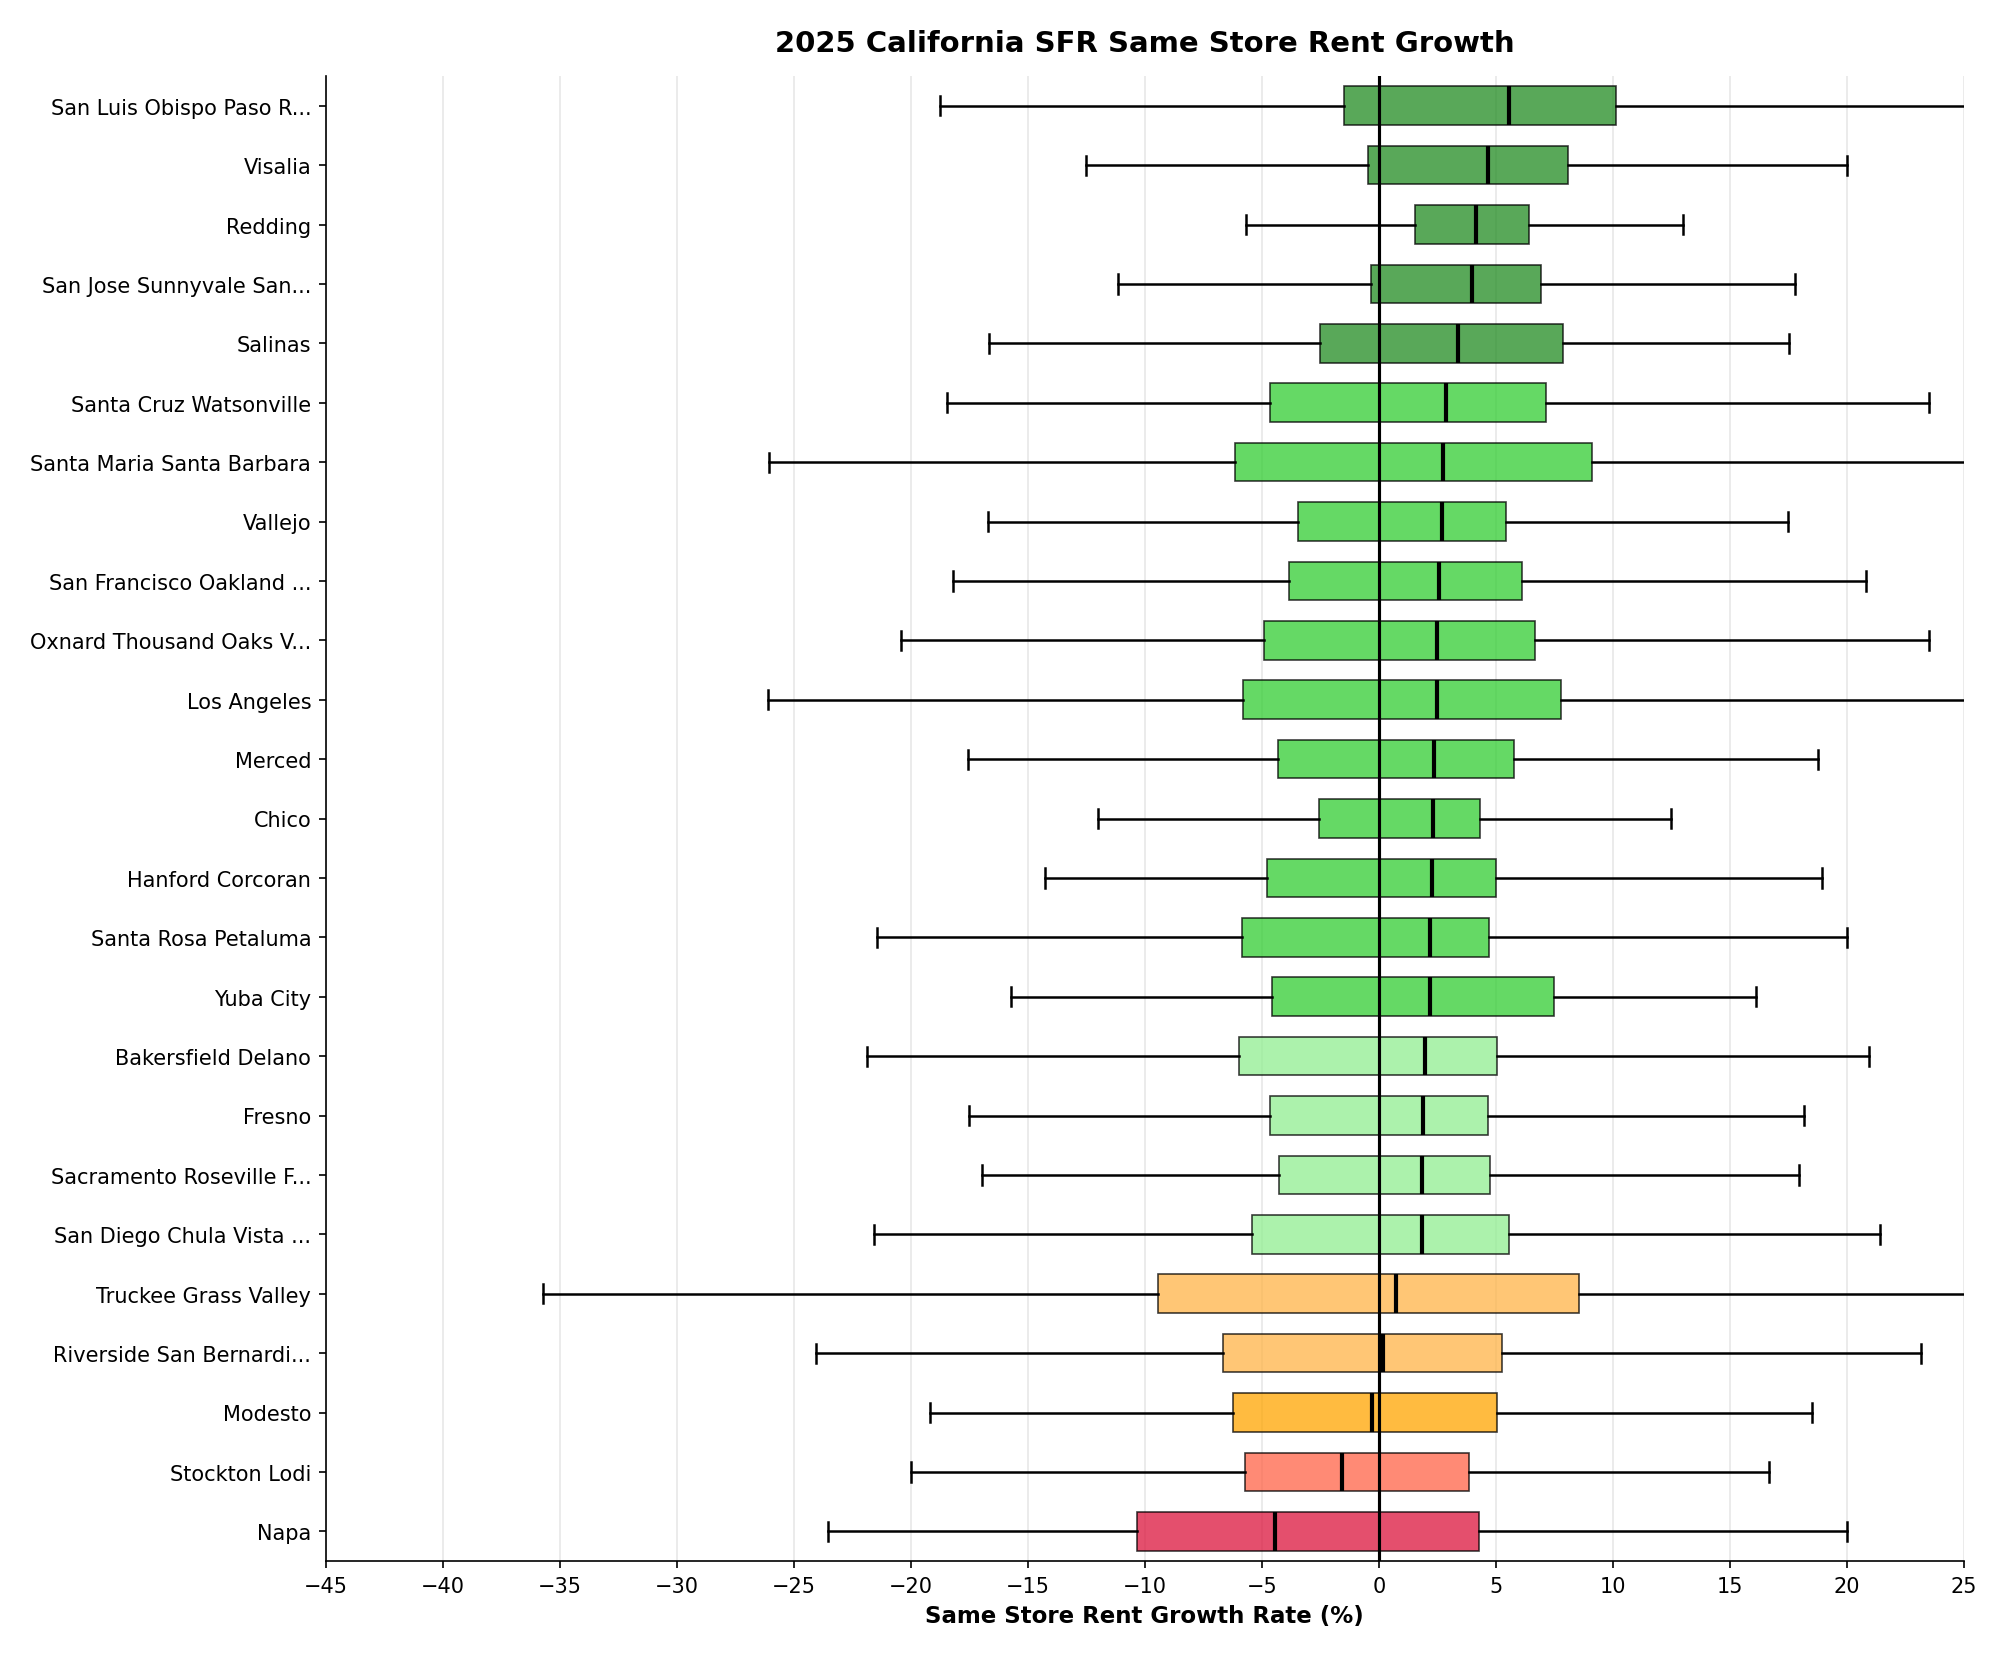
While new SFR activity is fairly muted in California, there’s still large portfolios owned throughout the state by institutional and non institutional investors. The vast majority of the metros posted positive median rent growth.
Raw Data
Want access to our stream of rental listings that gets updated daily? Email glenn@sfranalytics.com. We aggregate rental listings from major online portals and pair it up with ownership data for companies to do market research, prospecting, and more.
For paid subscribers, below you’ll find Zip code and MSA level same store rent growth figures used for this analysis.