

2025 Private Lending Year In Review
Markets Gaining/Losing, Riskiest Markets, Foreclosure Activity
Executive Summary
Private Lending activity continues to be strong and growing despite a challenging environment for real estate investors
Private Lenders financed 18% of SFR purchases by corporations in 2025 vs 15% in 2024. Regional bank pullbacks and lower cost of capital for private lenders is helping increase the share of investment properties being financed by private lenders
The total market is growing, up from $97.3B in 2024 to $121.2B in 2025, and the largest lenders are growing. 17 of the top 25 private lenders showed YoY growth. The top 50 lenders represented 56% of the origination volume
Origination volumes YoY were higher in every month of 2025 than they were in 2024, and 11 of the 12 months were higher in origination count.


The largest private lenders continue to grow, with 17 of the top 25 growing loan count YoY.

With Kiavi leading the charge at nearly $8 Billion in origination volume in 2025, the top 10 lenders captured meaningful market share, originating 28% of the volume. The top 25 lenders originated 43% of the volume and the top 100 originated 66%.
While ~78% of the volume was originated by the top 250 lenders, a long tail of >10,000 private lenders originated a business purpose loan in 2025 (many of whom were individuals doing it in their own name).

Metro Changes
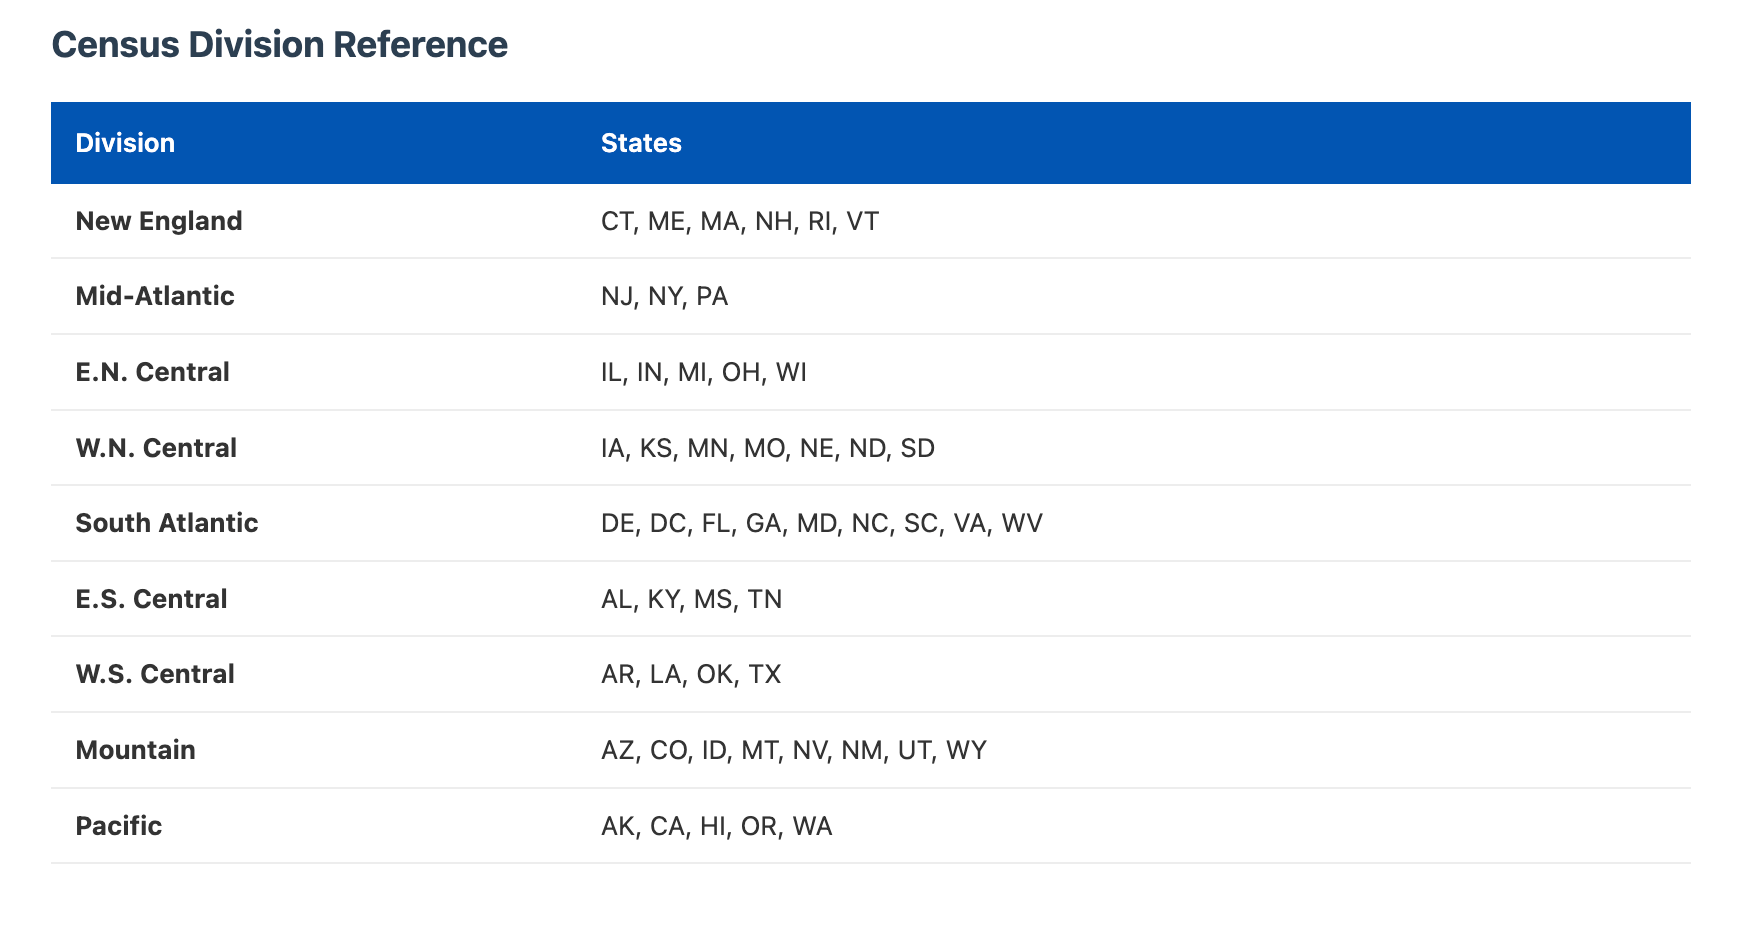
Every region in the United States saw an increase in private lending activity, with the Pacific and South Atlantic leading the charge with most volume increases.

The top 15 states by volume all increased YoY and the only state to decrease was Louisiana.

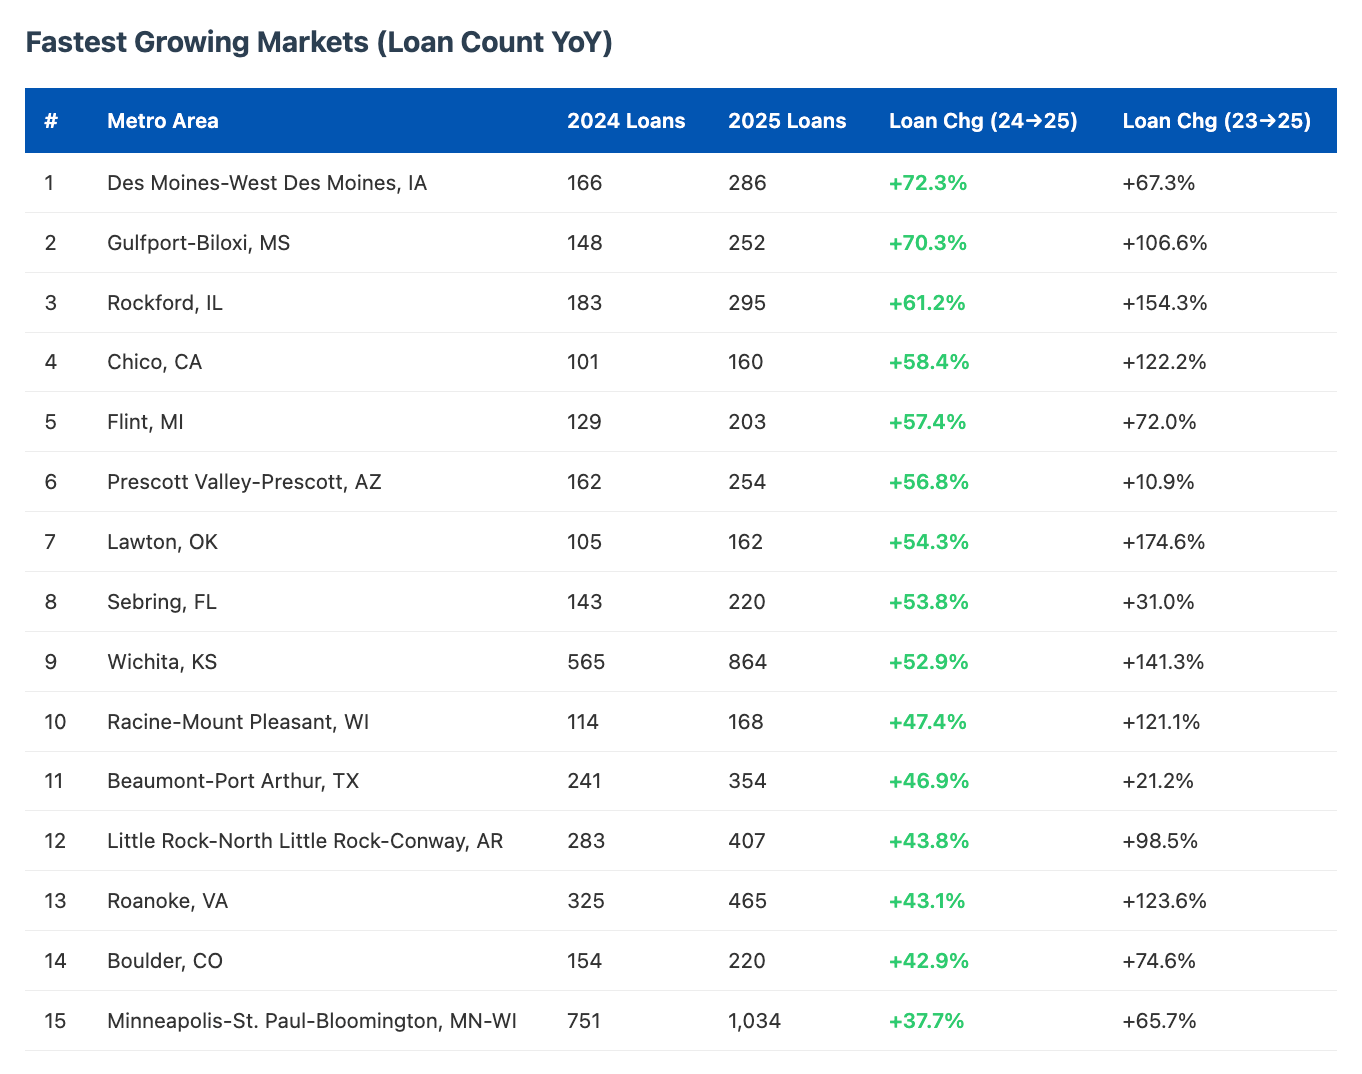
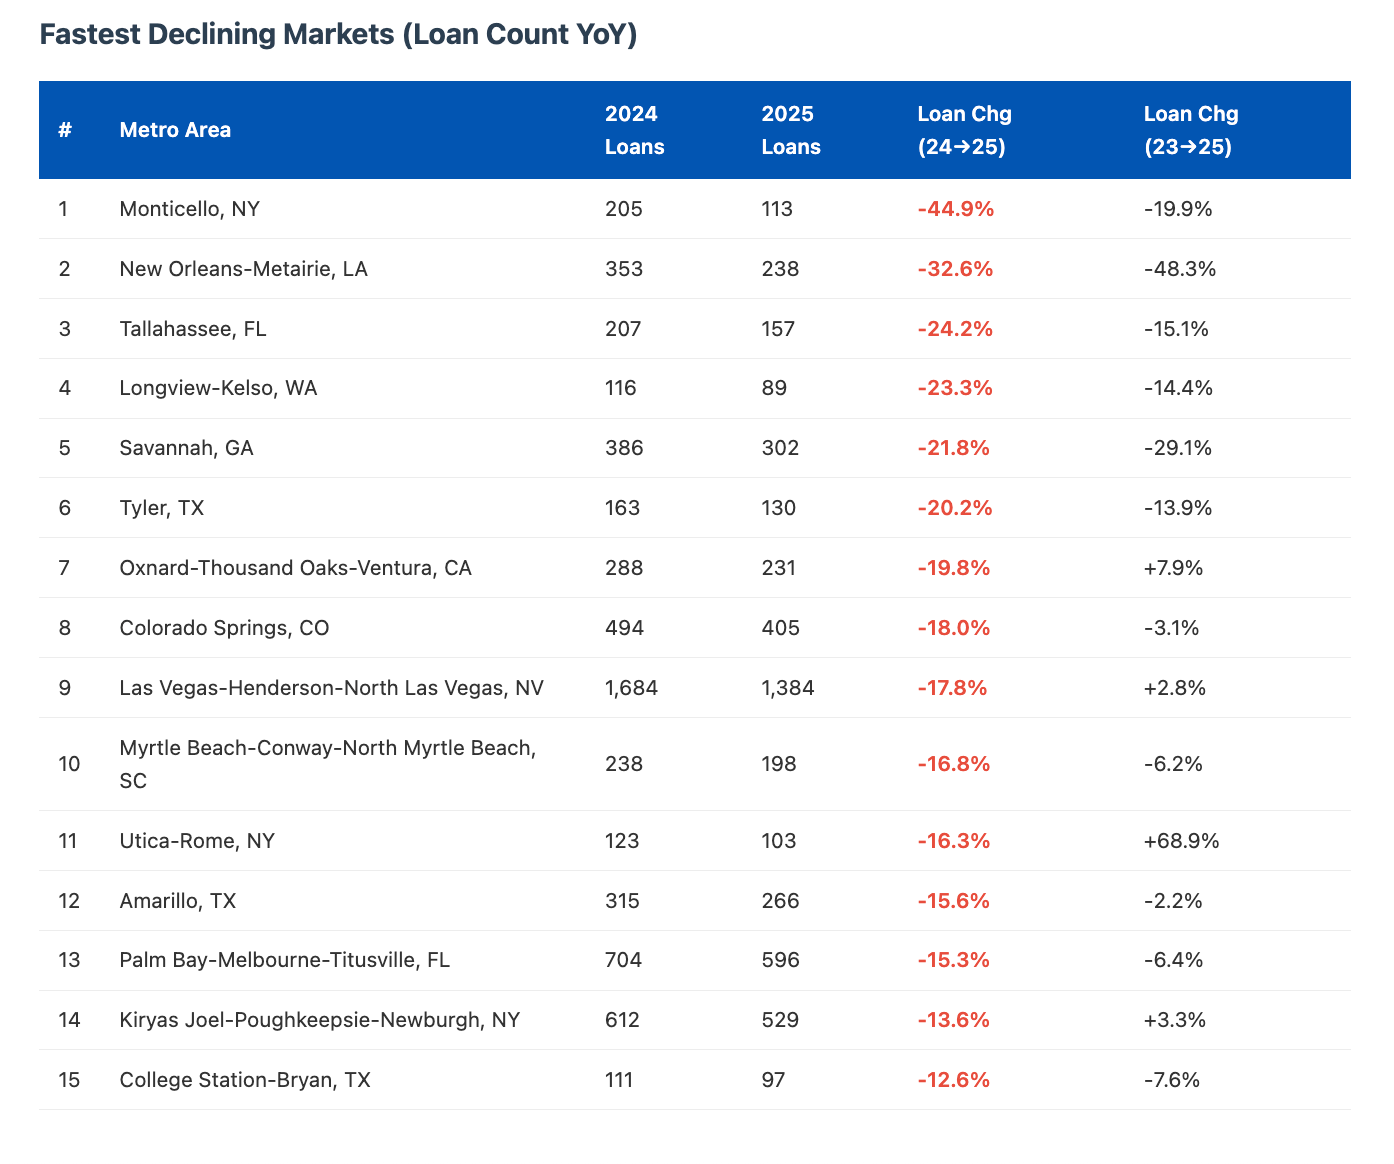
The vast majority of metro areas saw YoY increases in private lender activity. We prefer to look at loan count because loan volume in small metros can get noisy (for example a large portfolio refi in Waco skews the metrics in the second chart below).


Baltimore leads the pack for the market that slowed the most in origination activity throughout the year. Plagued by a large scale fraud network, many note buyers temporarily stopped buying in Baltimore and the activity is still lagging behind what it was.
Other markets that are heavy DSCR saw acceleration throughout the year with Springfield, York, South Bend, and Youngstown seeing oversized growth.

Private Lender Penetration
One of the metrics we like to track is the percent of corporate purchased single family homes financed by private lenders. Overall, the market jumped from 15% of corporate single family homes financed by private lenders to 18%.
The West Coast dominates, with major metros seeing >30% of acquisitions financed by private lenders.
Less expensive markets where investment properties can be purchased with cash easier continue to have the lowest private lender penetration rates, with the lowest being <5%.

Cash buyers remain the most popular way for investors to purchase single family homes.

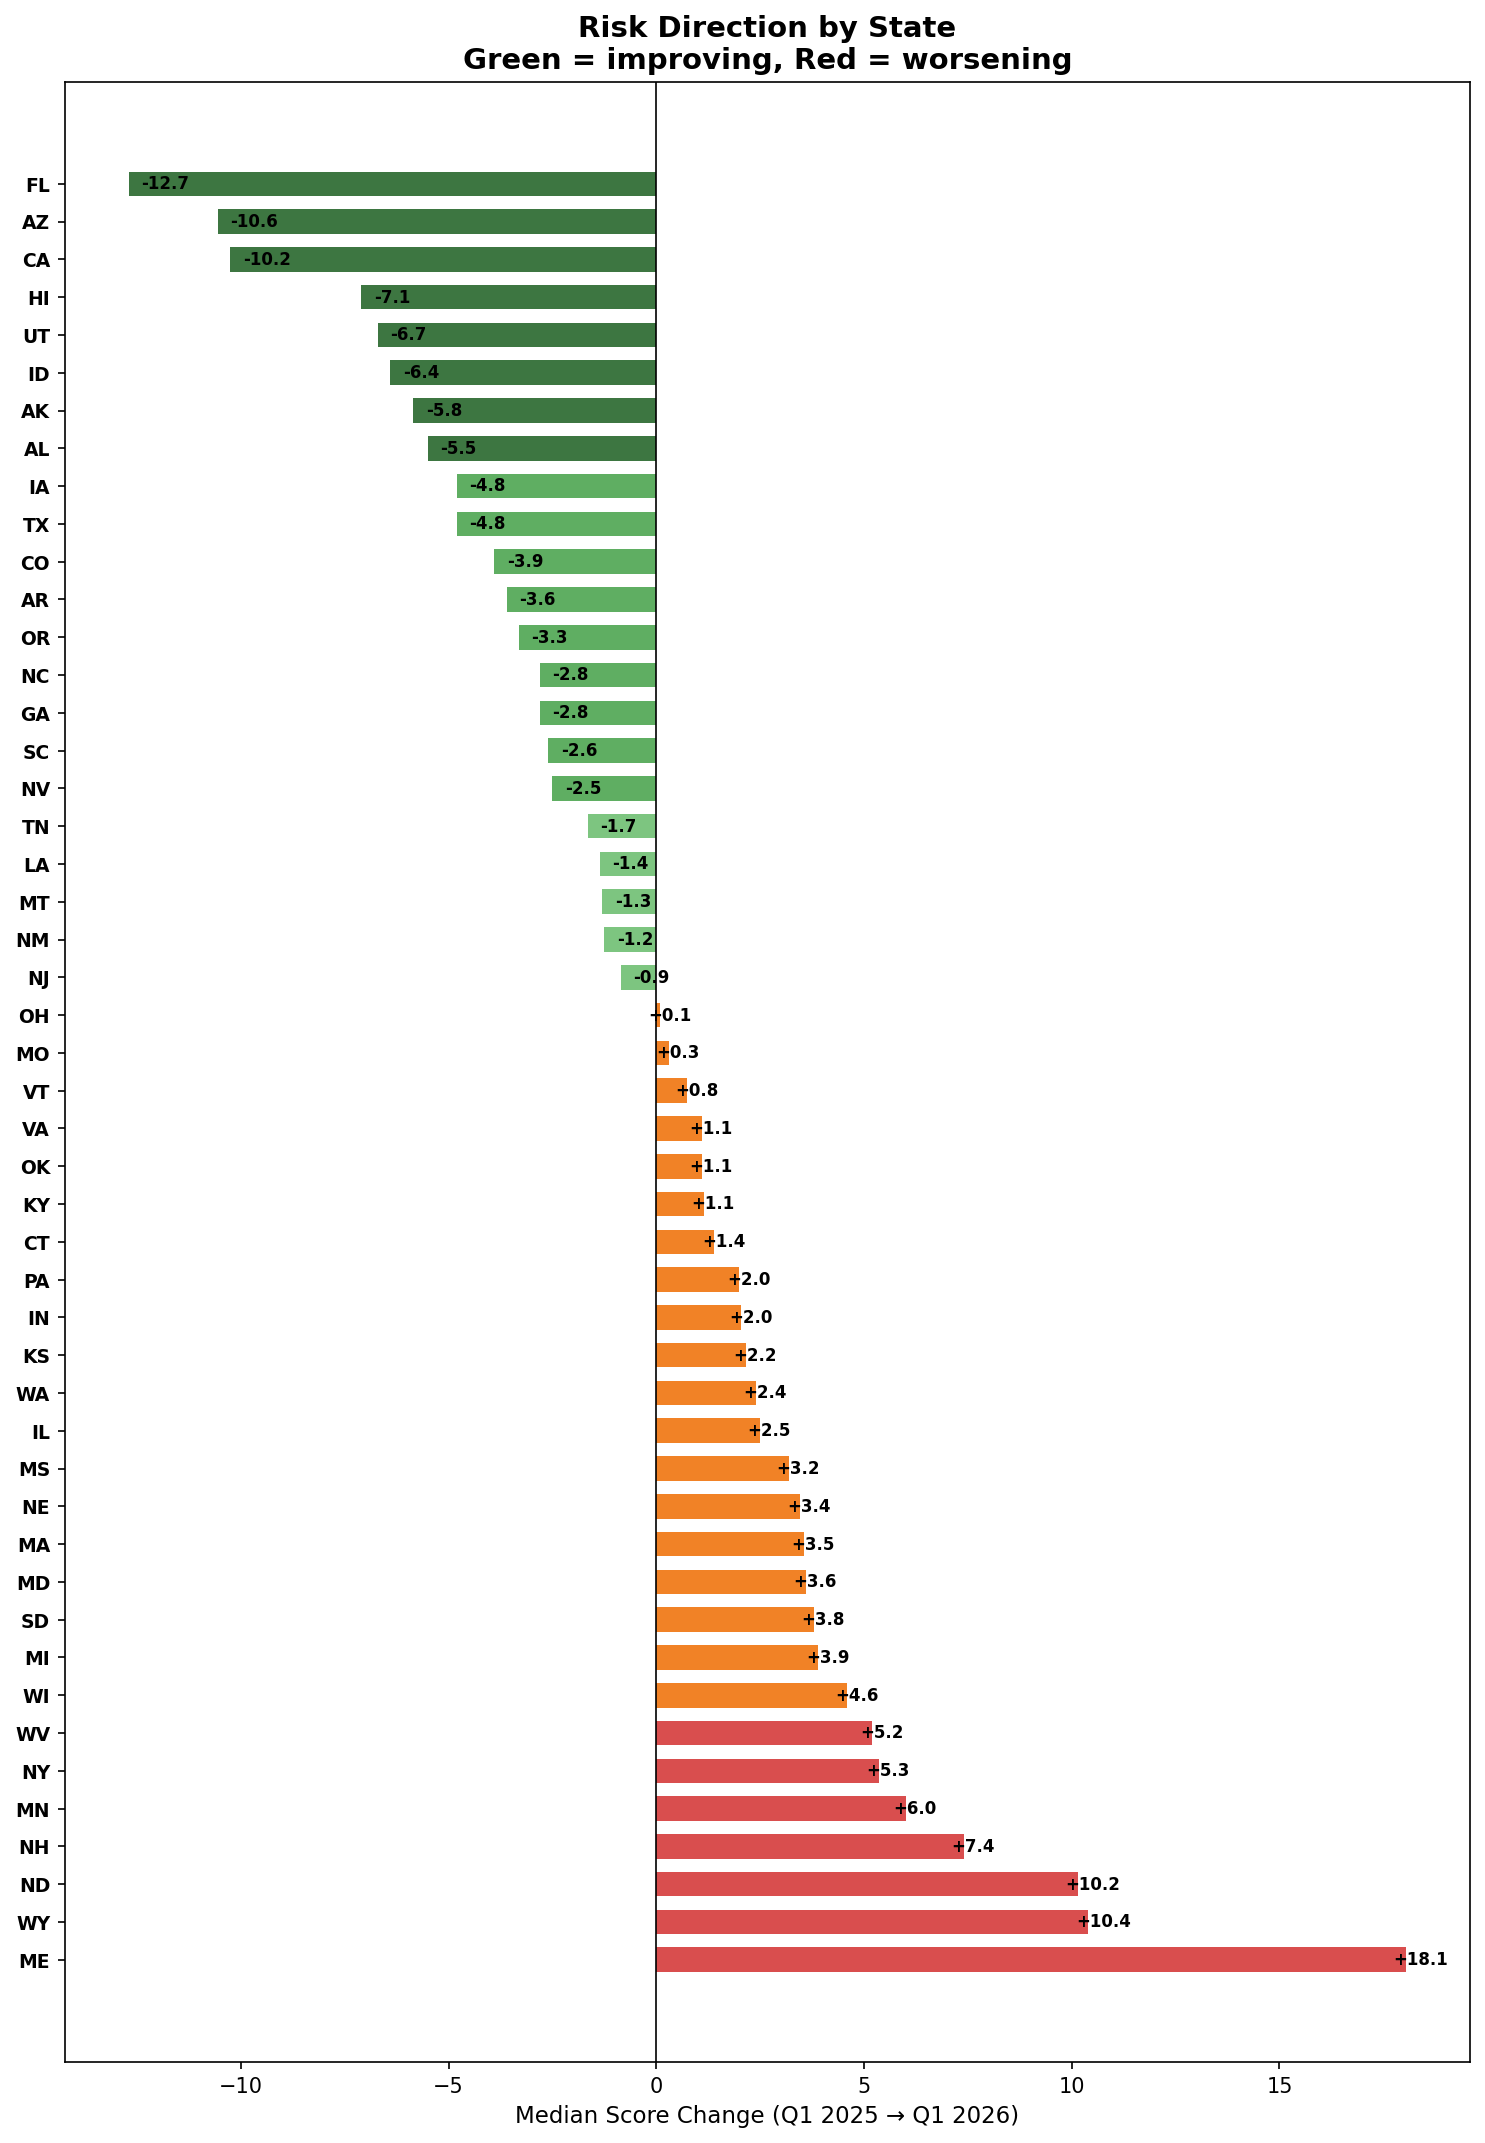
Riskiest Markets
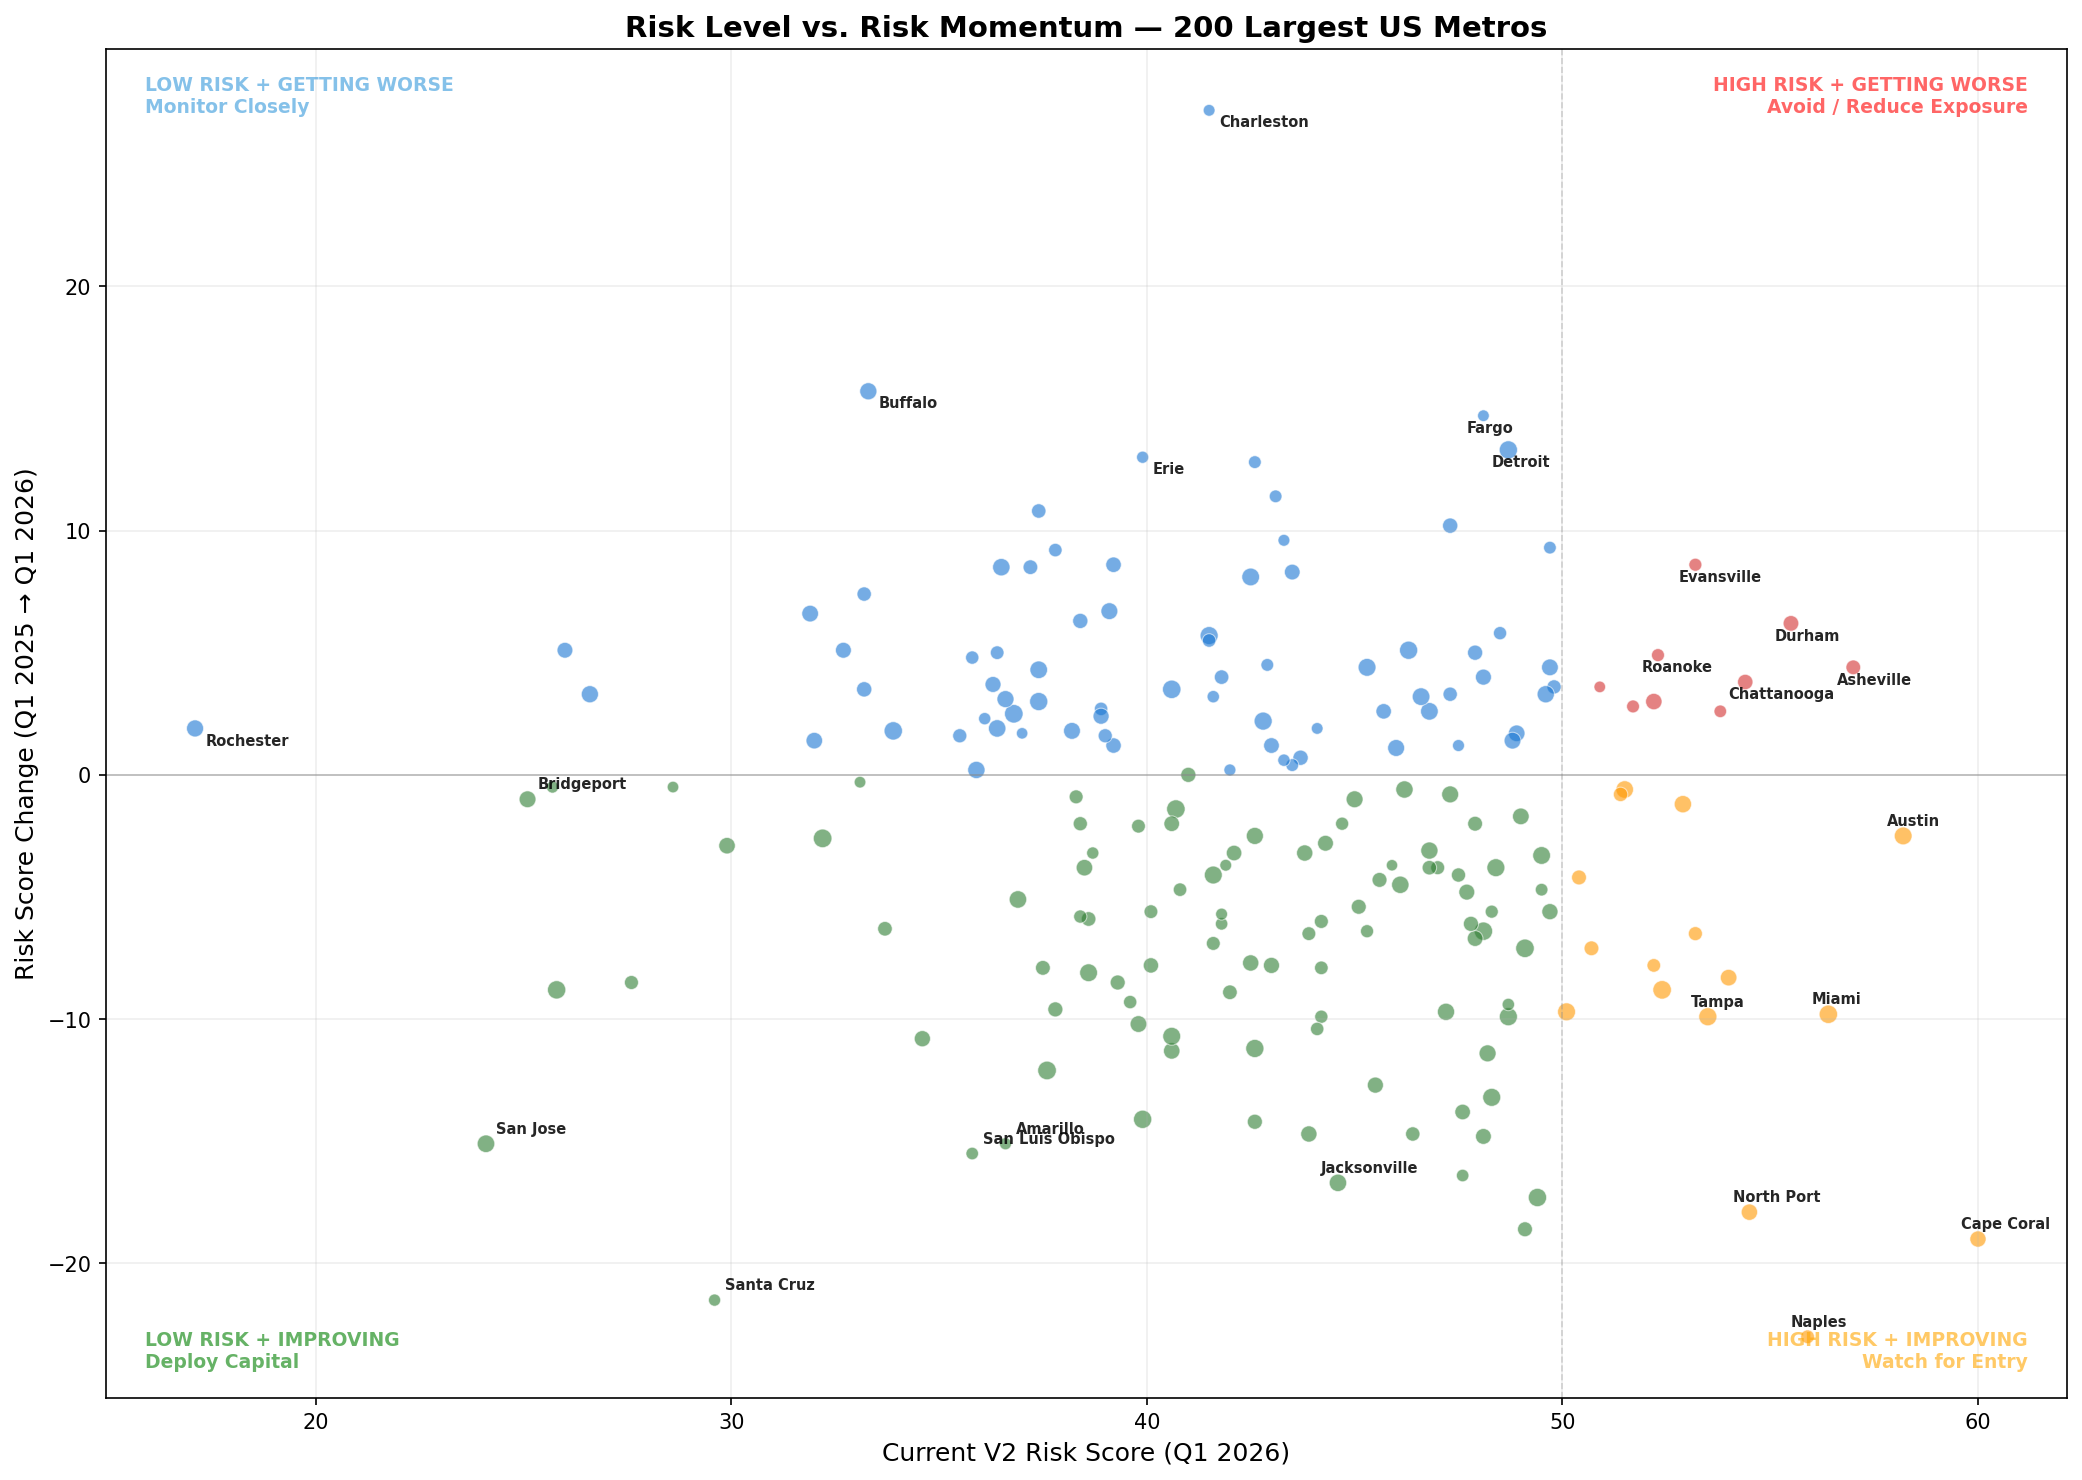
We recently published an article highlighting the riskiest SFR markets that looks at inventory changes, supply, home value changes, price cuts, and more to identify high vs low risk markets for home price depreciation.
The higher the risk score, the more likelihood of price depreciation there is. Cape Coral, Naples, and North Port are all high, but have significantly improved YoY, while Asheville, Durham, and Chattanooga have all increased YoY and have relatively high scores.
Pre-foreclosures are rising both overall and for loans originated by private lenders, but the vast majority of metros are below 3% of outstanding loans in pre-foreclosure.


Top Borrowers
To see the top 100 borrowers last year by loan count, subscribe below.