

2025 Out-of-State Investor Overview
Analyzing trends in out-of-state investor activity across metros nationwide
Executive Summary
Out-of-state investment in single-family homes remains high despite recent cooling:
Non-resident investors purchased 5.56% of U.S. single-family homes in 2025, maintaining levels comparable to the pre-pandemic baseline of 5.8% (2019)
While this represents a decrease from 5.74% in 2024 and a significant drop from the 2021 peak of 7.29%, the persistence of elevated non-local investment suggests a lasting shift in residential real estate market dynamics
Methodology
Our analysis identifies out-of-state investment by comparing property deed locations against owner mailing addresses across state lines. To ensure accuracy in measuring genuine out-of-state investment activity, we apply two key criteria:
Baseline Definition: The property deed location and owner’s mailing address must be in different states
Geographic Filter: We exclude transactions where the deed’s mailing address falls within a 60-mile radius of the purchased property, even if across state lines
This methodology helps isolate genuine out-of-state investment from routine cross-border transactions in interconnected metropolitan regions
Analysis
National Trends: 2019-2025
Out-of-state investment activity has followed a distinct pattern over the past six years:
Pre-pandemic baseline (2019): 5.8% of single-family purchases
COVID peak (2021): 7.29% - driven by remote work migration and investor interest in Sun Belt markets
Post-peak normalization (2024): 5.74% - gradual cooling as interest rates rose
Current state (2025): 5.56% - continued moderation to near pre-pandemic levels
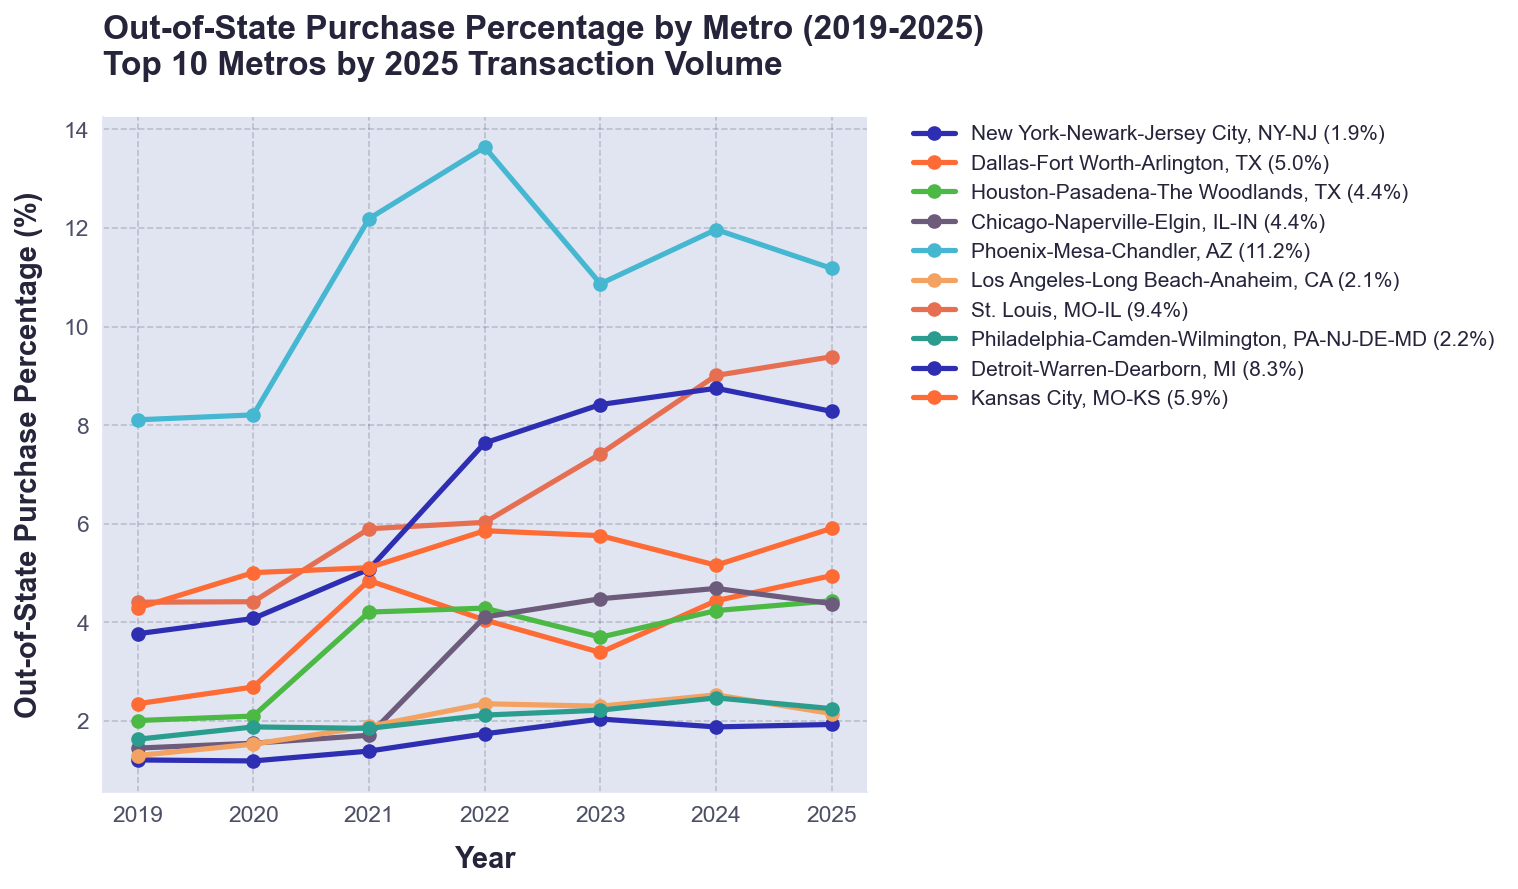
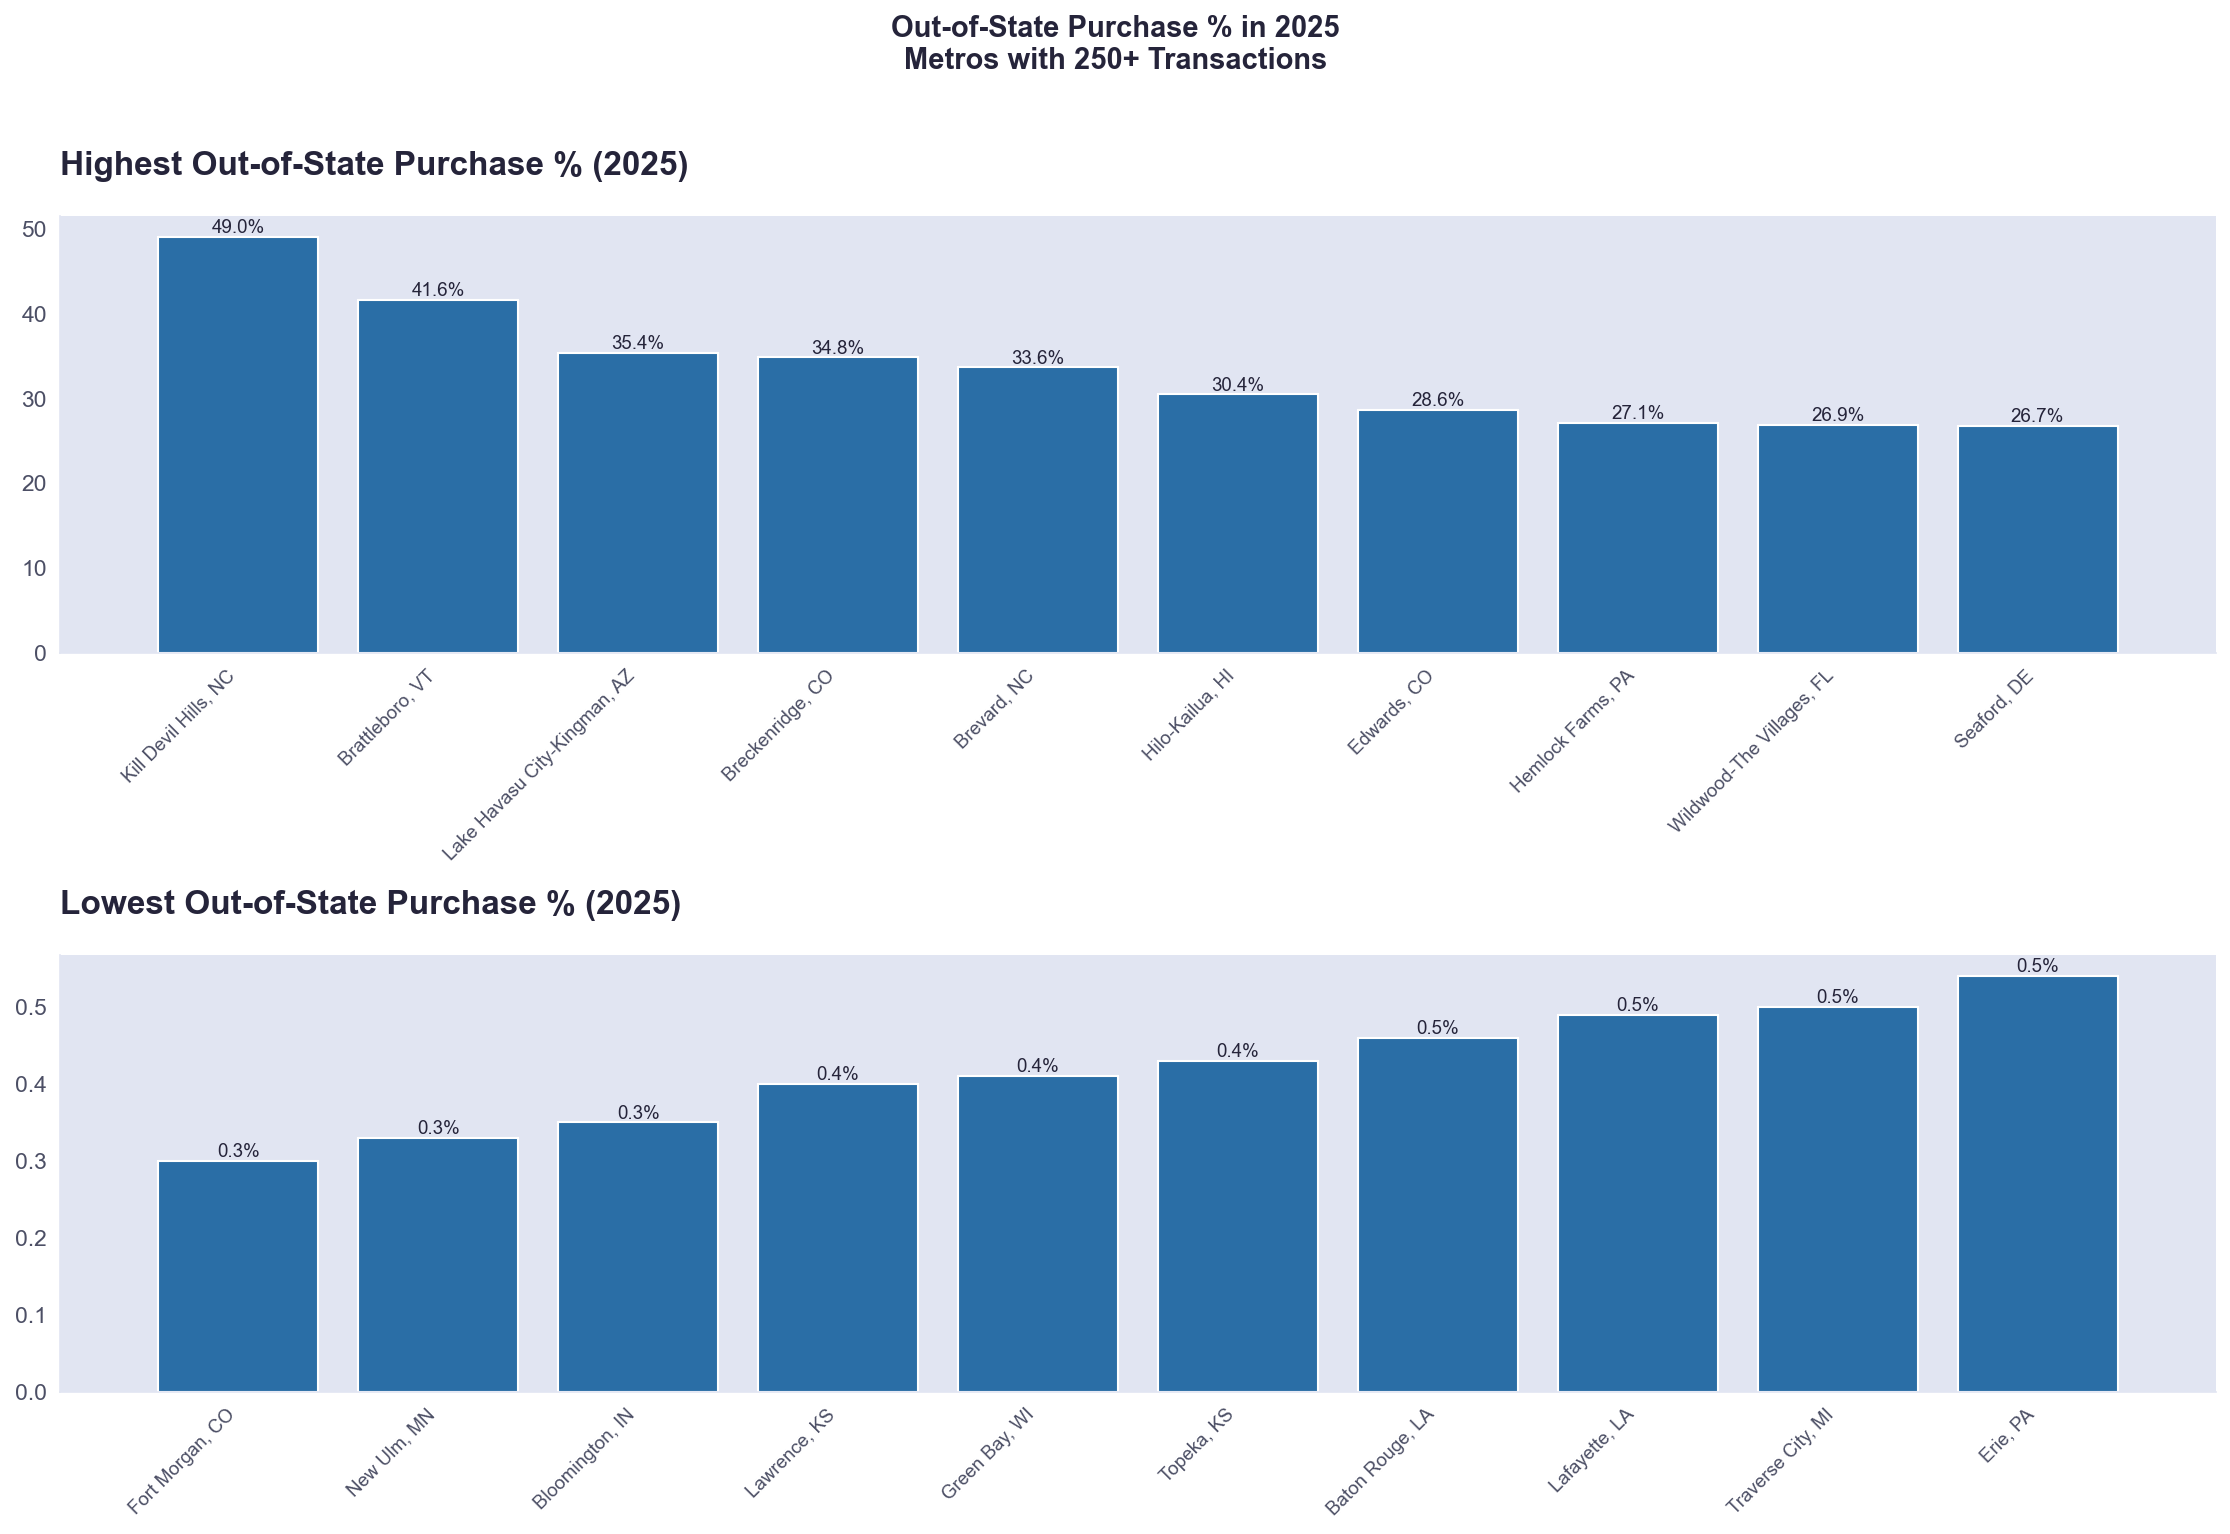
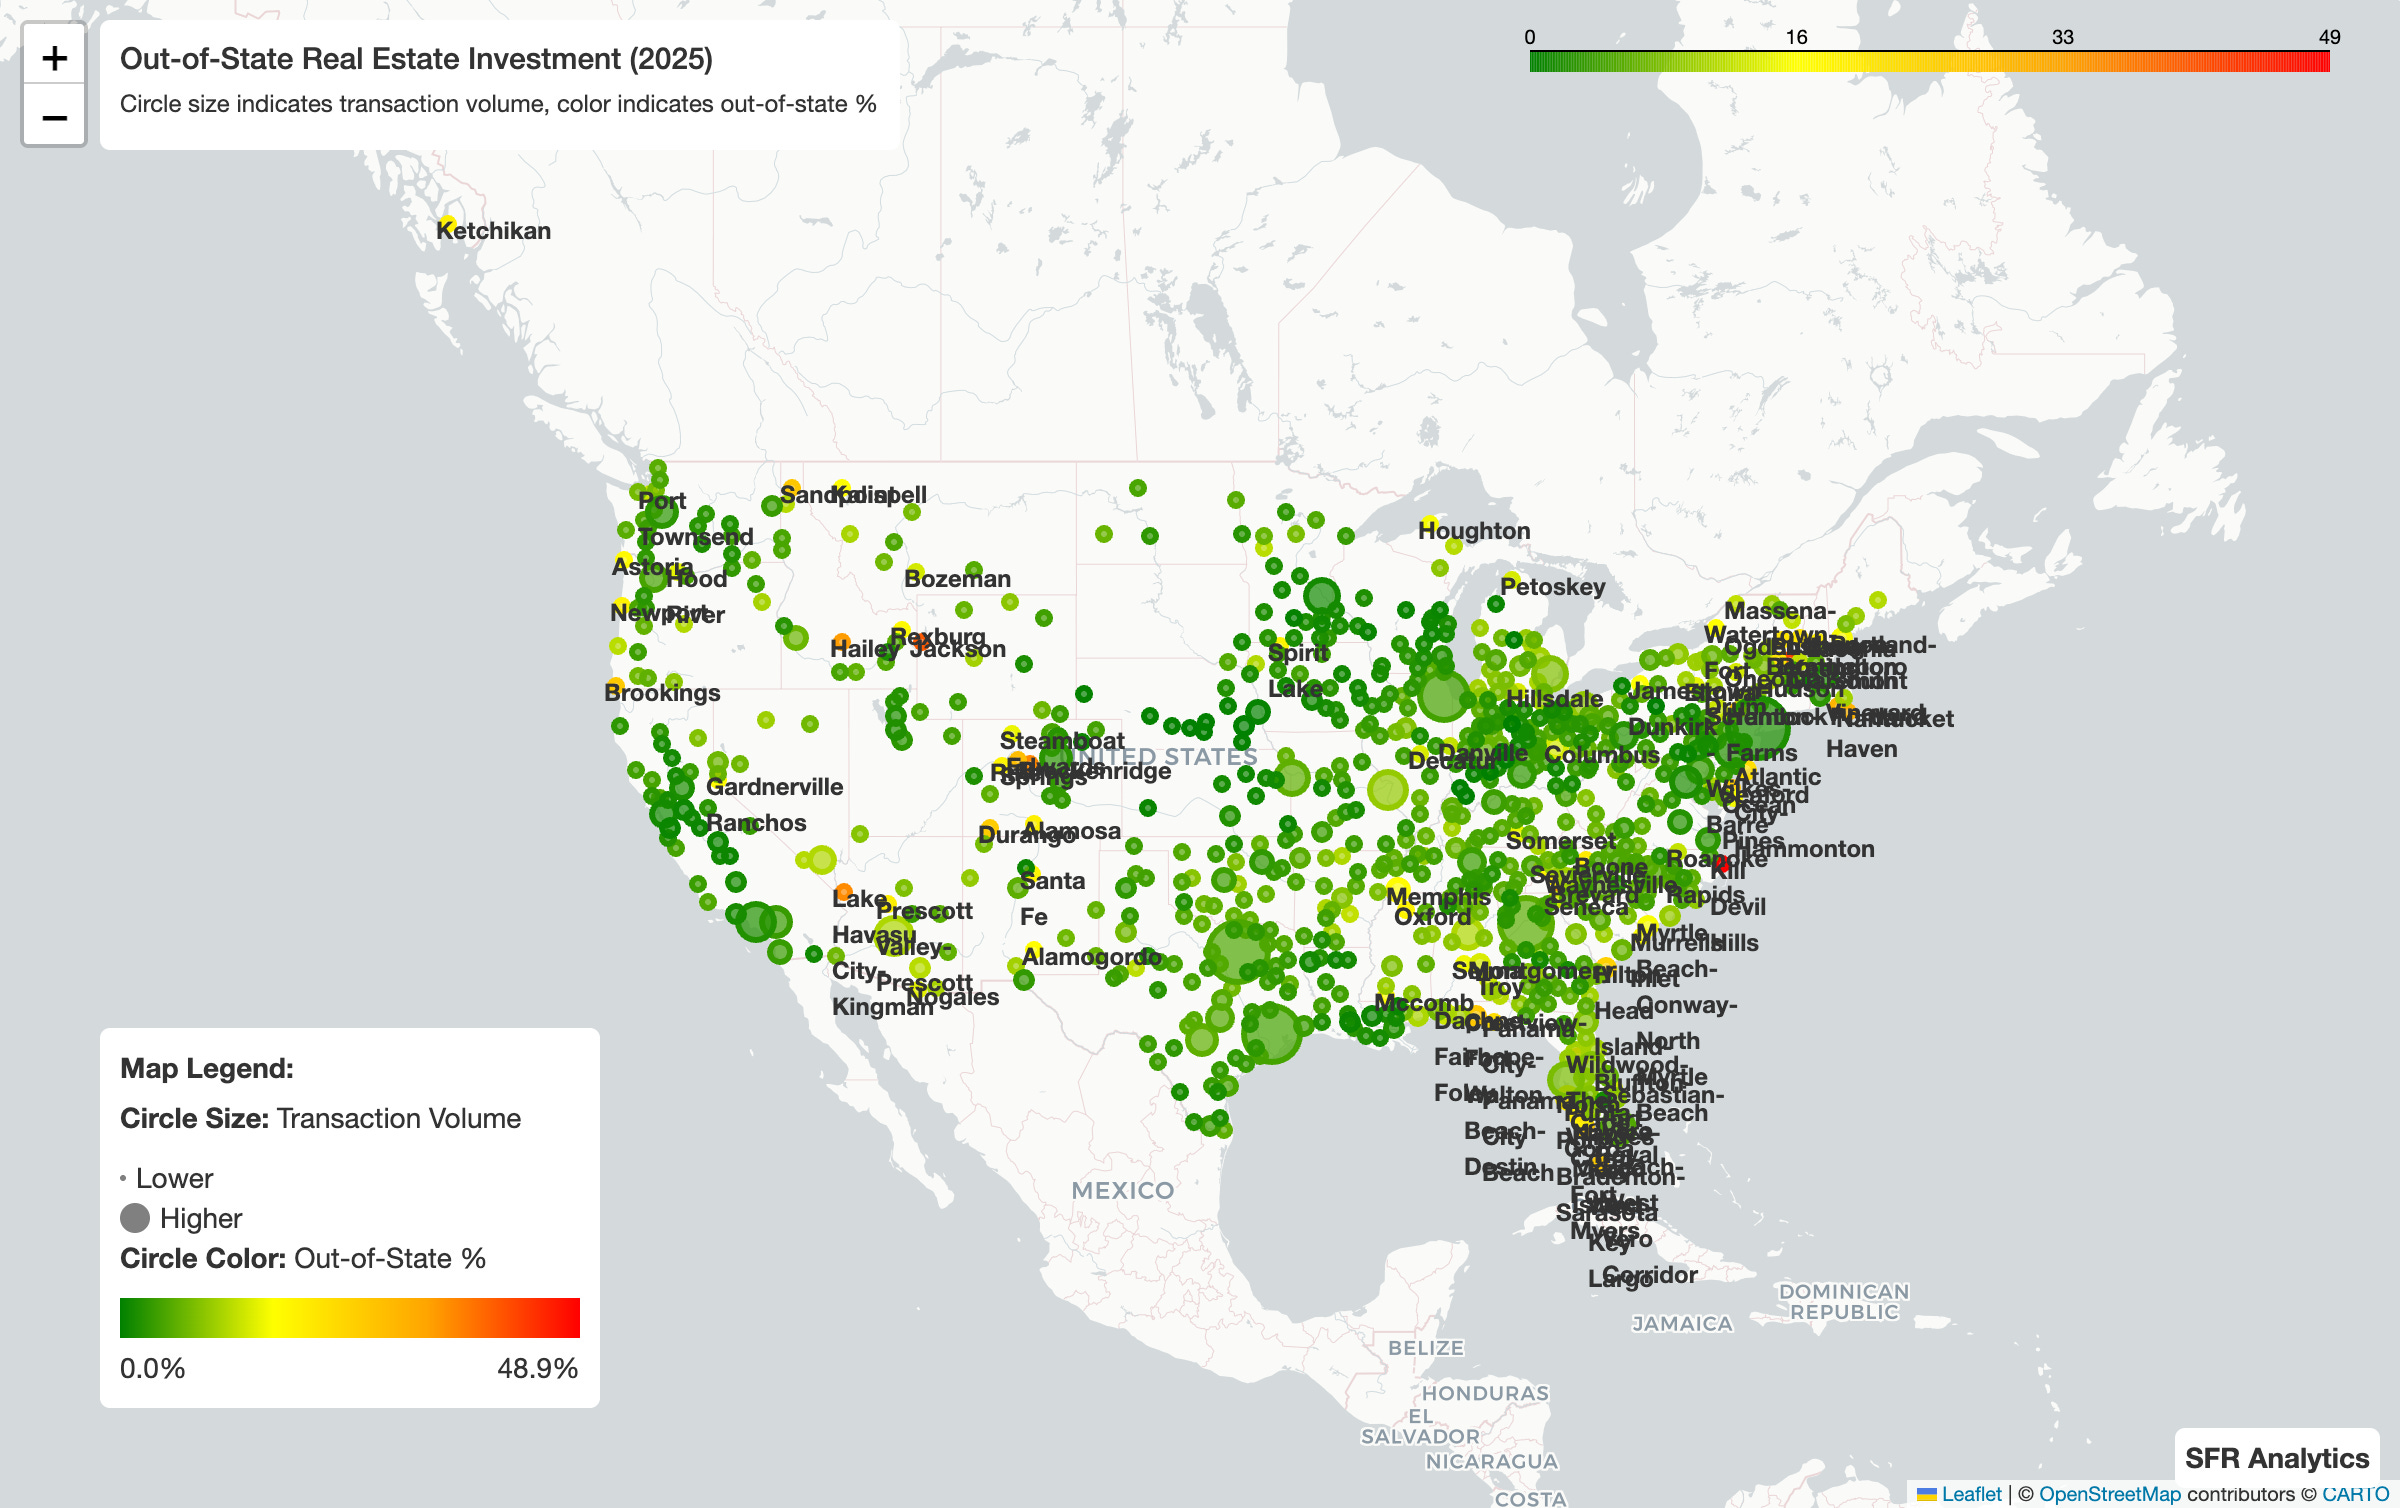
Metro-Level Analysis
Our analysis of 400+ metropolitan statistical areas reveals significant variation in out-of-state investment activity:
Highest OOS Rates (2025):
Breckenridge, CO: 34.8% - resort/vacation market
Brevard, NC: 33.7% - mountain retirement destination
Jackson, WY: 33.3% - luxury resort market
Seaford, DE: 26.7% - coastal Delaware beach communities
Kapaa, HI: 26.7% - Hawaiian vacation properties
Major Metros with Elevated OOS Activity:
Cape Coral-Fort Myers, FL: 19.5% (+1.45pp YoY)
North Port-Bradenton-Sarasota, FL: 20.1% (-0.49pp YoY)
Memphis, TN: 17.6% (+1.17pp YoY)
Columbus, OH: 14.5% (+1.63pp YoY)
Phoenix-Mesa-Chandler, AZ: 10.7% (-1.49pp YoY)
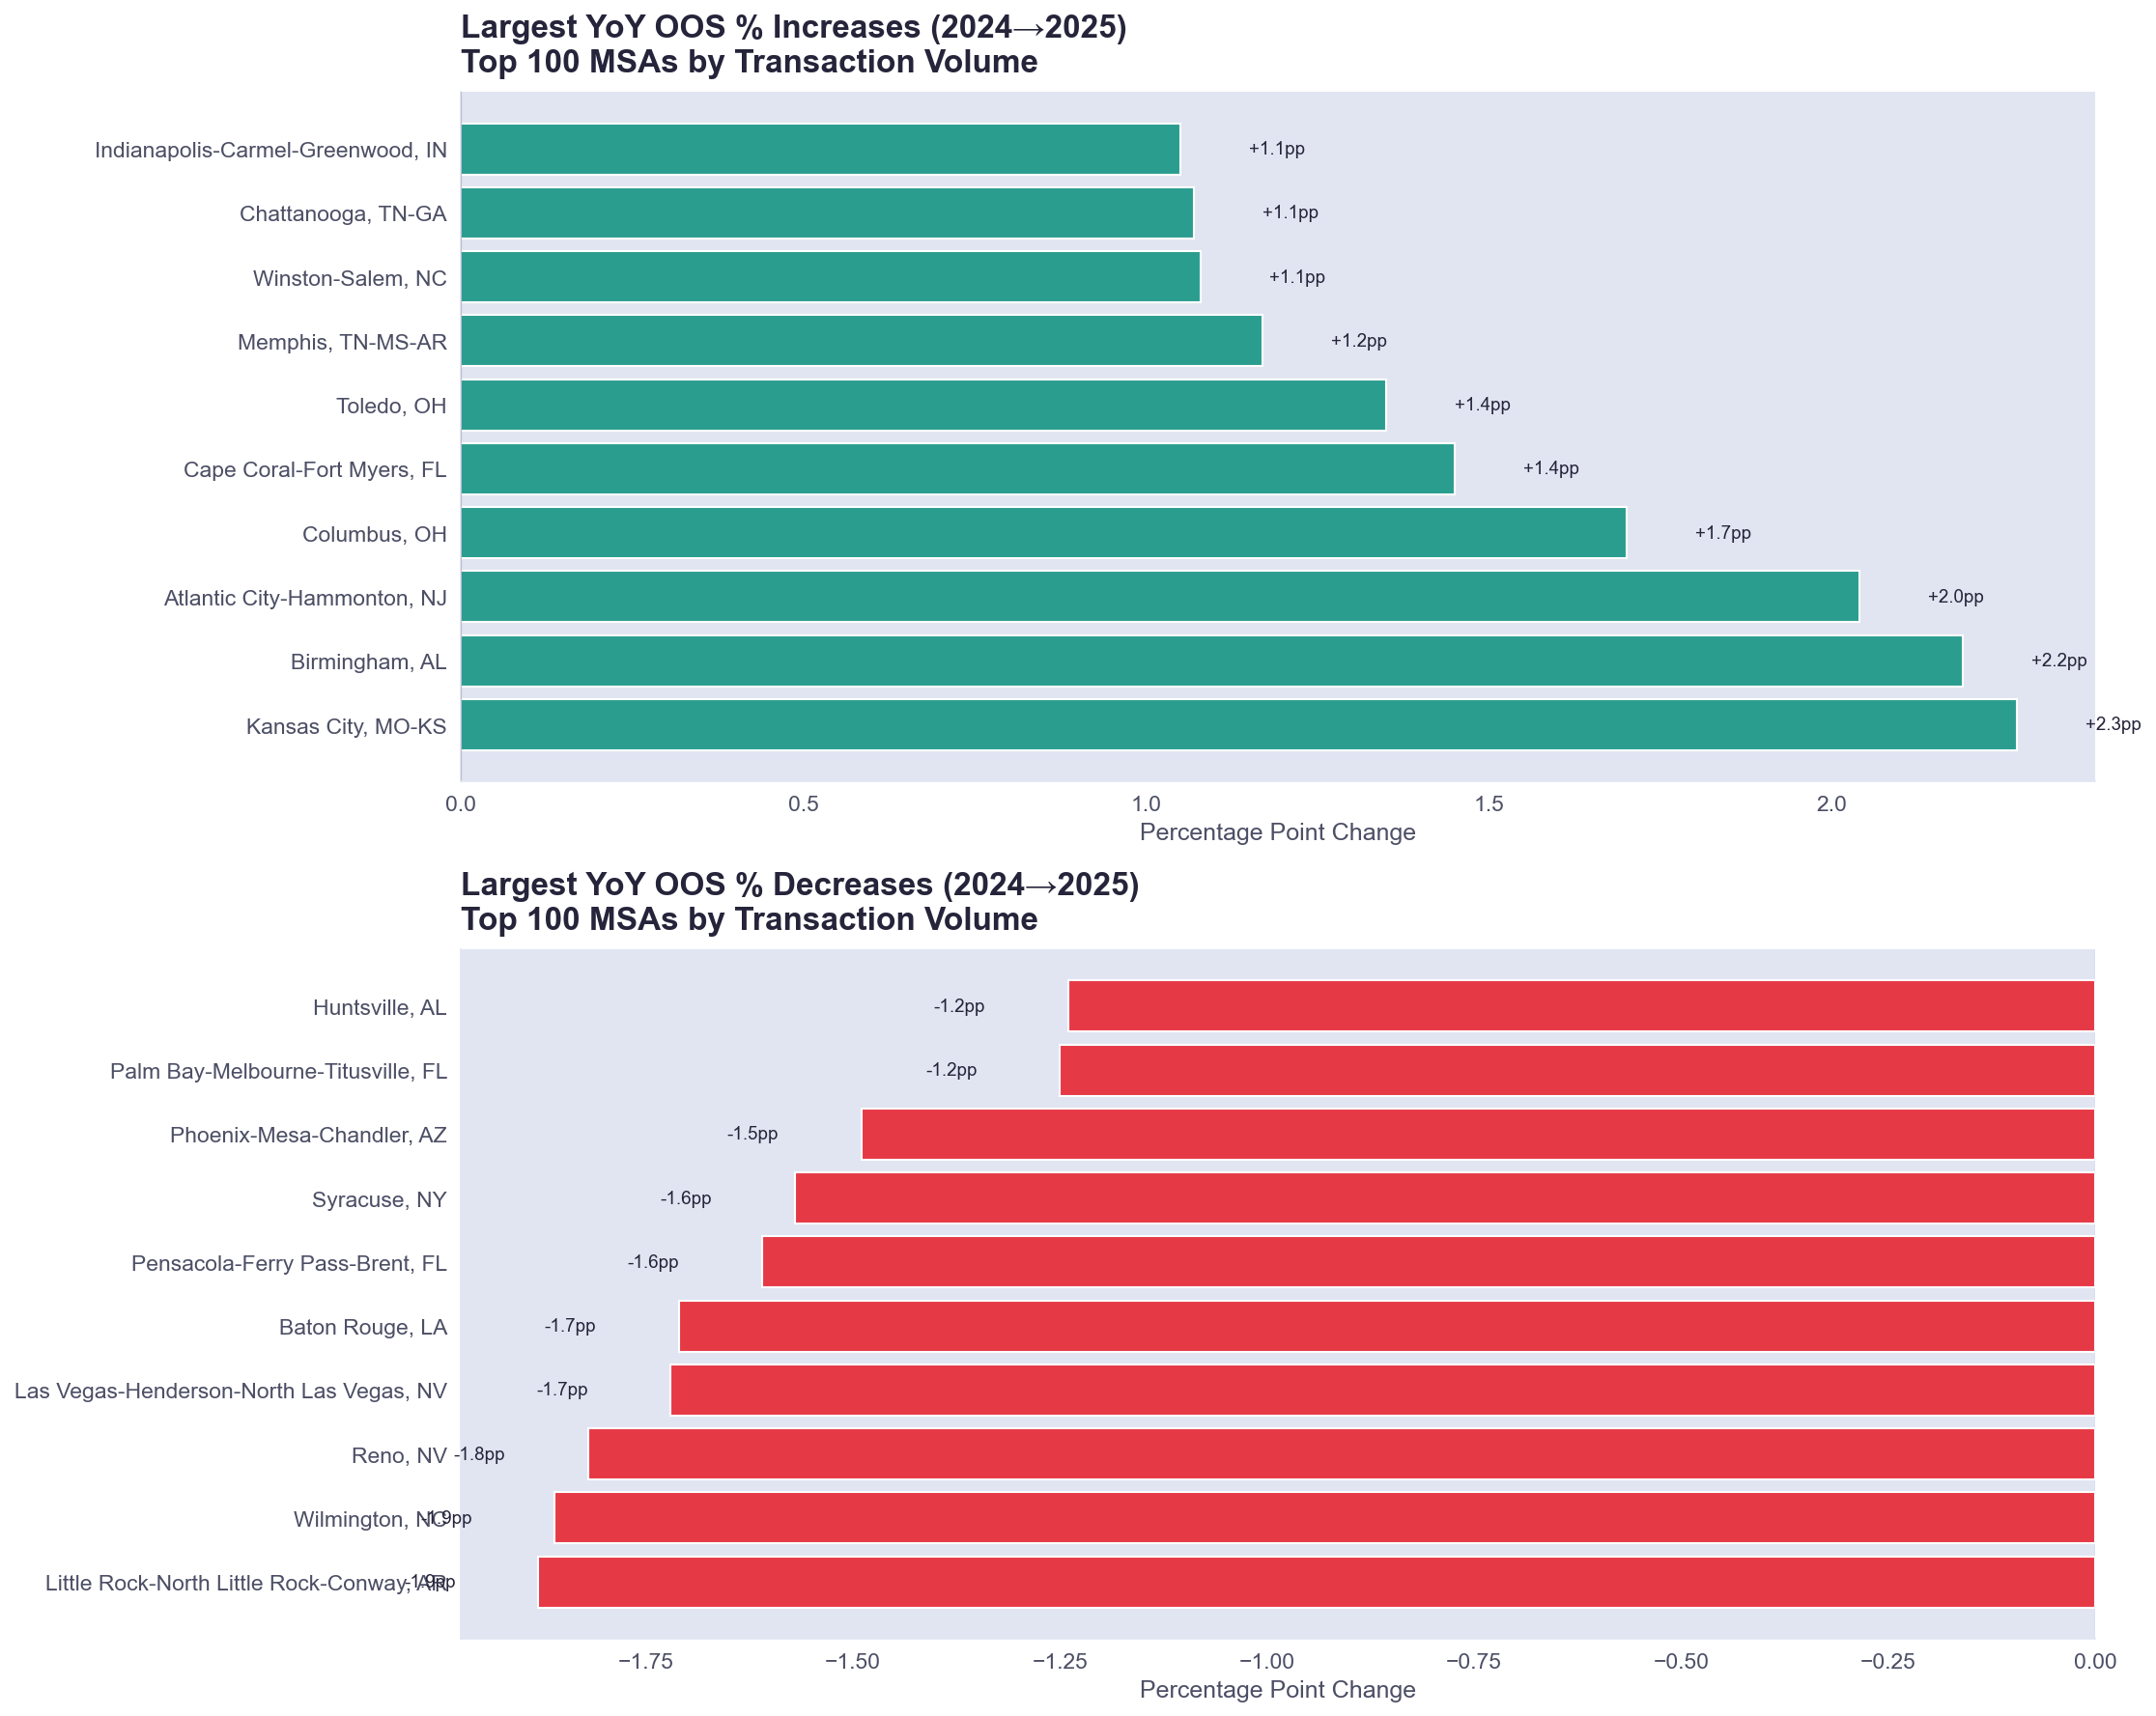
Year-over-Year Changes (2024 vs 2025)
Among the top 100 metros by transaction volume, we observed notable shifts:
Largest OOS Increases:
Birmingham, AL: +2.68pp (8.62% → 11.30%)
Indianapolis, IN: +1.95pp (4.94% → 6.89%)
Columbus, OH: +1.63pp (12.91% → 14.54%)
Toledo, OH: +1.56pp (9.36% → 10.92%)
Largest OOS Decreases:
Baton Rouge, LA: -4.36pp (5.56% → 1.20%)
Gulfport-Biloxi, MS: -2.23pp (13.31% → 11.08%)
Little Rock, AR: -1.90pp (10.30% → 8.40%)
Wilmington, NC: -1.86pp (11.17% → 9.31%)
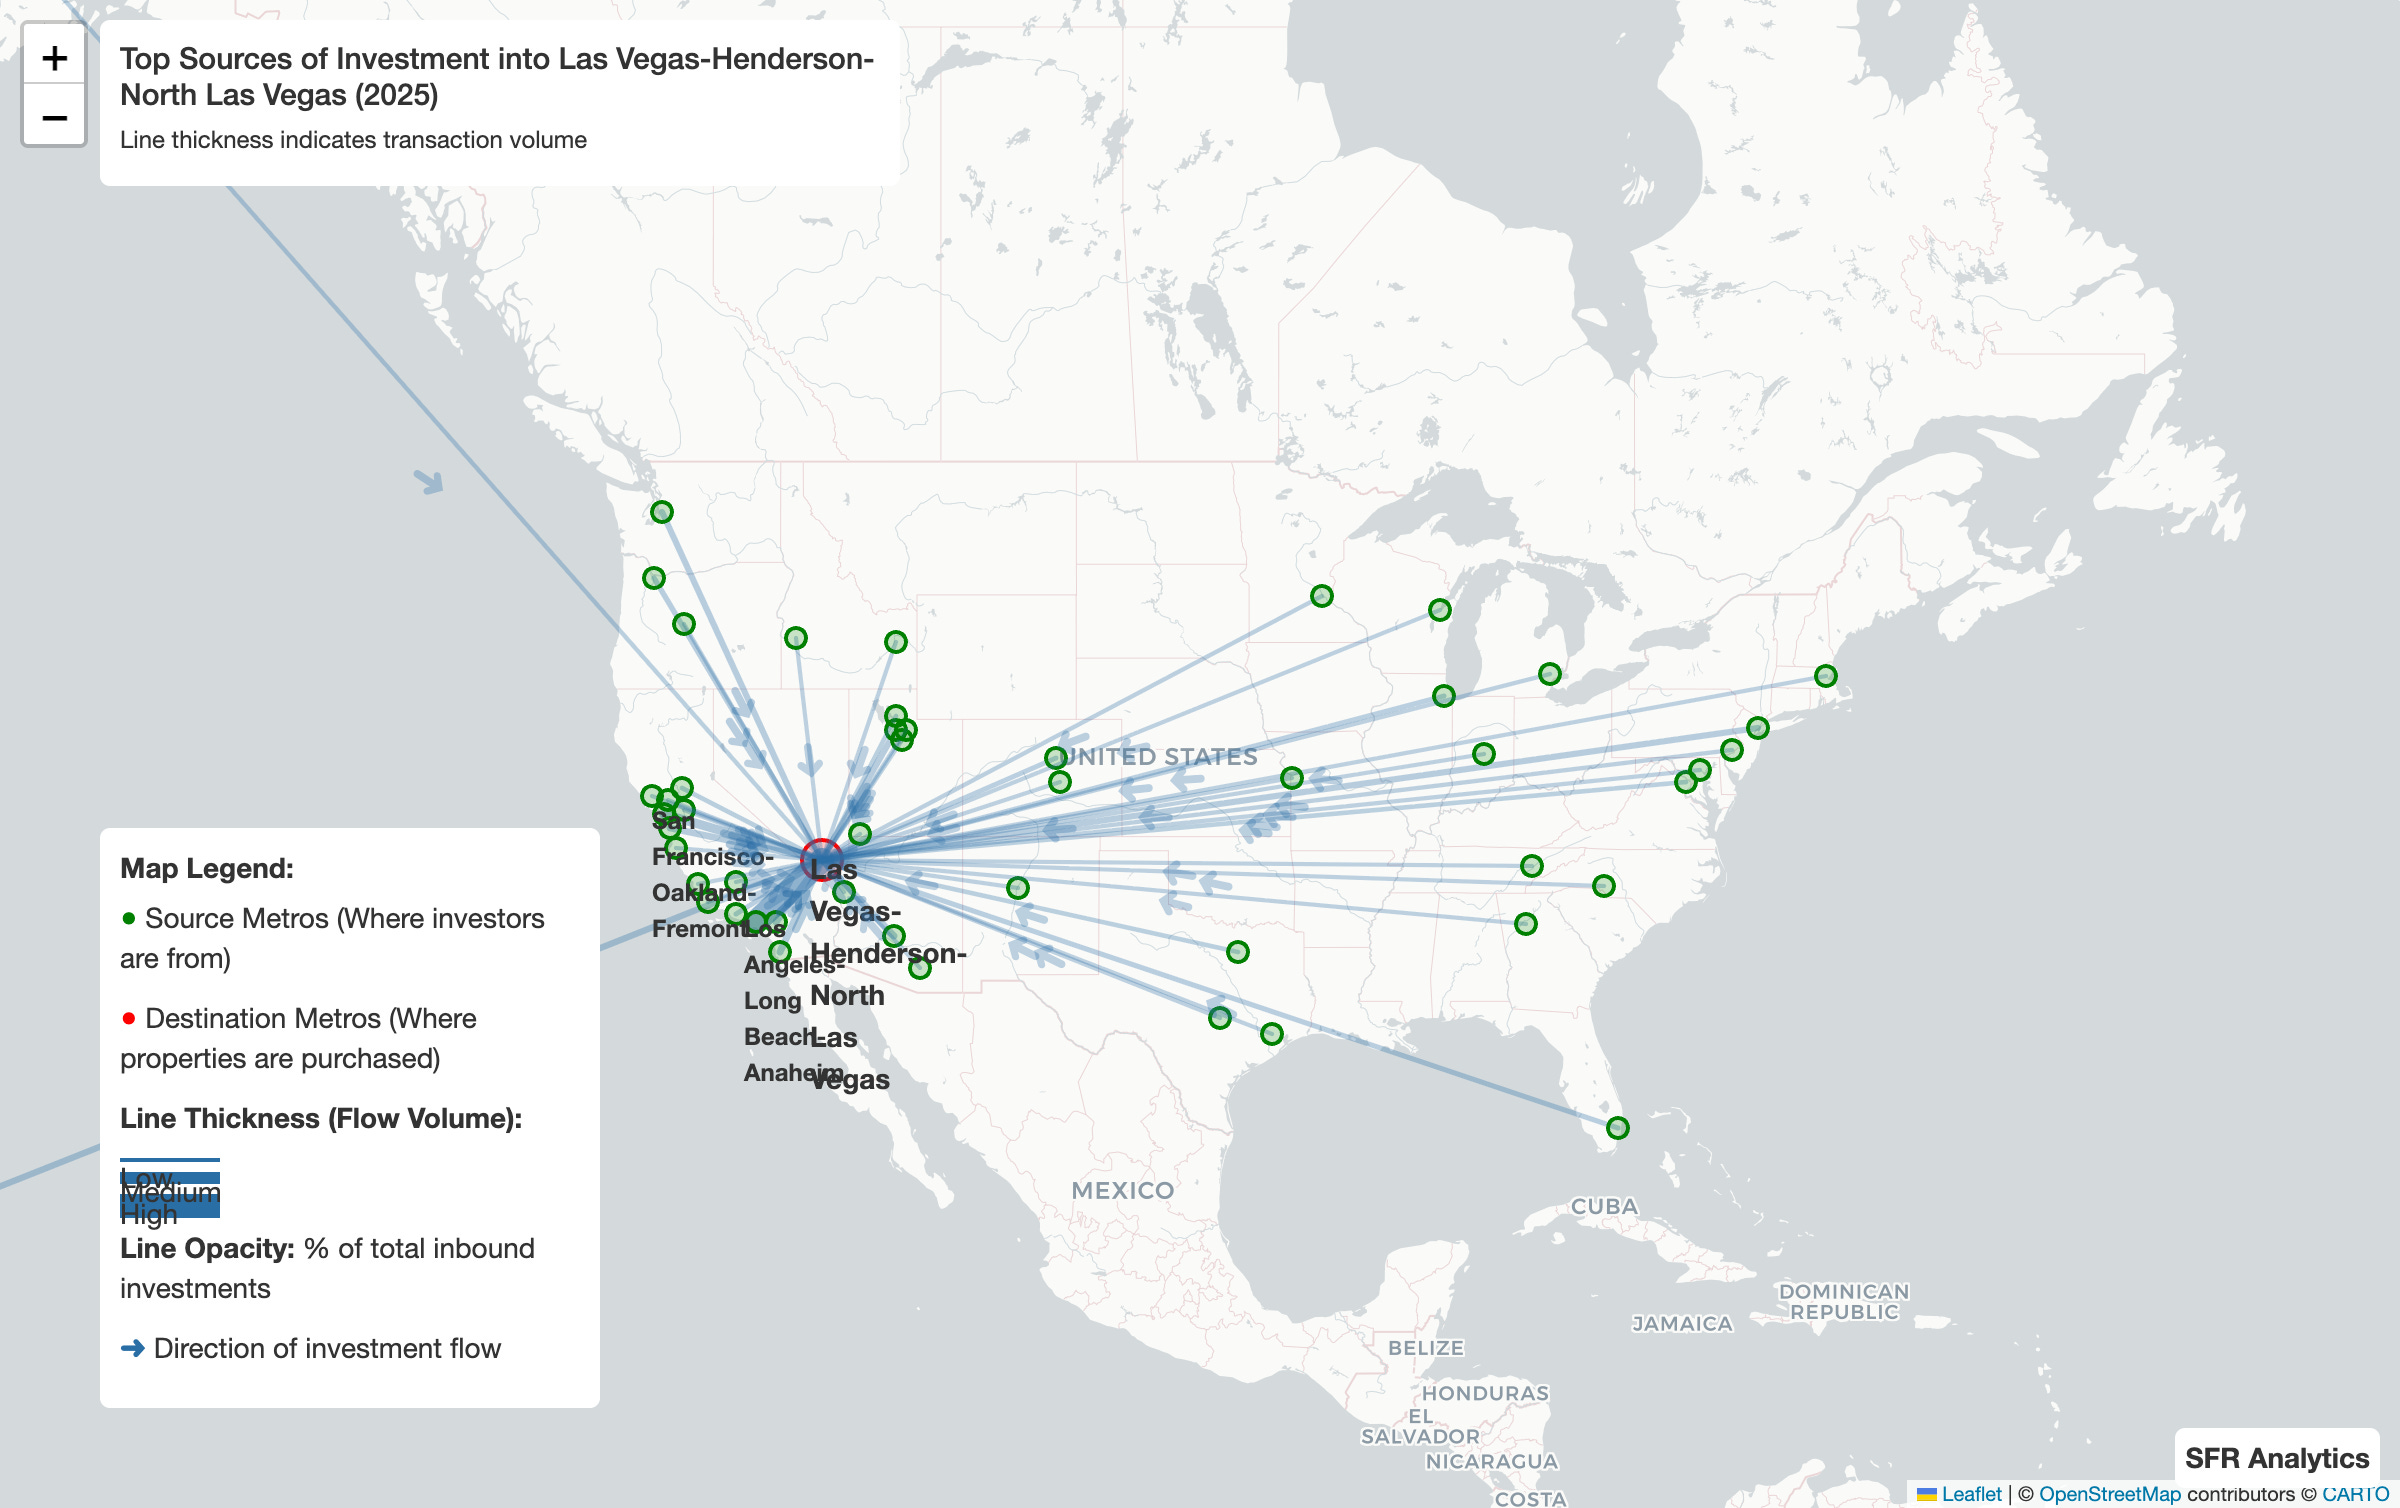
Las Vegas, NV: -1.76pp (13.26% → 11.50%)
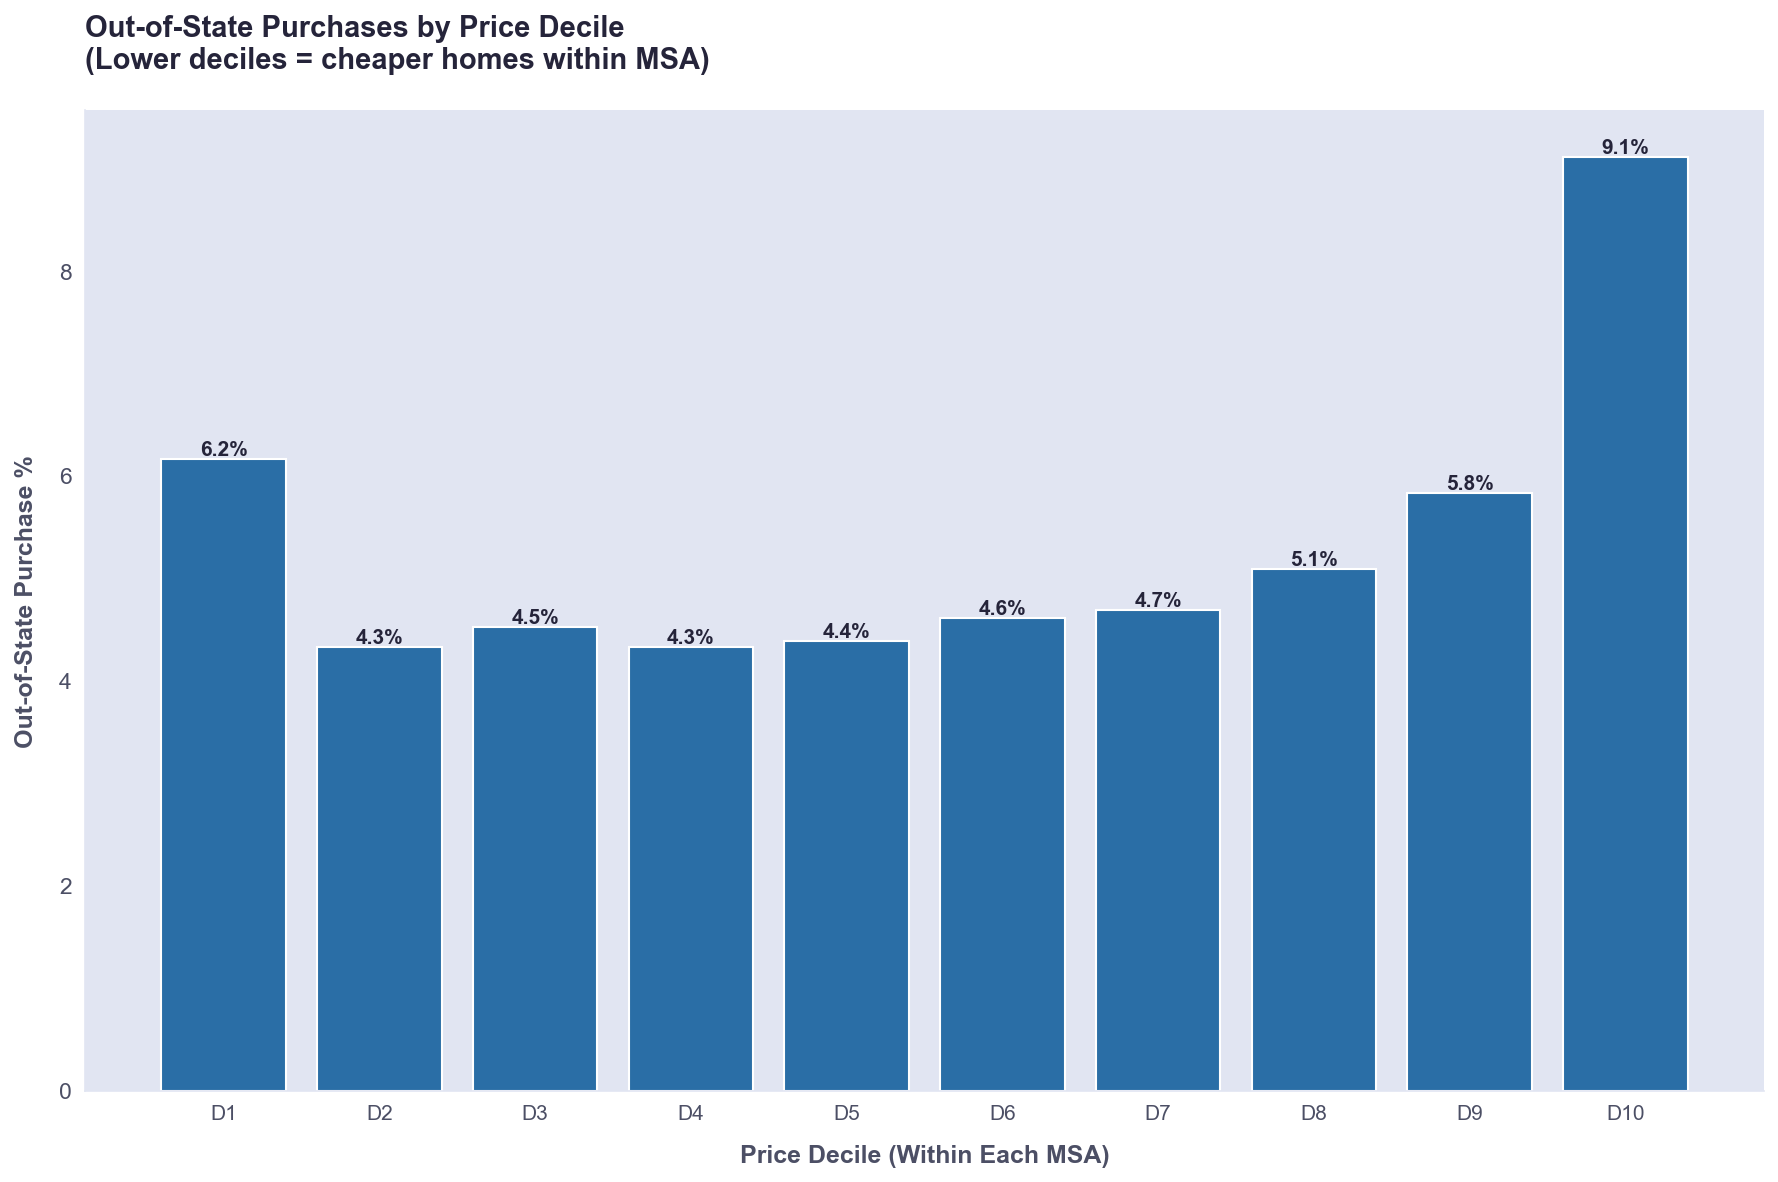
Price Segment Analysis
Out-of-state investment varies significantly by property price point:
Bottom decile (D1): 6.16% OOS rate (avg price $381K) - affordable housing attracting rental investors
Middle deciles (D4-D7): 4.3-4.7% OOS rate - lowest non-local activity
Top decile (D10): 9.11% OOS rate (avg price $1.33M) - luxury/vacation property segment
This U-shaped pattern indicates non-local investors concentrate in both affordable rental housing and high-end vacation/investment properties.
Out-of-State Buyer Demographics
Our analysis categorizes out-of-state buyers based on transaction patterns and entity structures:
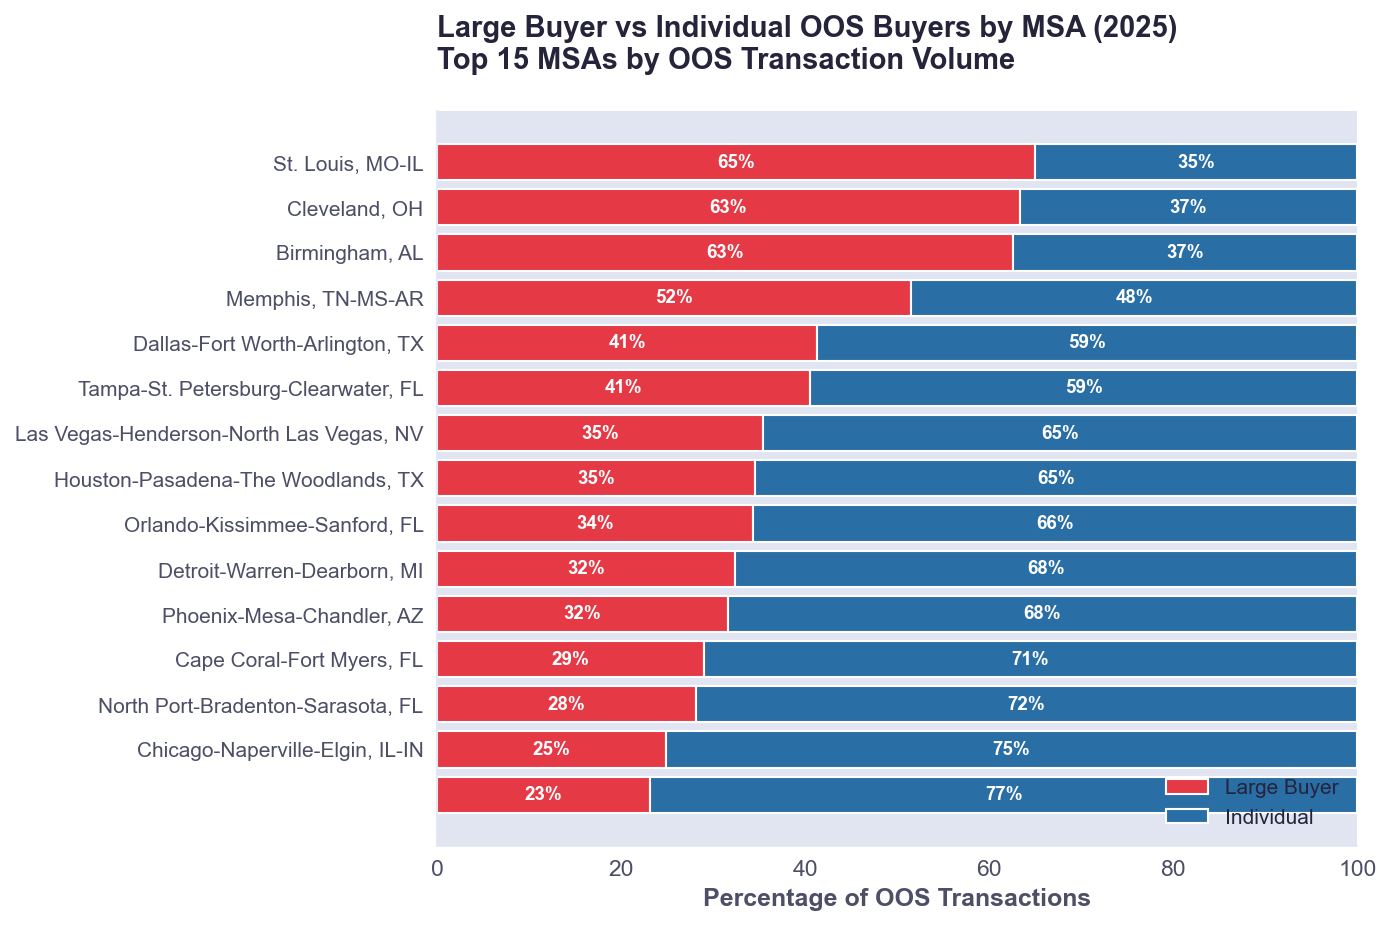
Large Investor vs Individual Investors
Across all metros, we identify buyers as "large investor" when they complete 10+ purchases annually, versus individual investors with fewer transactions.
Markets with Highest Large Investor Concentration:
Fayetteville, NC: 79.4% large investor (204 of 257 OOS transactions)
Trenton-Princeton, NJ: 79.1% large investor (72 of 91 OOS transactions)
St. Louis, MO-IL: 72.2% large investor (1,396 of 1,934 OOS transactions)
Peoria, IL: 71.3% large investor (280 of 393 OOS transactions)
Markets with Most Diversified Buyer Base (Individual-Dominated):
Manchester-Nashua, NH: 3.2% large investor (mostly individual buyers)
Laconia, NH: 3.6% large investor
Las Cruces, NM: 4.8% large investor
Bangor, ME: 5.3% large investor
Augusta-Waterville, ME: 5.5% large investor
Buyer Segment Categories
Large Investors: Approximately 30-35% of OOS transactions nationally are conducted by entities with 10+ annual purchases. These are concentrated in Sun Belt rental markets and Midwest value plays.
Small Portfolio Investors: Individual investors expanding rental portfolios represent 40-45% of activity, particularly strong in affordable markets with favorable rent-to-price ratios.
Vacation/Second Home Buyers: 20-25% of OOS purchases, concentrated in Florida coastal markets, mountain resort towns, and Hawaiian destinations.
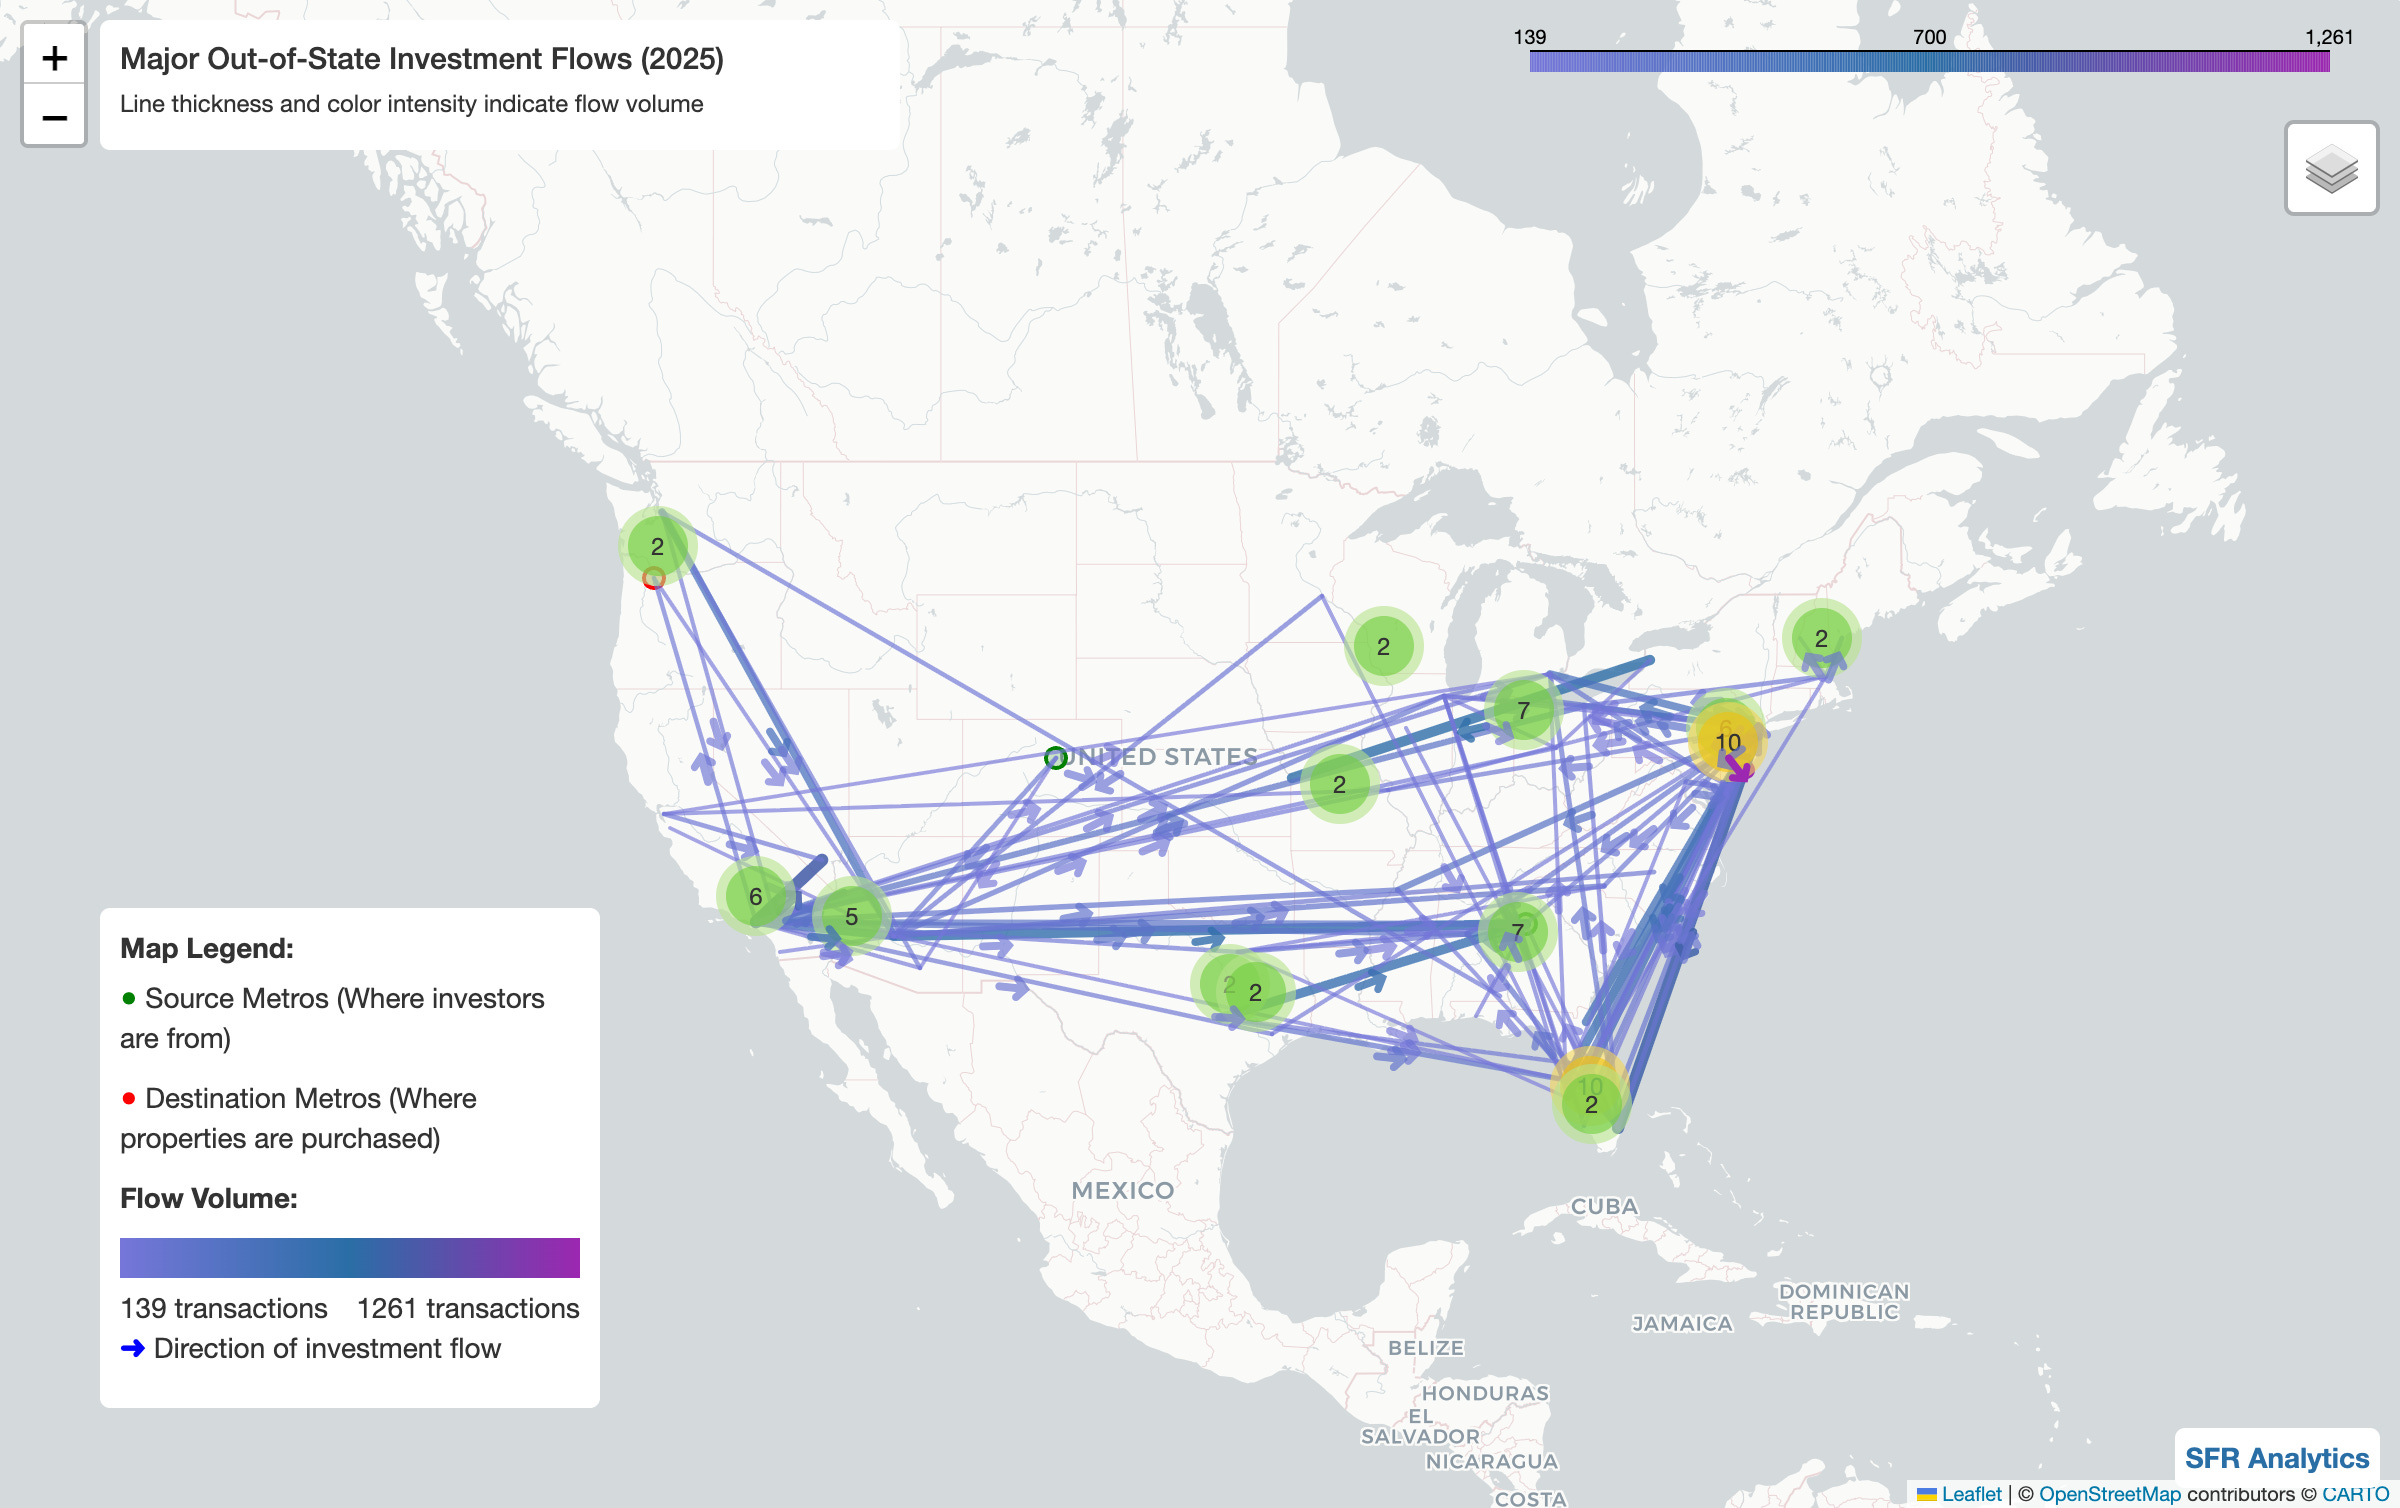
Investment Flow Analysis
Our analysis tracks the geographic sources and destinations of out-of-state investment capital, revealing distinct patterns in where investors are buying and where they're coming from.
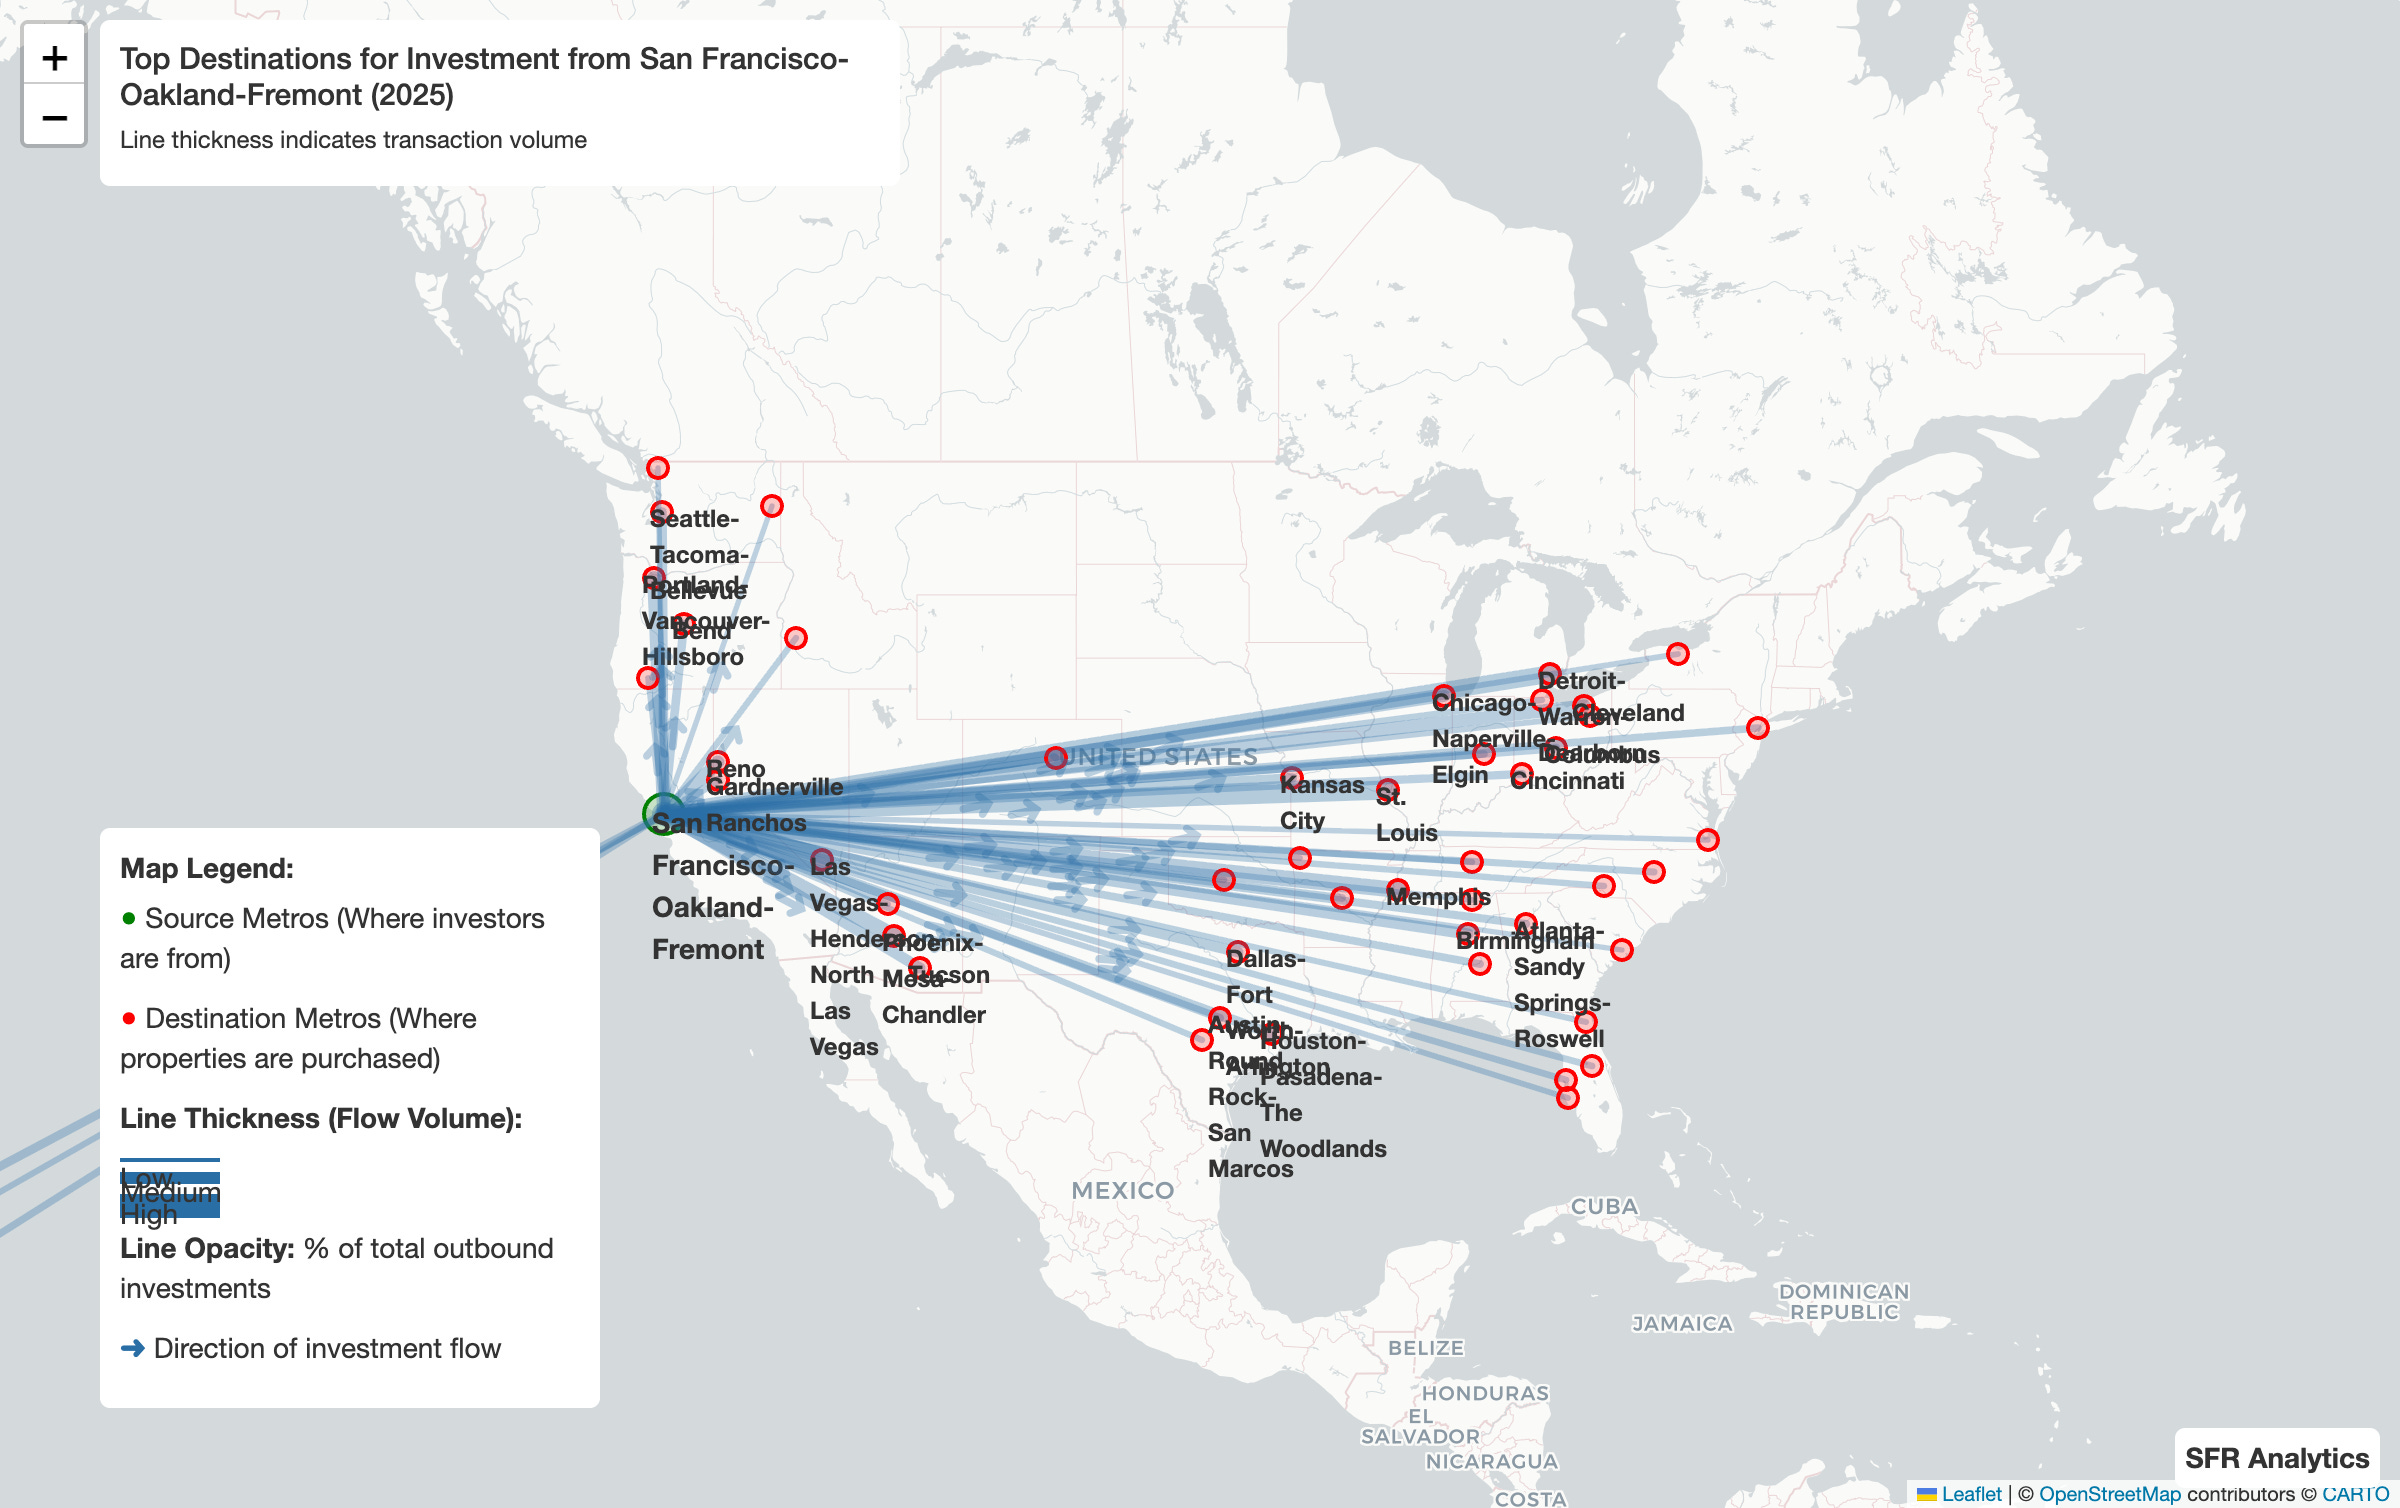
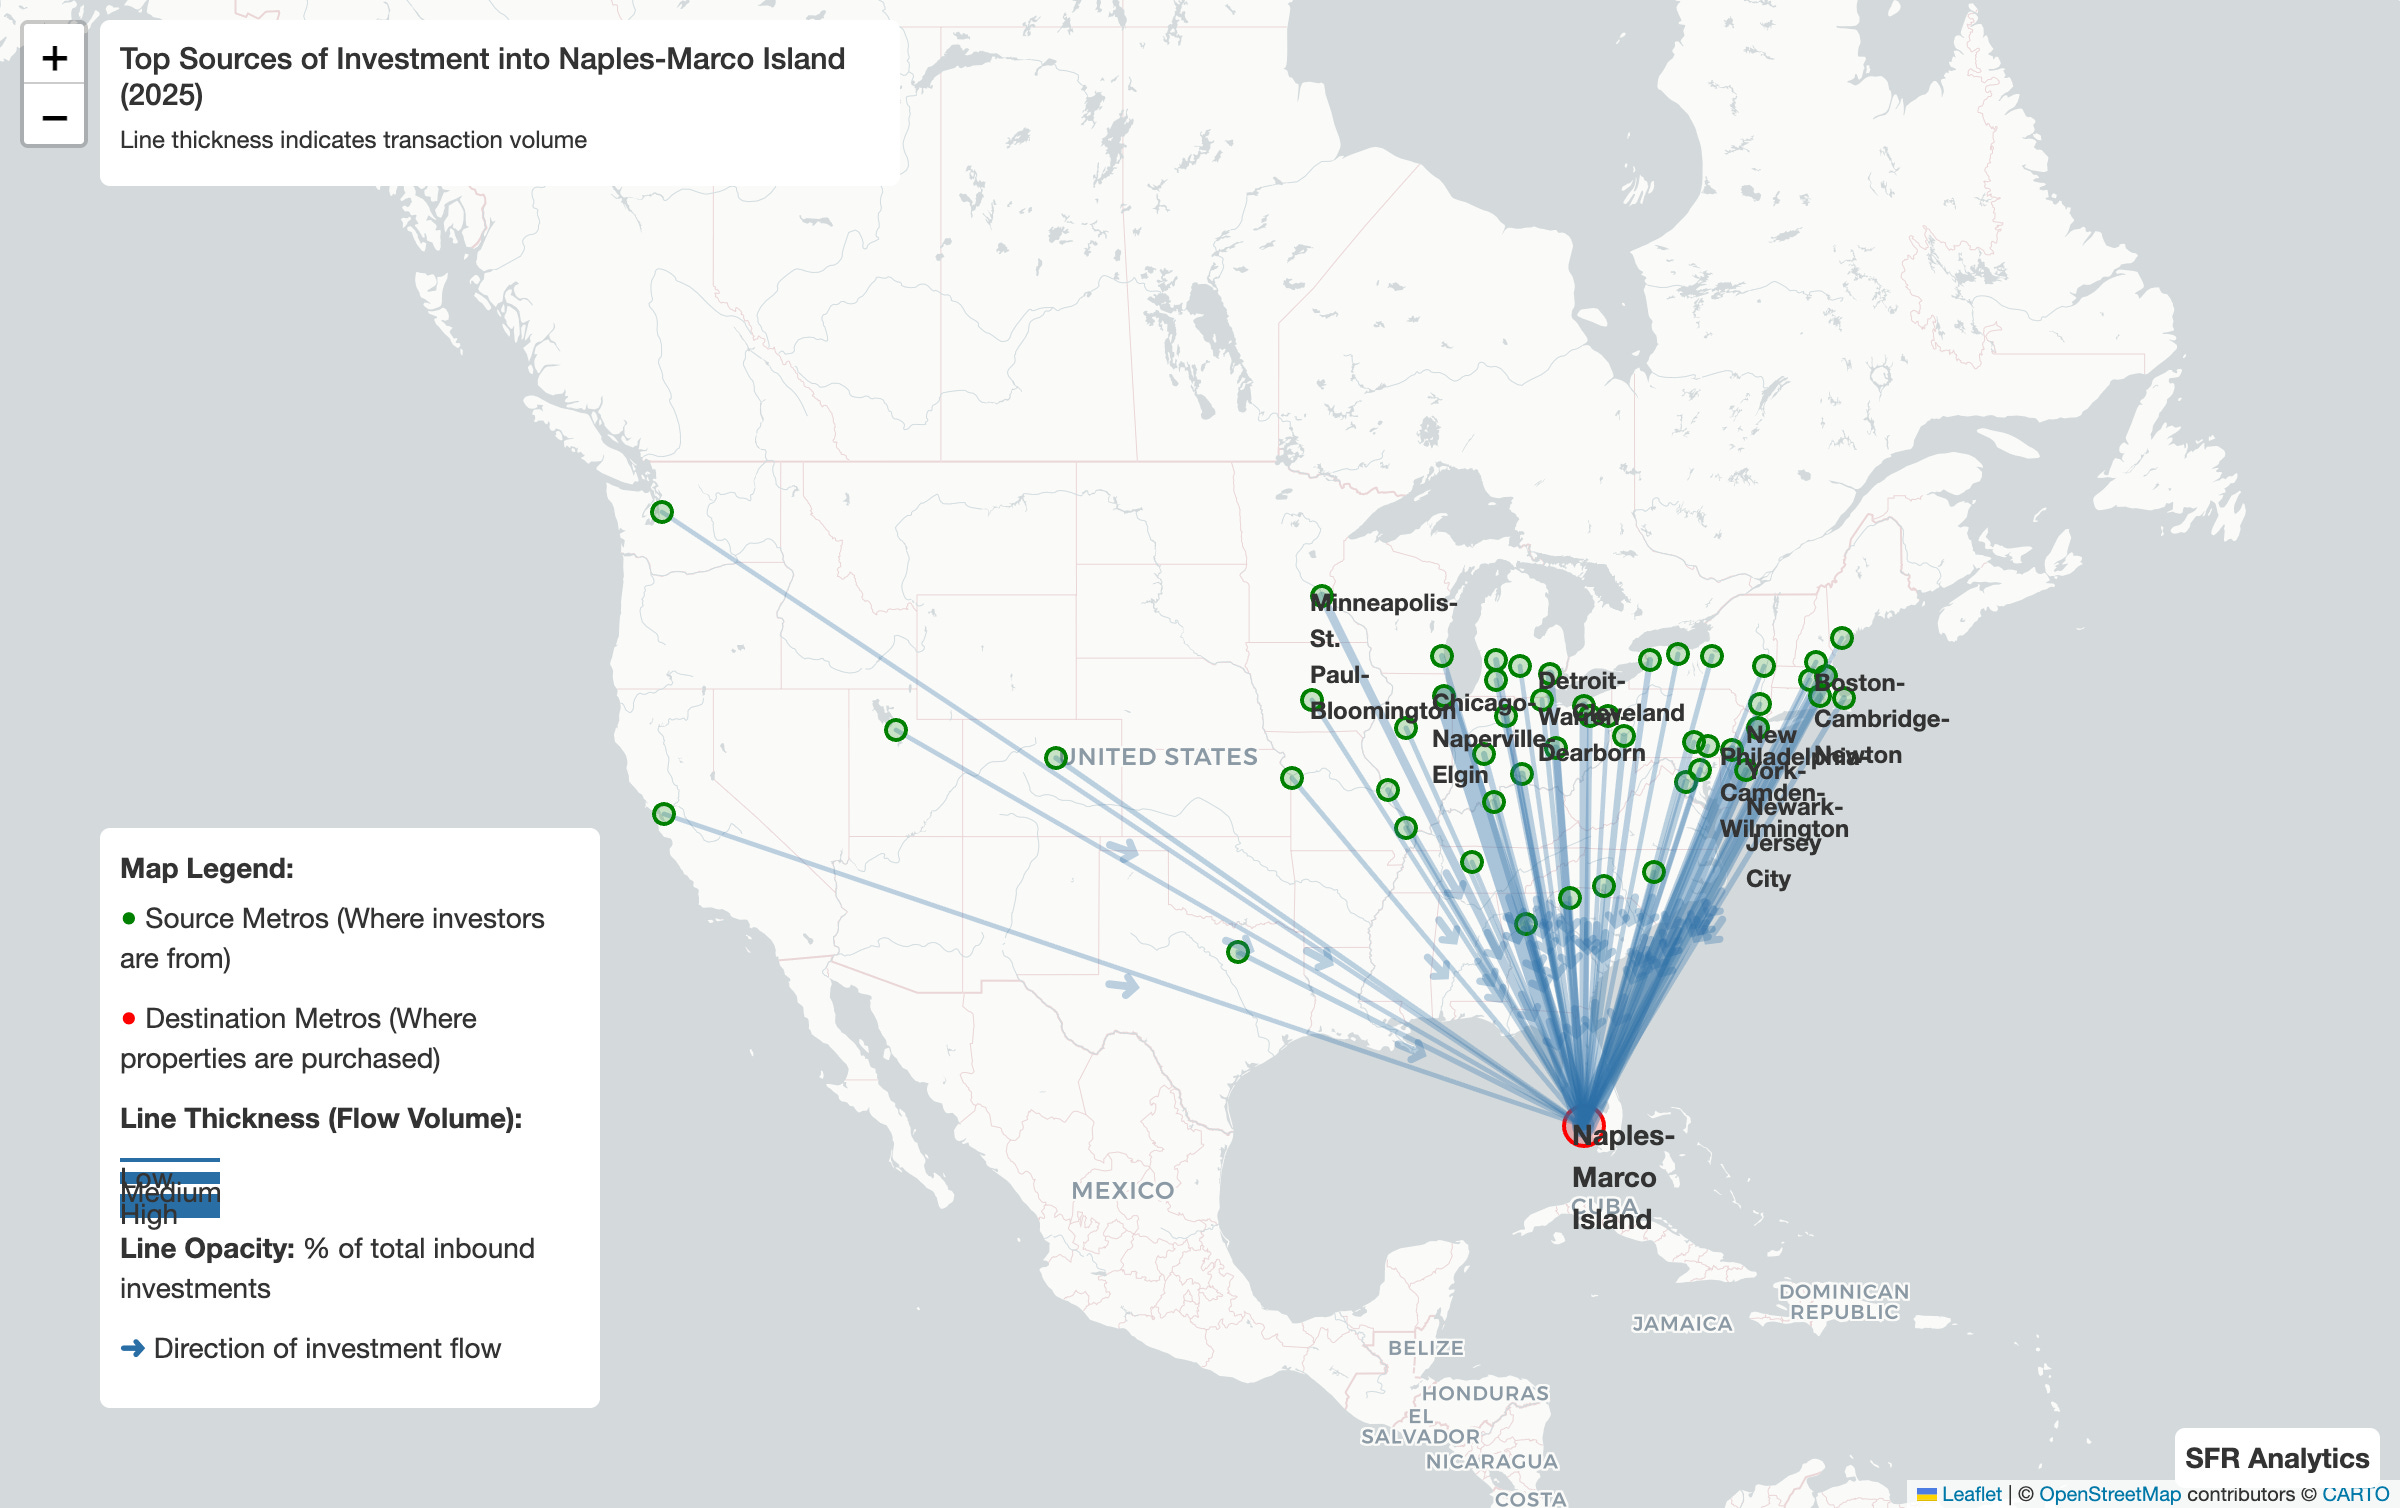
Source State Diversification
Investment sources into major markets show significant geographic diversification:
Florida markets draw from 45-50 unique source states, with no single state representing more than 10% of inbound OOS investment
Phoenix-Mesa-Chandler, AZ receives capital from all 50 states, reflecting its appeal as both a rental investment and retirement destination
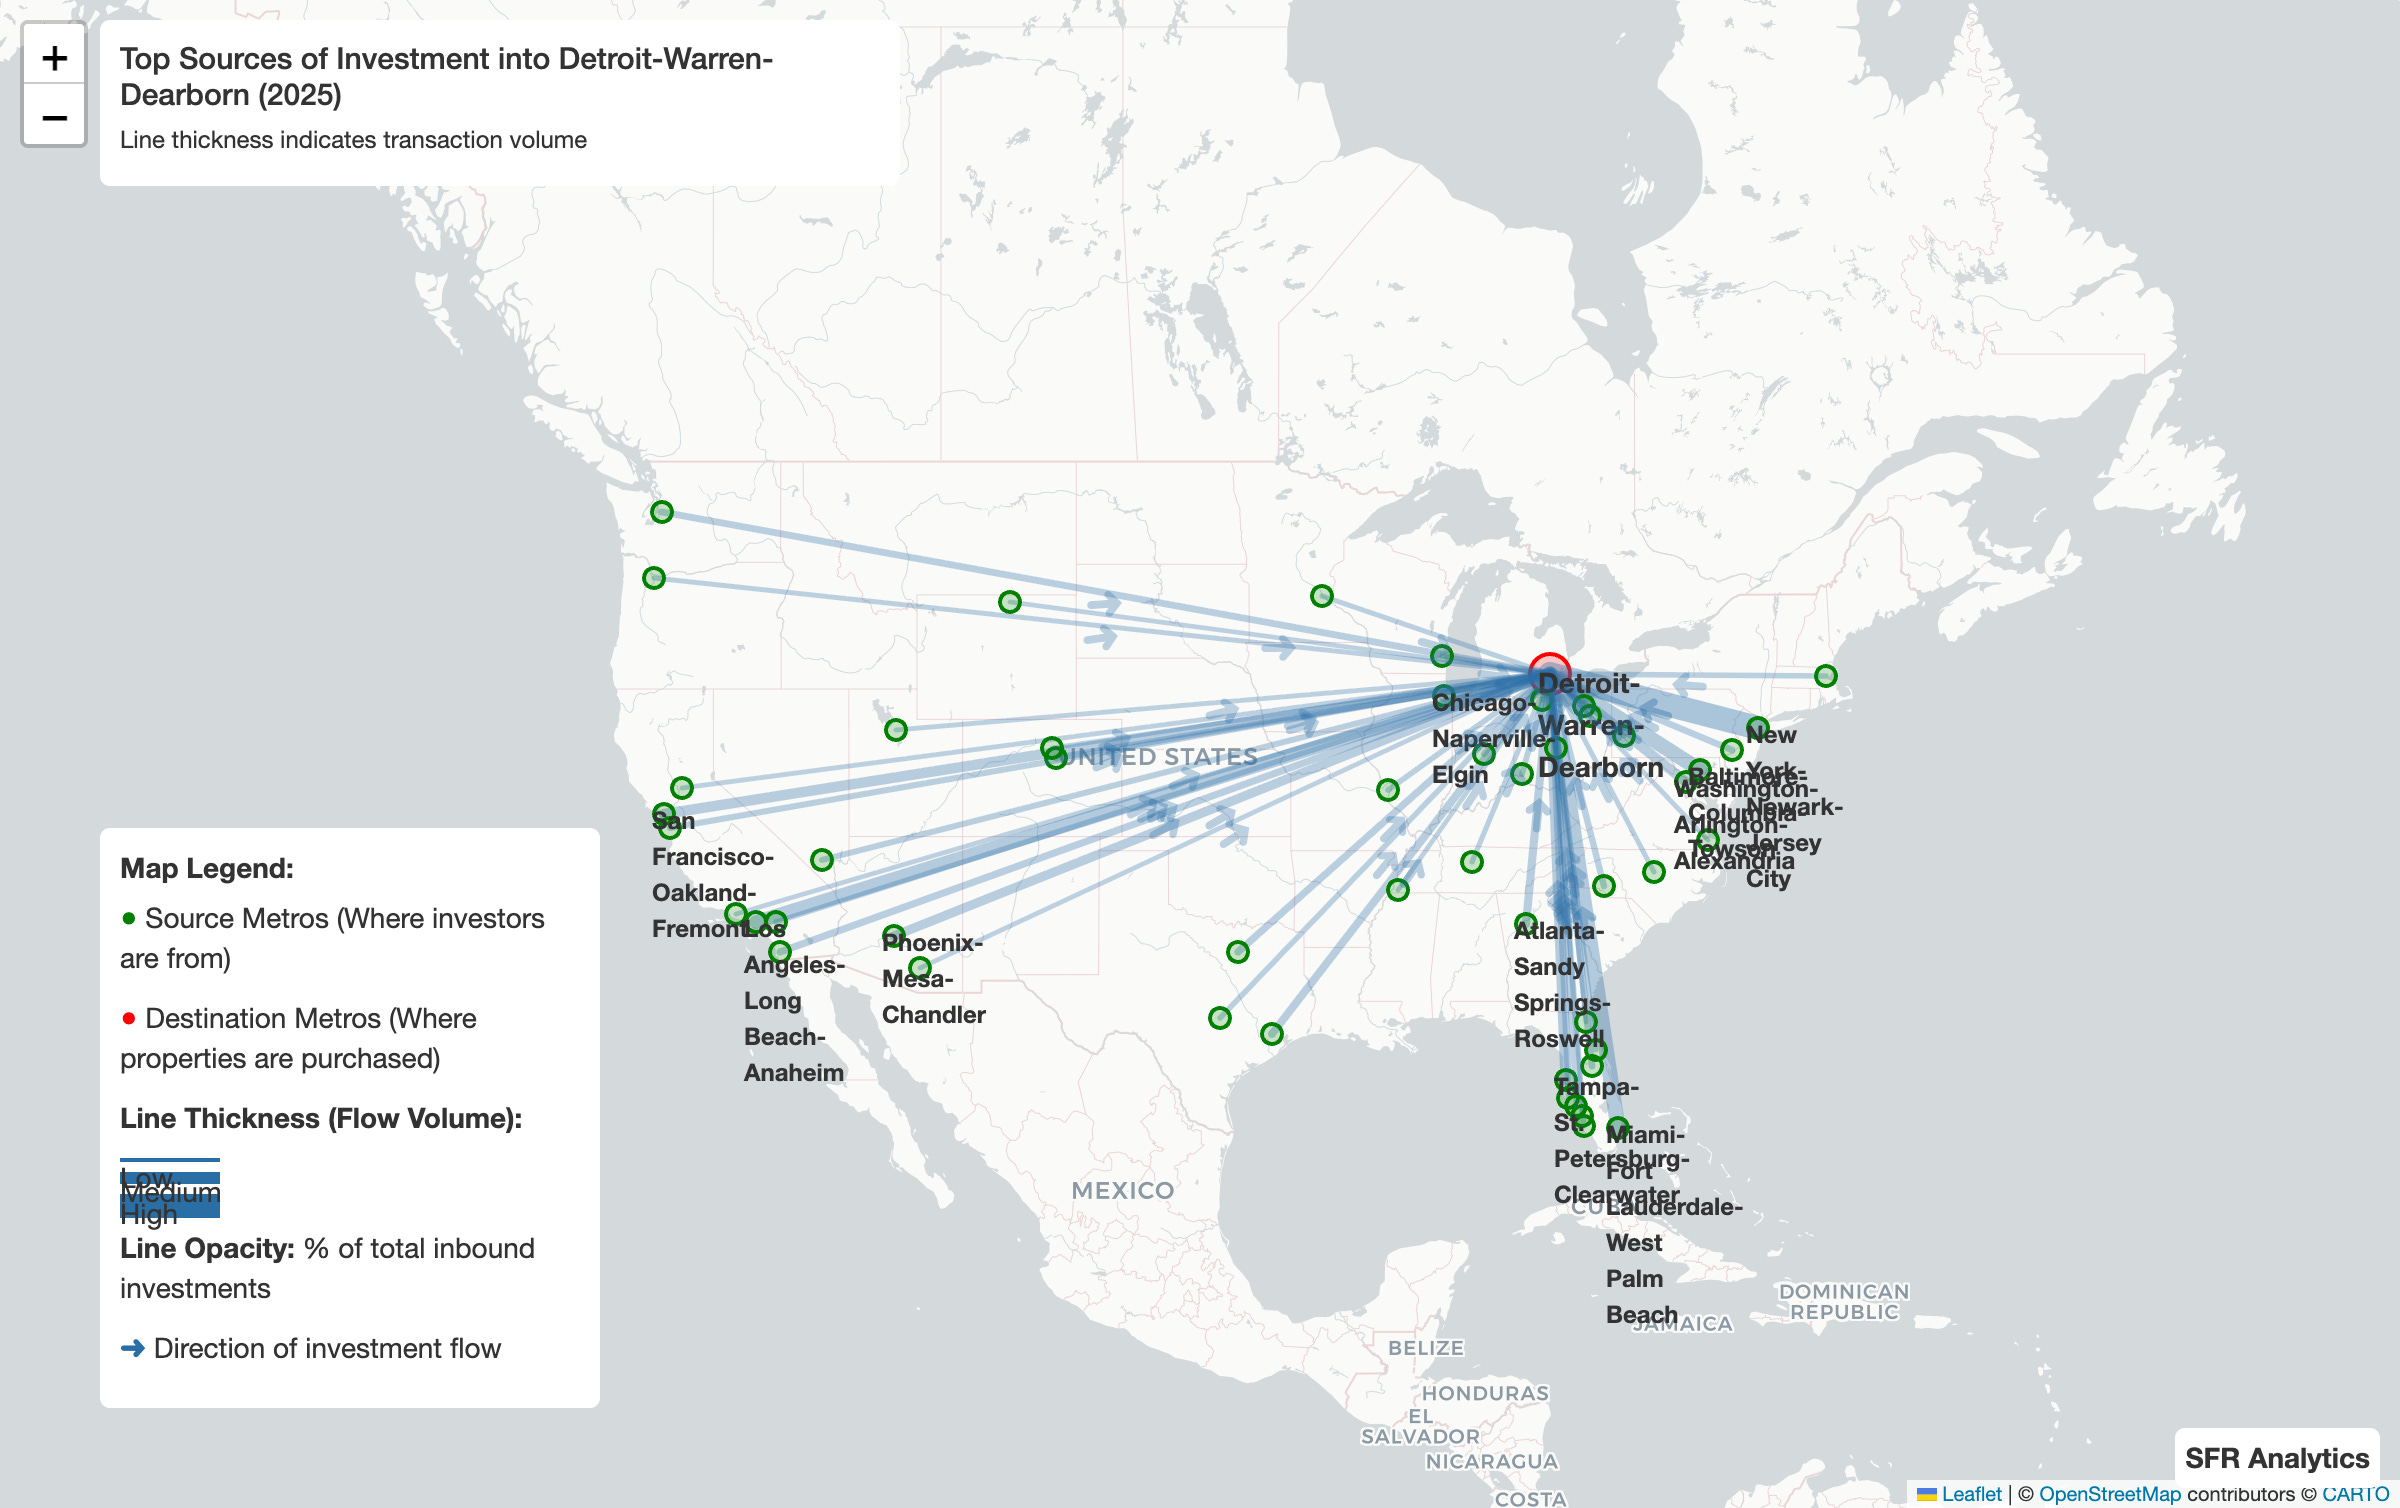
Midwest markets (Detroit, Cleveland, St. Louis) attract large investor capital from coastal states seeking higher yields
Notable Inbound Investment Patterns
Top destination markets for out-of-state capital in 2025:
Phoenix-Mesa-Chandler, AZ: 5,465 OOS transactions (10.7% OOS rate) - down from 2024 highs as market cooling continues
Detroit-Warren-Dearborn, MI: 3,084 OOS transactions - Midwest value play attracting large investor buyers
Birmingham, AL: 2,711 OOS transactions (+2.68pp YoY) - strong large investor presence
Tampa-St. Petersburg-Clearwater, FL: 2,857 OOS transactions - continued Florida market appeal
North Port-Bradenton-Sarasota, FL: 2,675 OOS transactions (20.1% OOS rate) - highest large-metro OOS concentration
Notable Outbound Investment Patterns
Key observations on investor origin patterns:
California investors continue expanding into Nevada, Arizona, and Texas markets seeking better yields and favorable landlord laws
New York/New Jersey investors target Florida coastal markets and Sun Belt metros for vacation and rental properties
Texas-based investors increasingly active in neighboring states as home market becomes more competitive
Midwest large investor buyers (Ohio, Illinois-based) expanding portfolios into affordable rental markets across the region
Conclusion
The 2025 out-of-state investor landscape shows continued normalization from COVID-era peaks:
National Rate: 5.56% OOS rate represents a return toward pre-pandemic levels (5.8% in 2019), down from the 7.29% peak in 2021
Geographic Shifts: Significant YoY increases in Birmingham, Indianapolis, and Columbus suggest large investor capital is pivoting to markets with stronger rent growth potential and less competition
Cooling Markets: Traditional Sun Belt hotspots (Las Vegas, Phoenix) showing reduced OOS activity as pricing pressure eases
Large Investor Concentration: Markets like Fayetteville, NC (79.4%) and St. Louis (72.2%) show high large investor presence, while vacation markets remain individual-buyer dominated
Price Segmentation: U-shaped pattern persists with highest OOS activity in bottom (affordable rentals) and top (luxury/vacation) price deciles
The persistence of elevated non-local investment, even as rates normalize, suggests a lasting structural shift in single-family residential markets. Out-of-state investors—both large investor and individual—have established durable positions in key metros, fundamentally reshaping the ownership landscape of American housing.
Data sources: Public deed records, 2019-2025. Analysis by SFR Analytics.