

2025 Home Flipping Report
Gross Margins Trending Strong, Volumes Declining But Not Significantly
We analyzed the ~245,000 homes flipped in 2025: properties bought specifically to renovate and resell, excluding wholesaler pass-throughs, iBuyer transactions, and other incidental resales.
Executive Summary
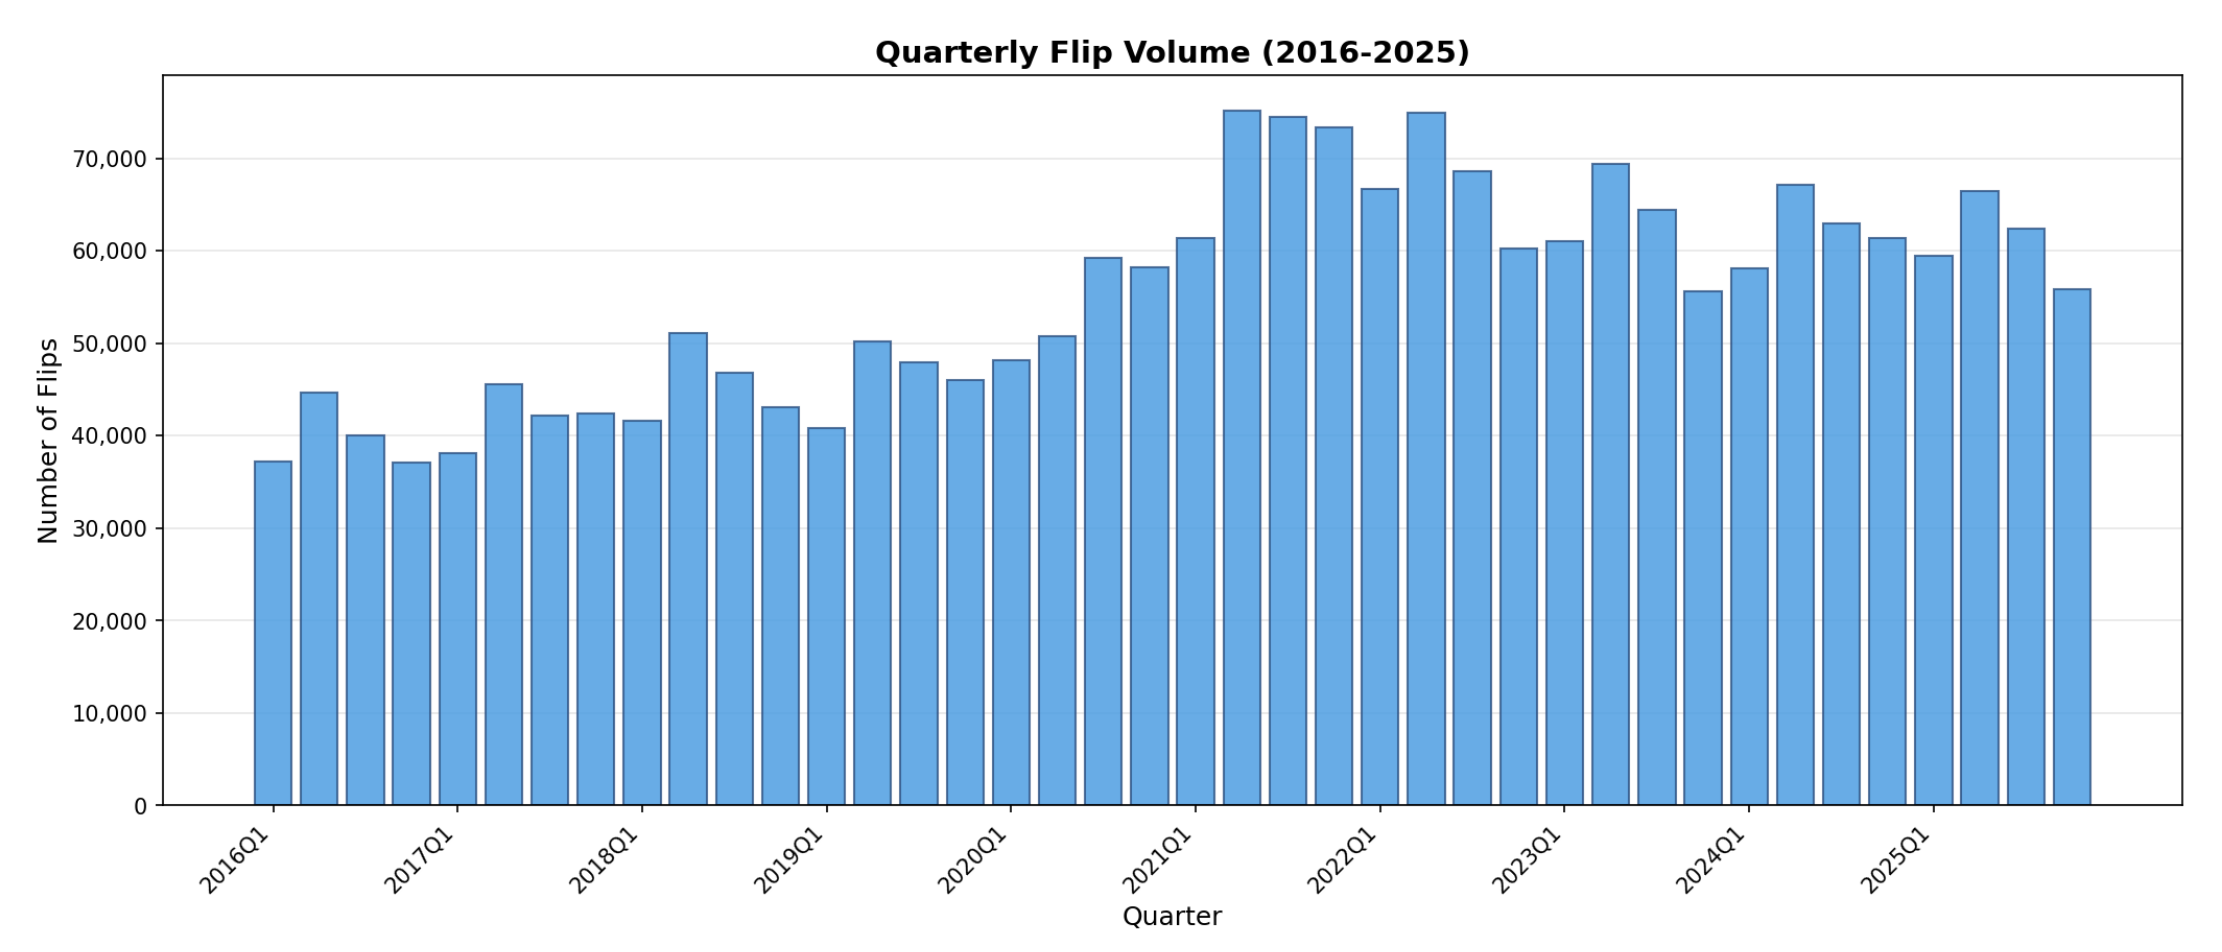
Flip volumes are flat year-over-year. While down ~15% from the 2021 peak, they remain above pre-2020 levels
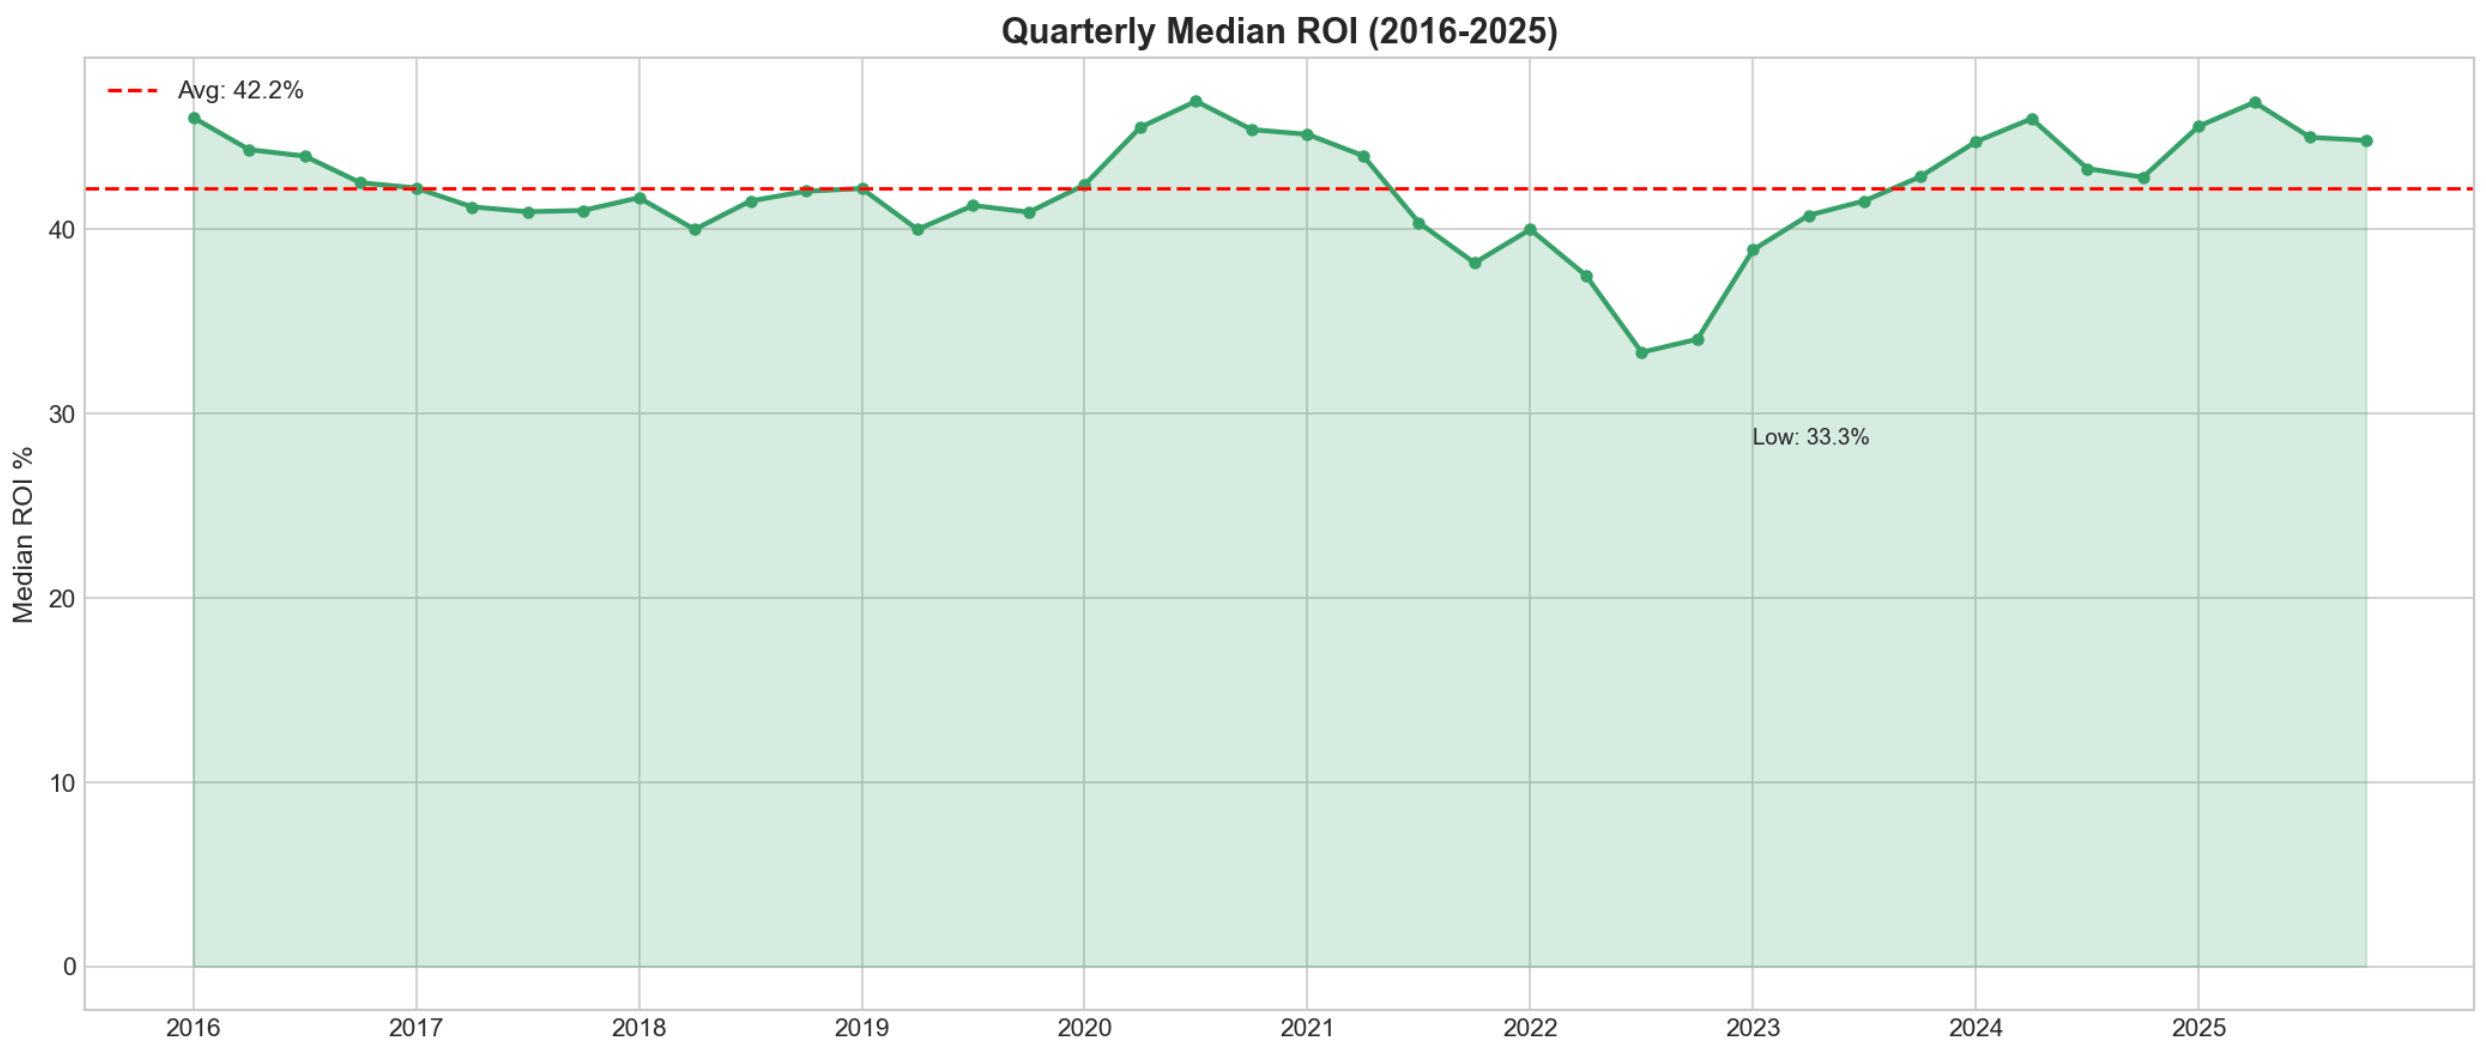
Gross margins are trending towards historic highs
The average flip was bought at the 20th percentile of local home prices and resold at the 40th percentile (normalized for MSA)
Flipping, like many aspects of real estate investing, is hyperlocal (in-depth data broken down by MSA is available in the piece)
Methodology
Starting from a foundation of aggregated nationwide deed and mortgage data, our methodology aims to identify true flips: investors who tried to generate profit on a home by buying it, improving it, and reselling it, not just a property that was bought and resold within 12 months which can include various other types of transactions. A few highlights:
We look at single-family homes and condos that had resales between 7 and 365 days apart. This eliminates double closes from wholesalers, and also excludes some of the larger flips that take >365 days to complete. False positives increase significantly beyond 365 days, mostly concentrated in a few high-cost metros.
There’s a long list of exclusions: we exclude iBuyers (not traditional flippers, they typically invest less than $10,000 in renovation), builders transferring properties between related entities, foreclosures, and other anomalous transactions.
We treat flippers who flip in their own name more strictly by excluding individuals who used conventional financing and resold within 12 months, the vast majority of which are not intentional flips.
Metro Trends
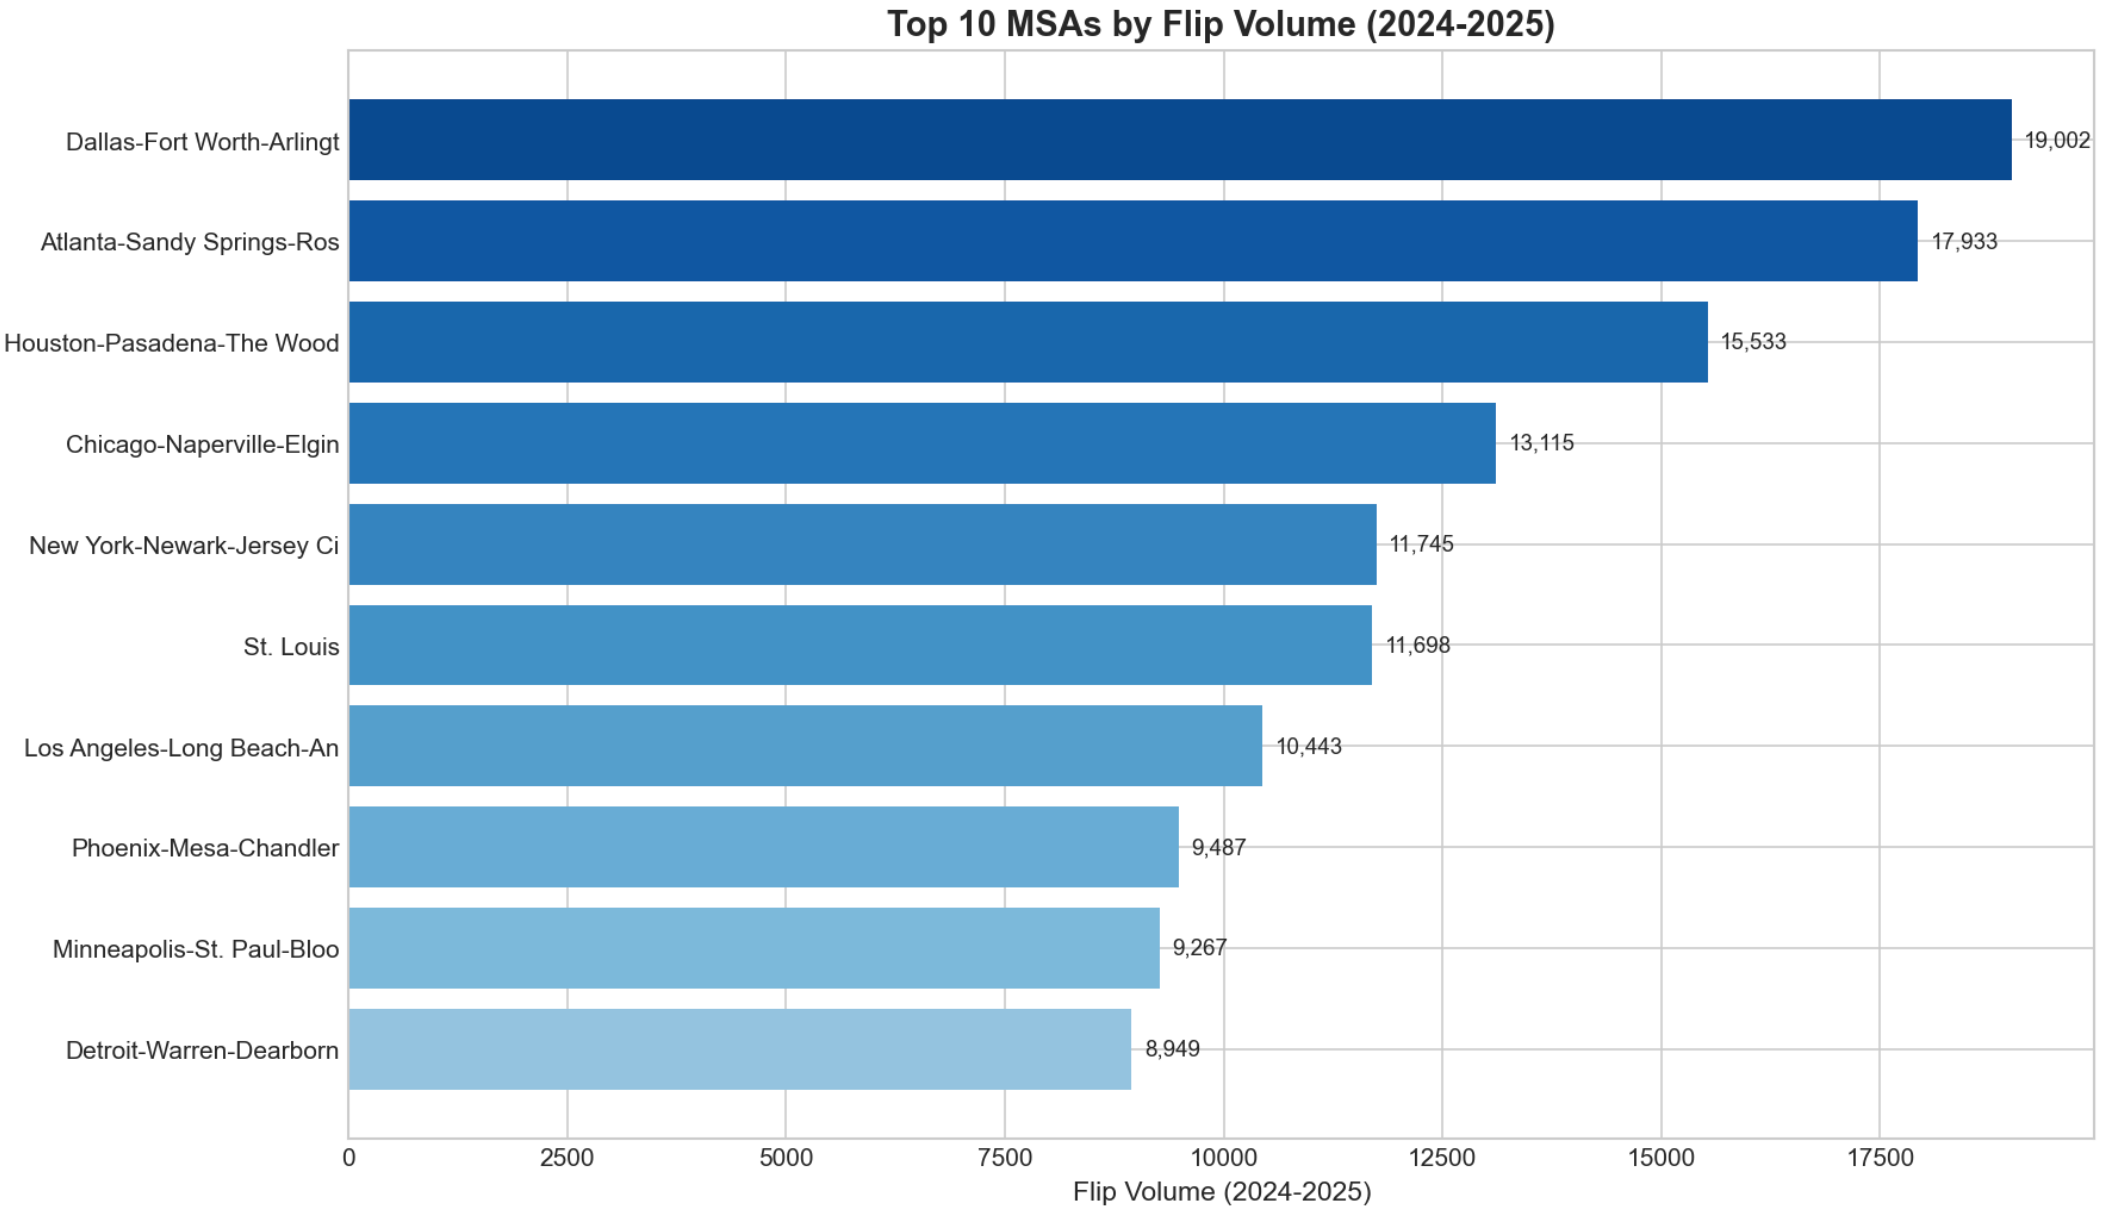
There's been considerable geographic diversity in flip activity for the past two years. While Texas has 2 of the top 3 metros, we see representation from the Southeast, Midwest, both coasts, and the Southwest among the top 10 MSAs with the most flips.
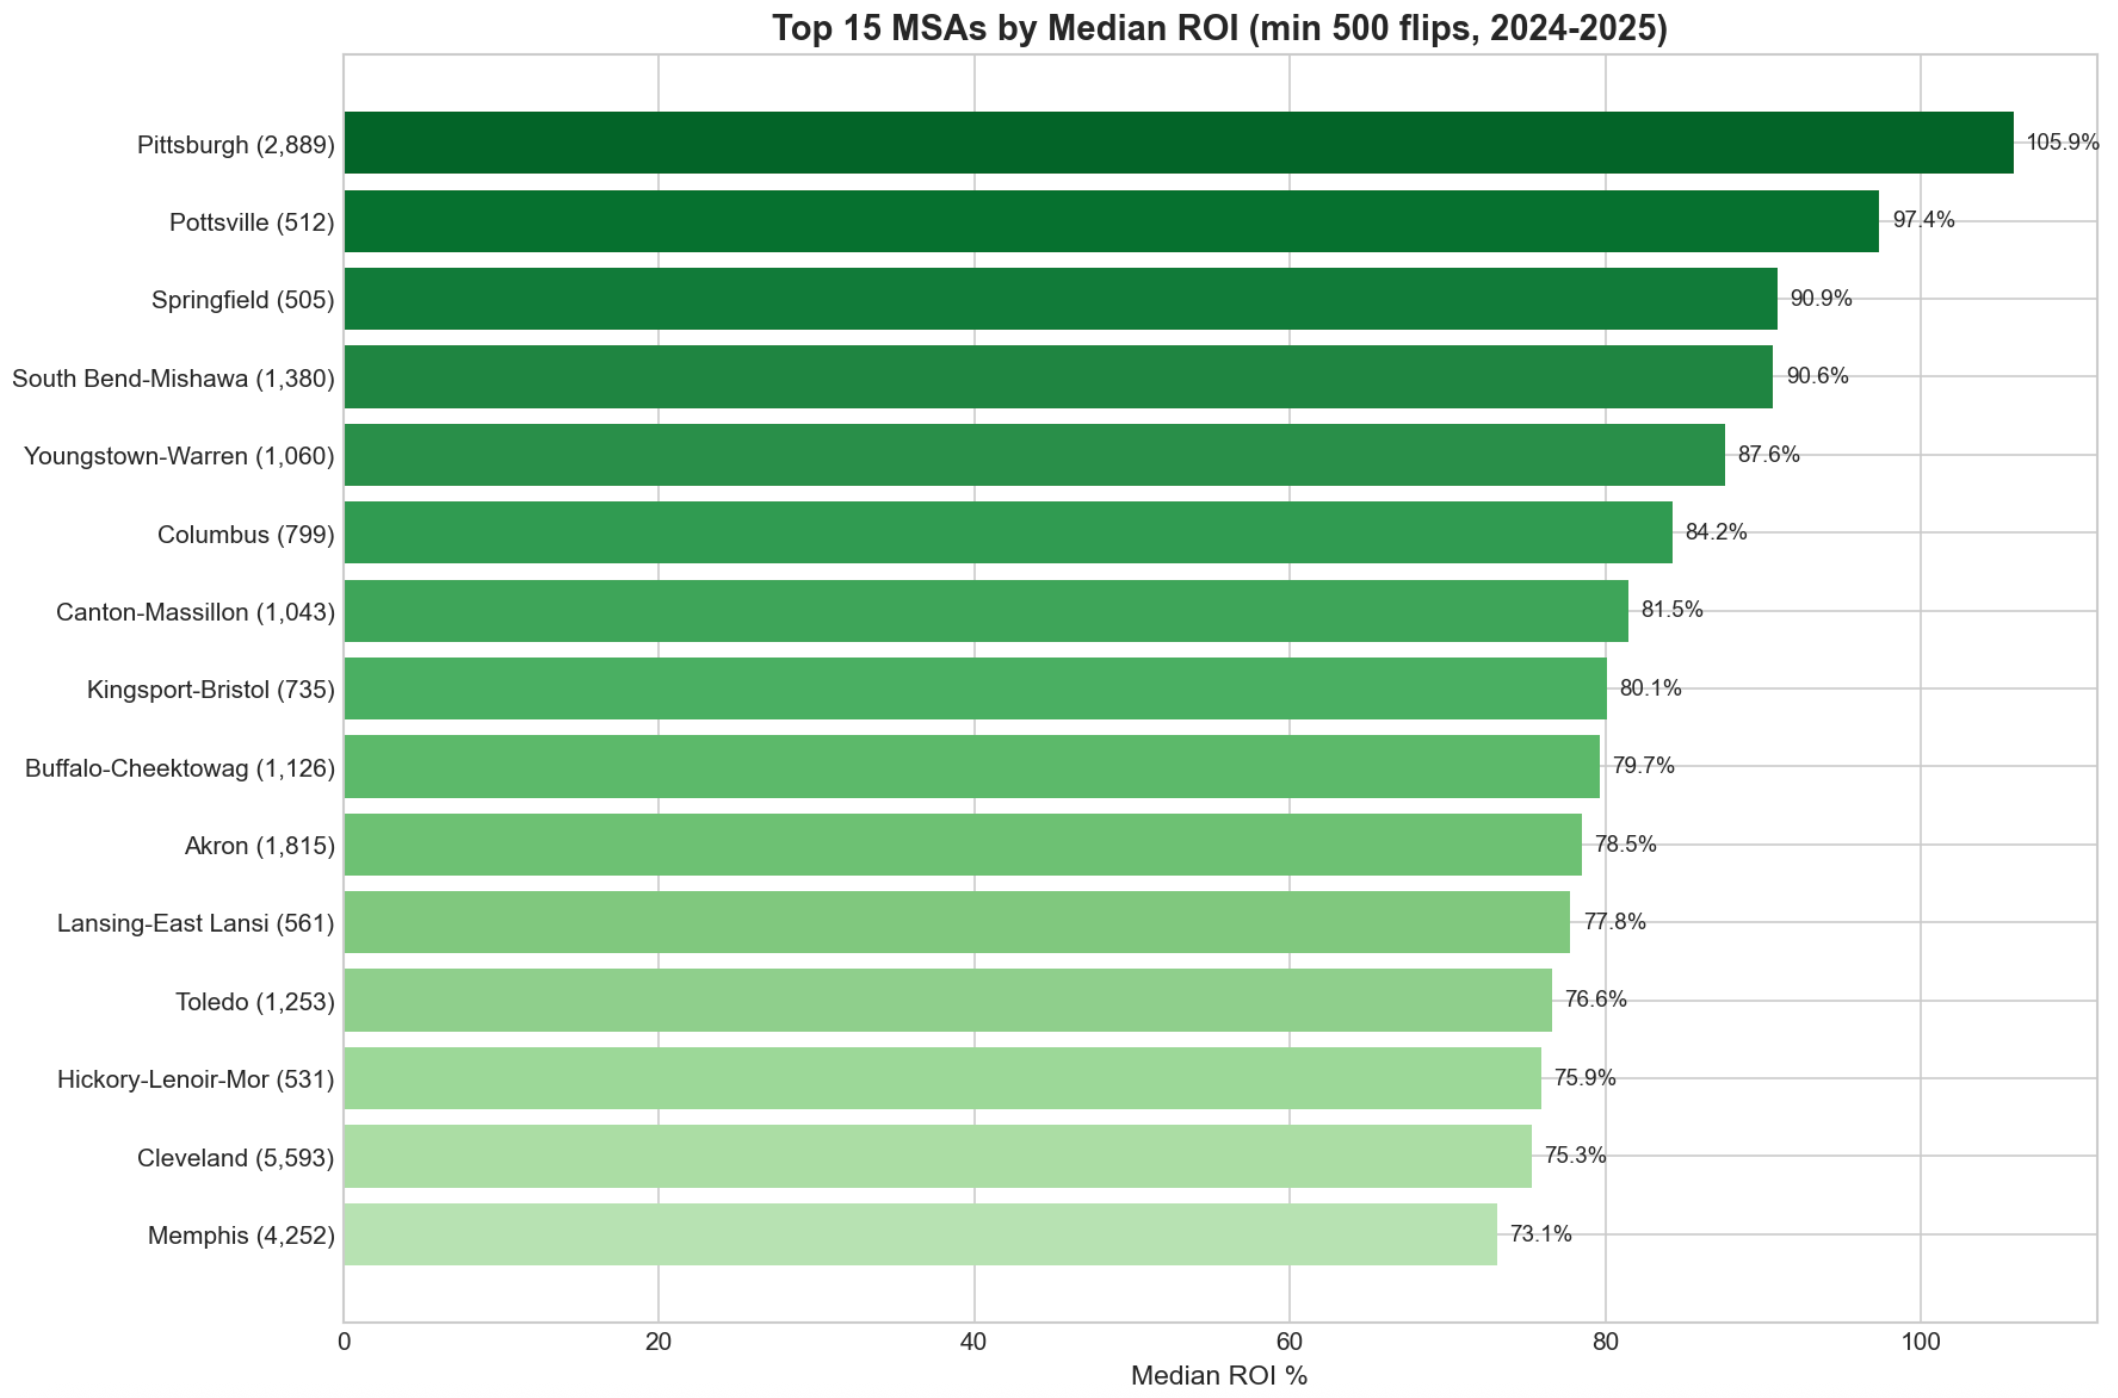
For ROI, we calculate gross return (resale price ÷ purchase price). Lower-cost metros tend to show higher ROI because fixed costs represent a larger share of each deal, requiring wider margins to be profitable.
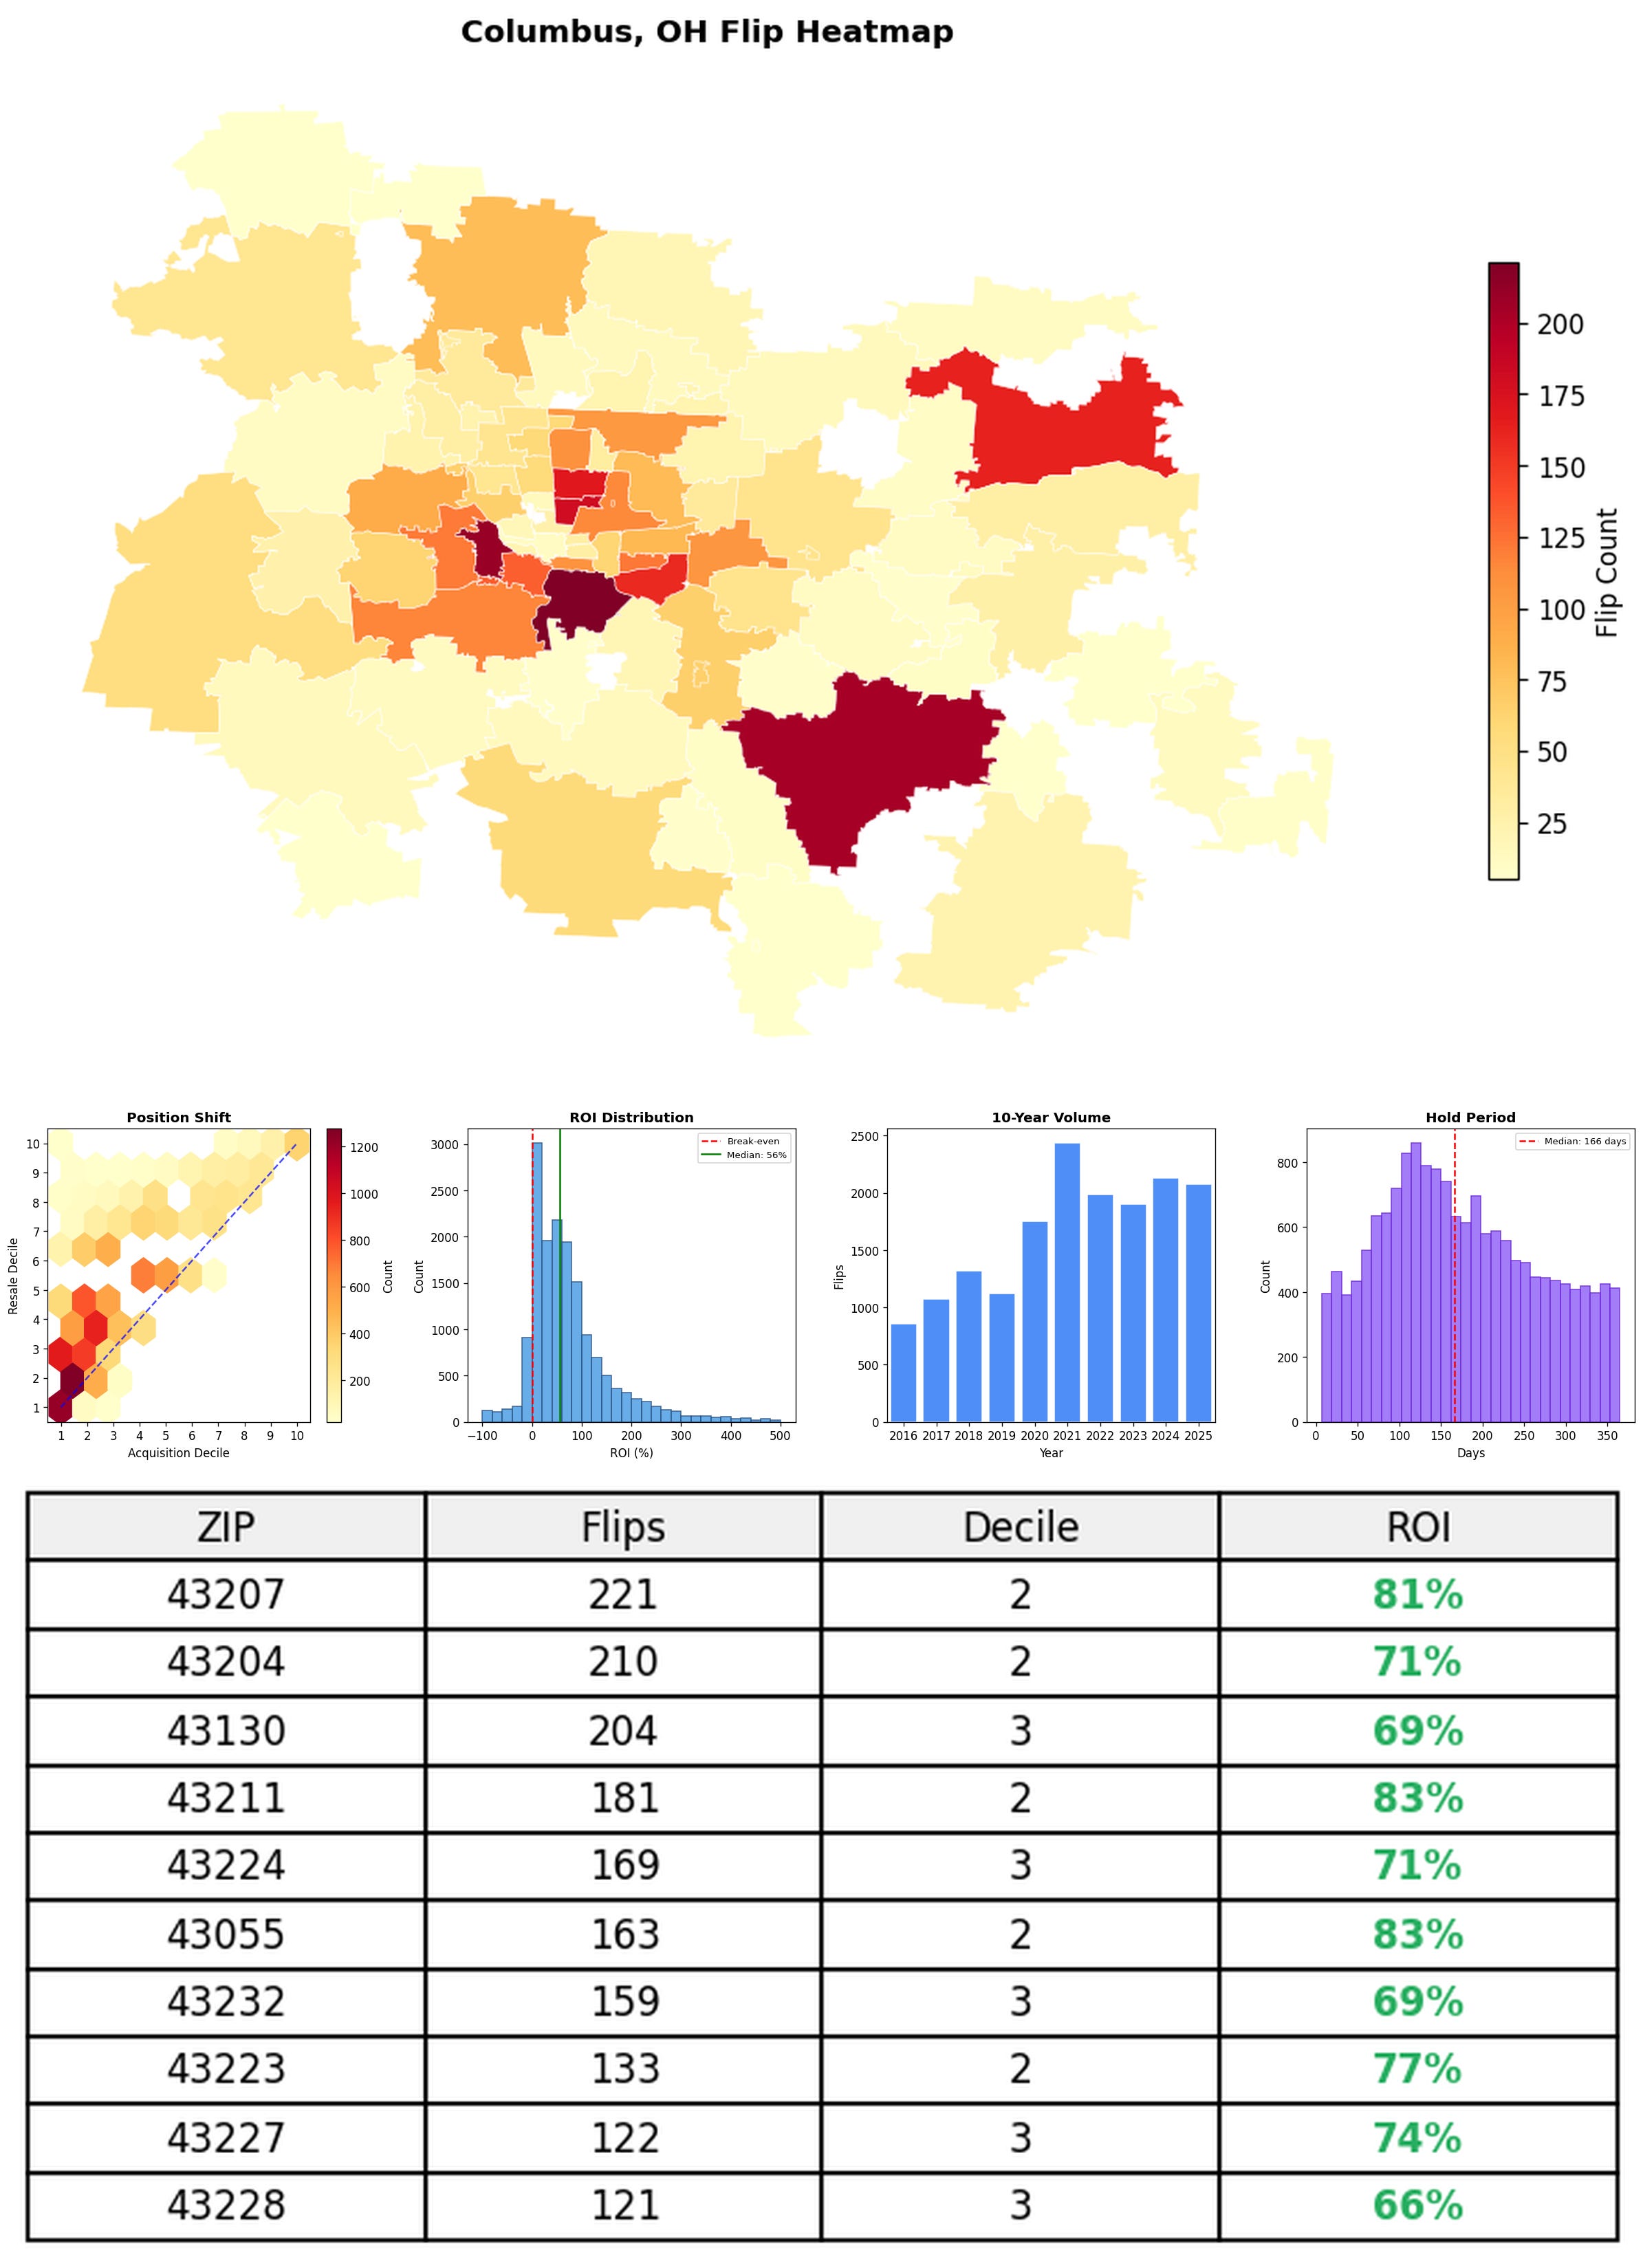
The Rust Belt dominates the high ROI list, with Ohio claiming 5 of the top 15 metros with the highest ROI.
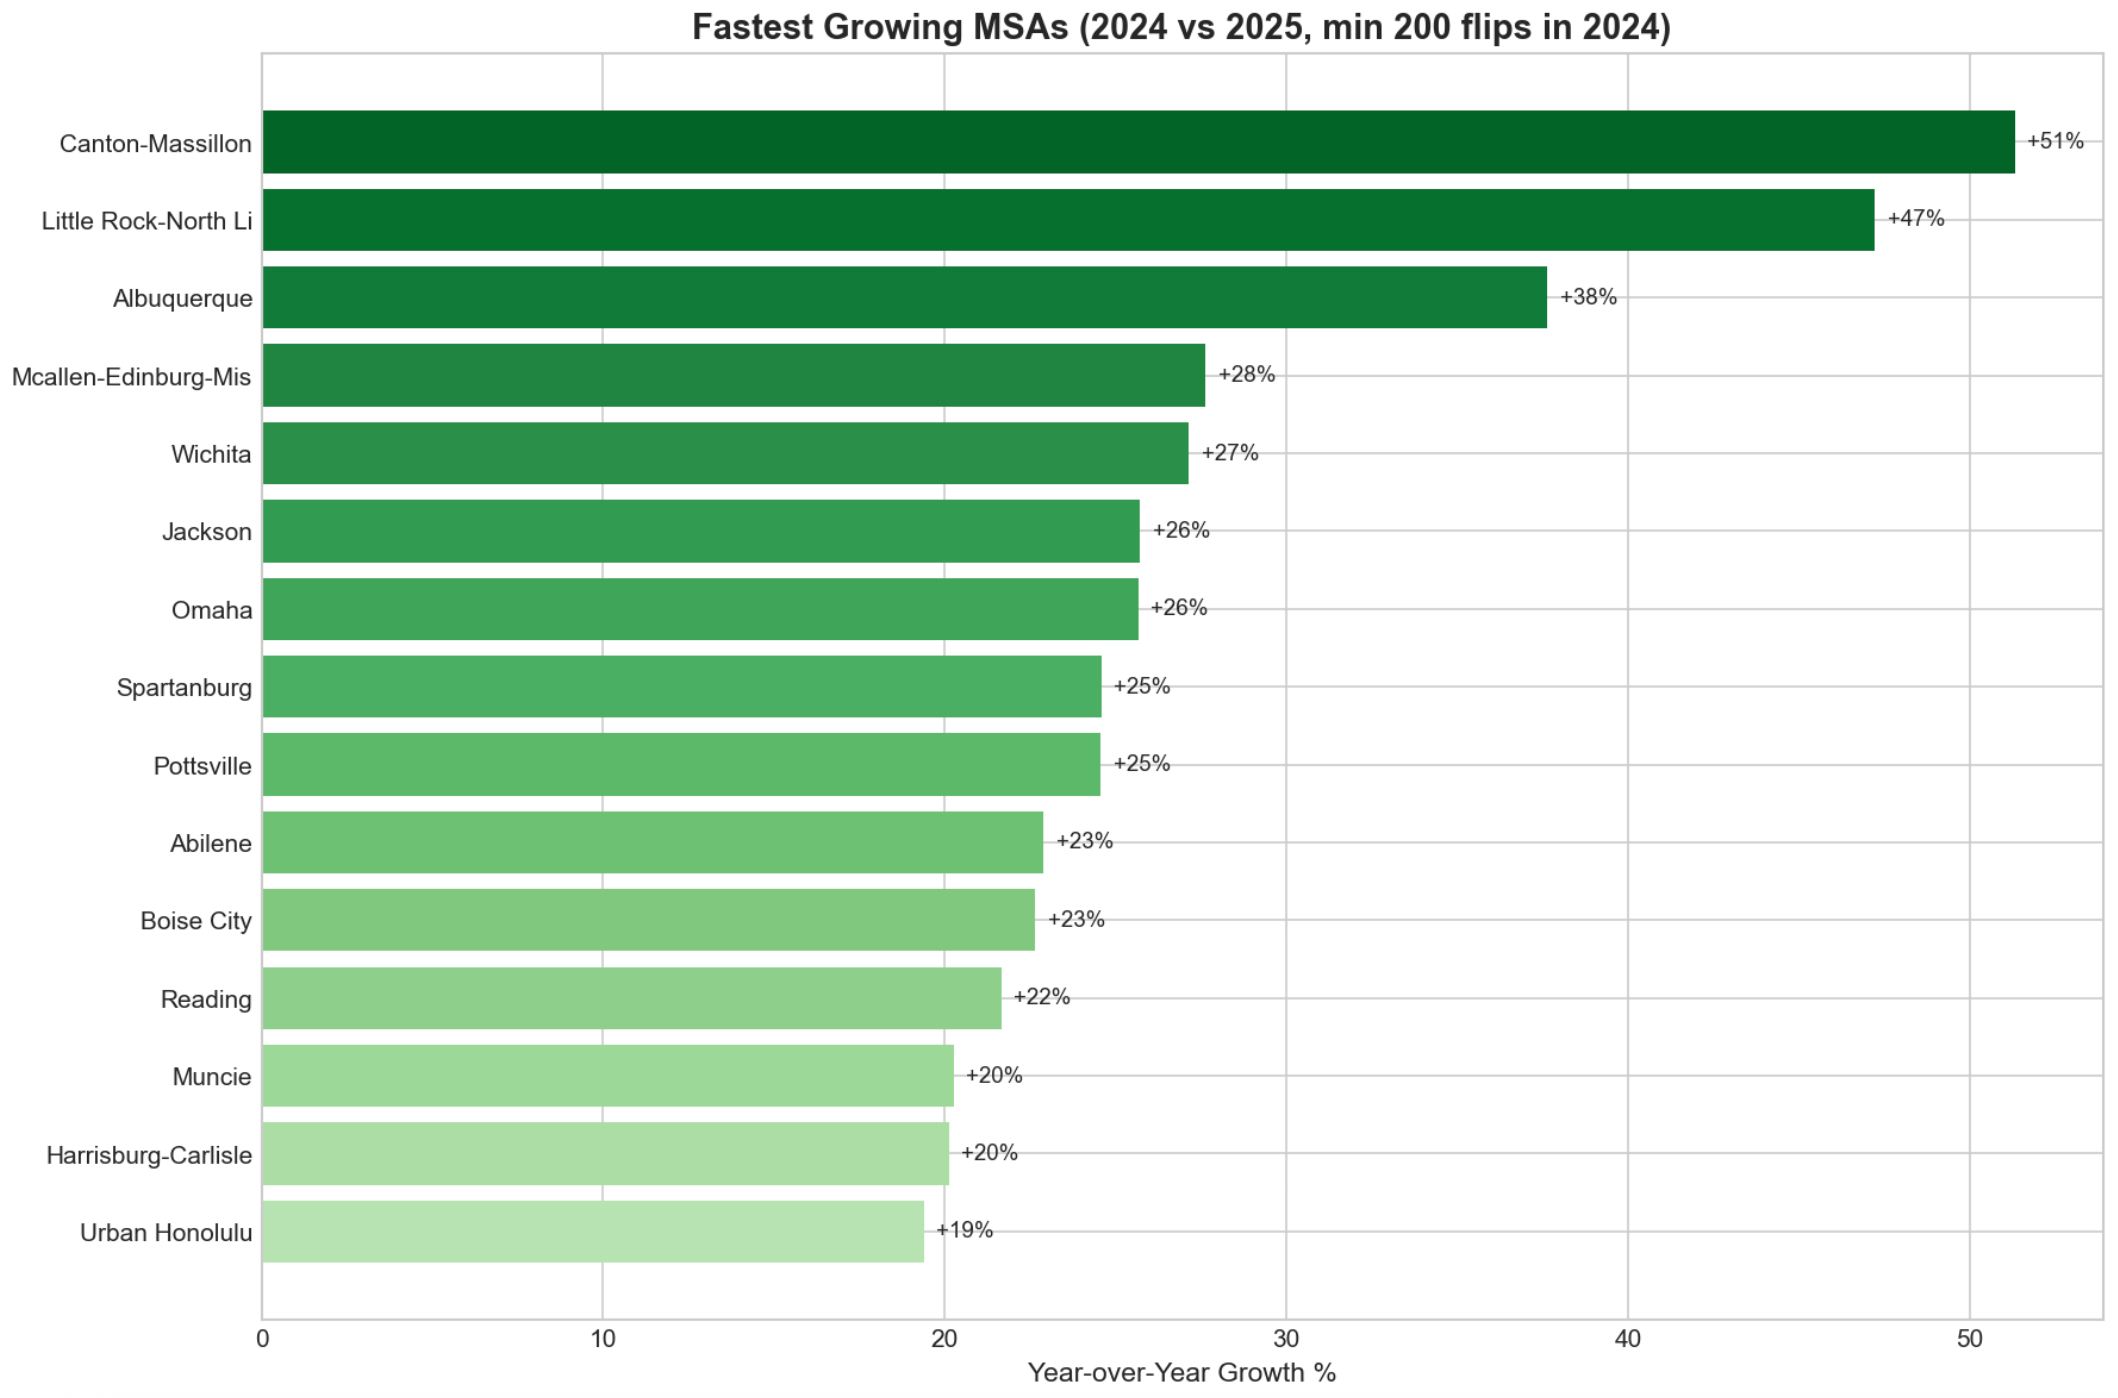
Year-over-year, lower-cost metros also experienced the fastest growth.
Strategies
Flipper strategies vary dramatically by market. We compared the average acquisition price of a flip (at a ZIP code level) to the decile for the average home value in the MSA. We use this to see which markets have flip activity concentrated in lower-cost areas versus higher-cost ZIP codes.
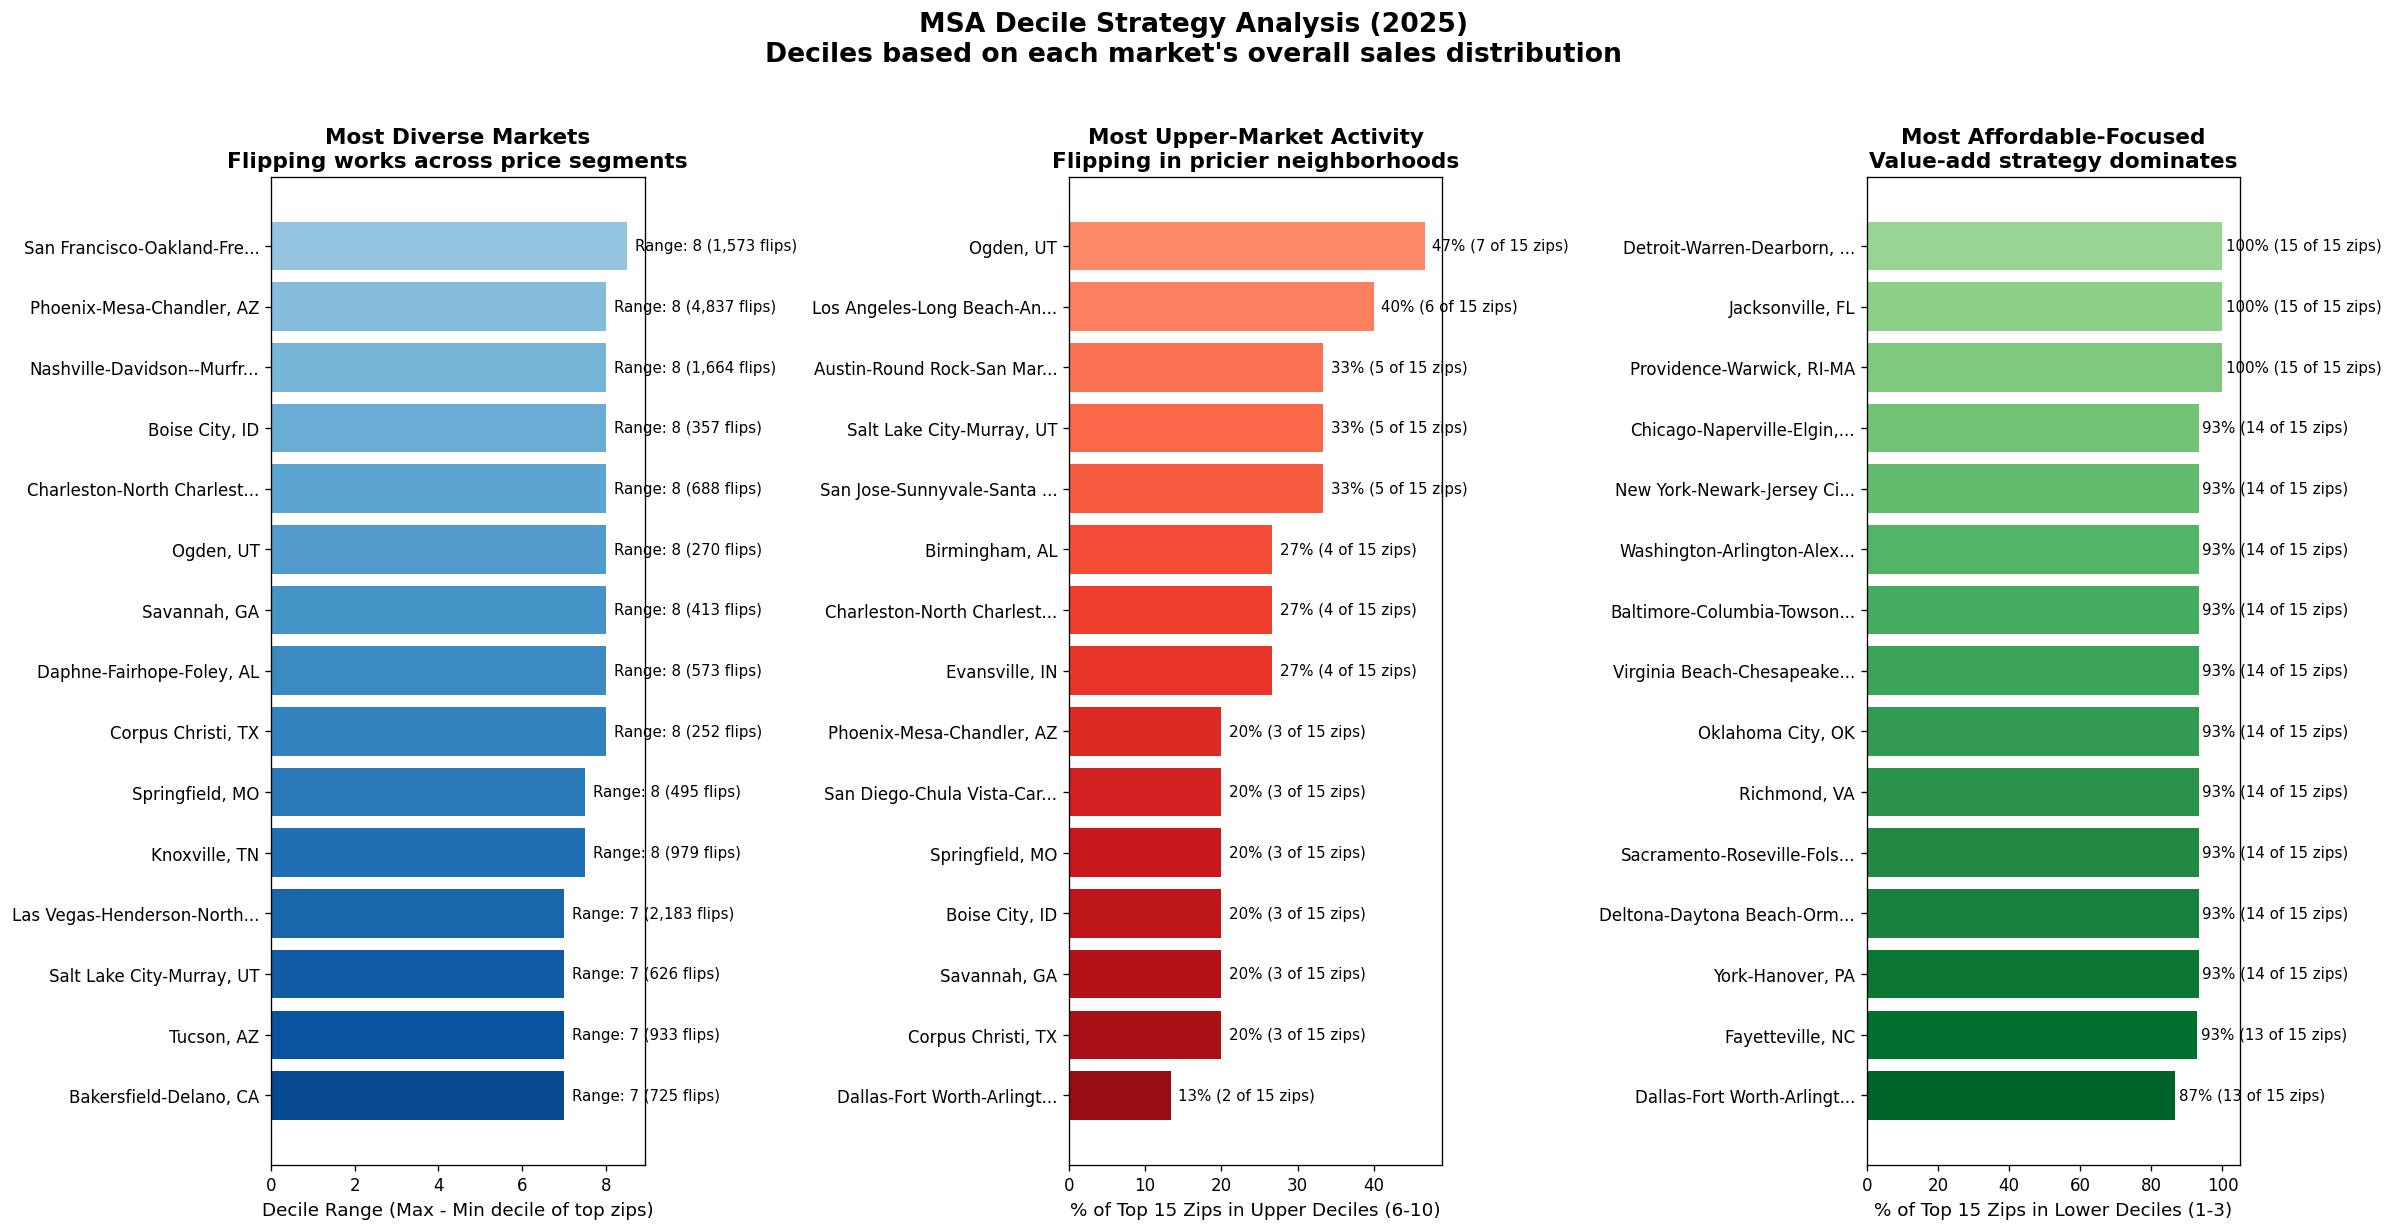
San Francisco, Phoenix, and Nashville have the most diverse activity with the top 15 flipped ZIP codes spanning eight of the top price deciles, meaning that flips are happening both on luxury properties and on smaller, less valuable properties.
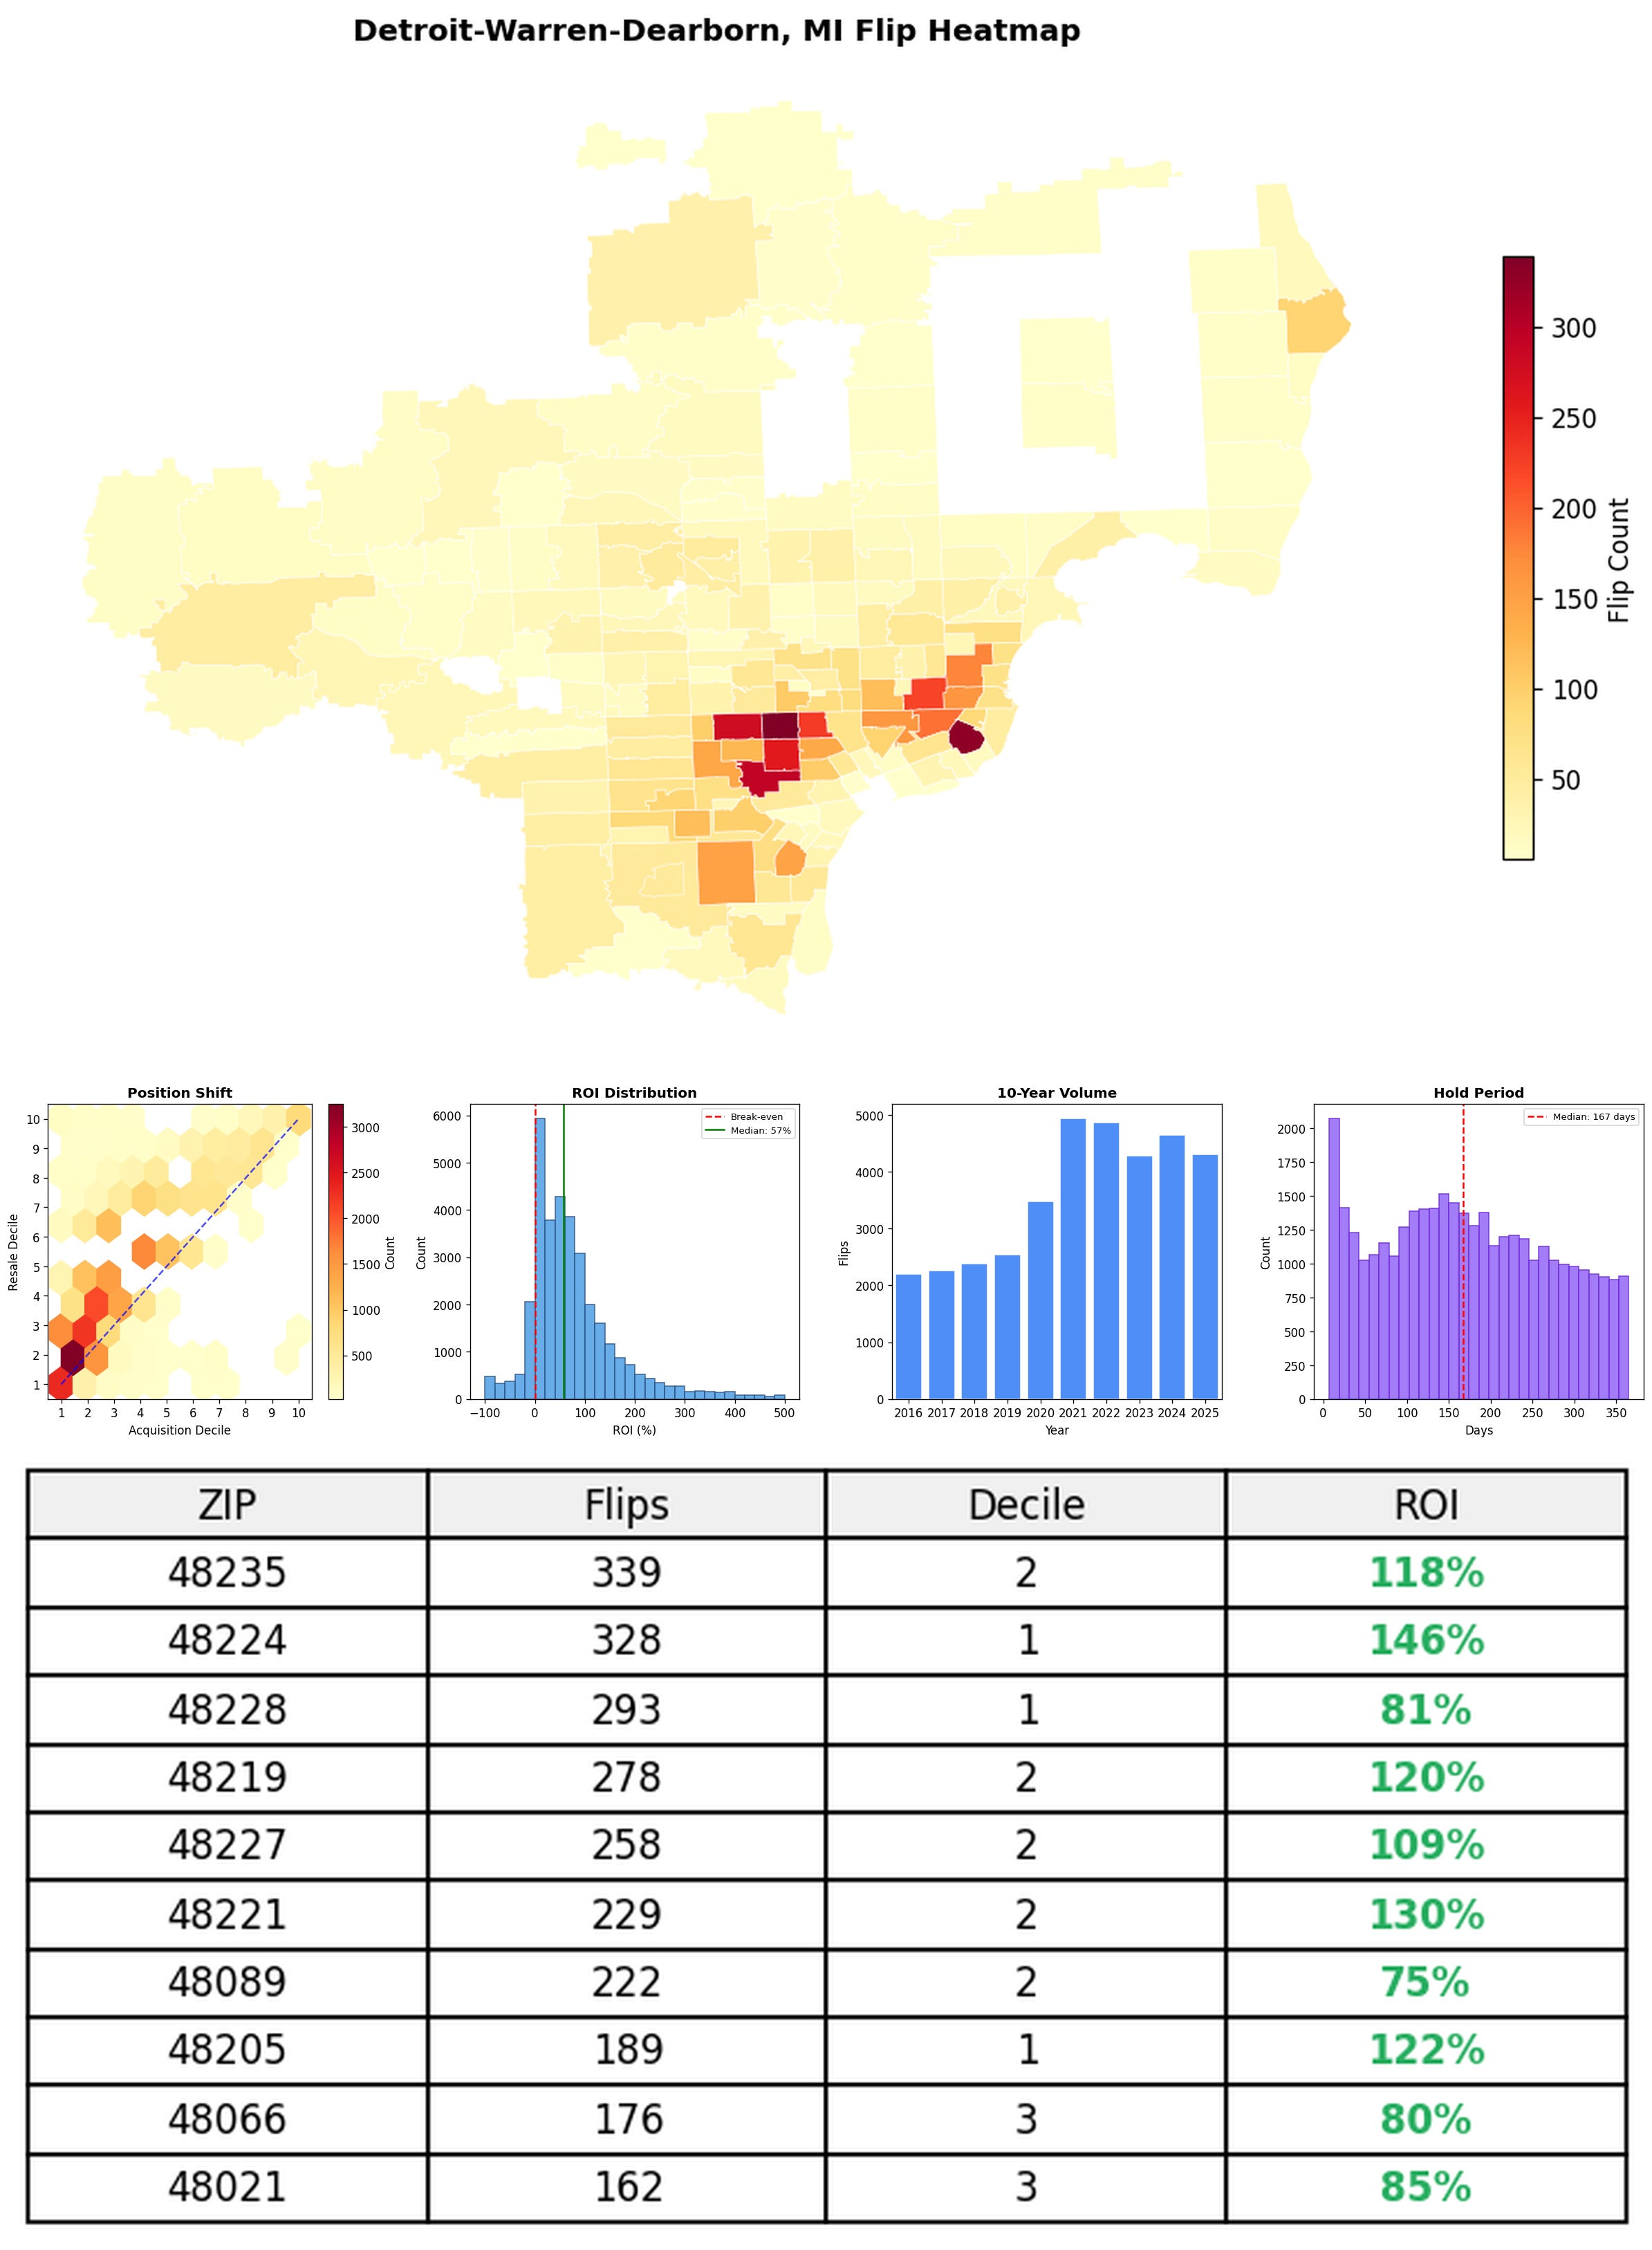
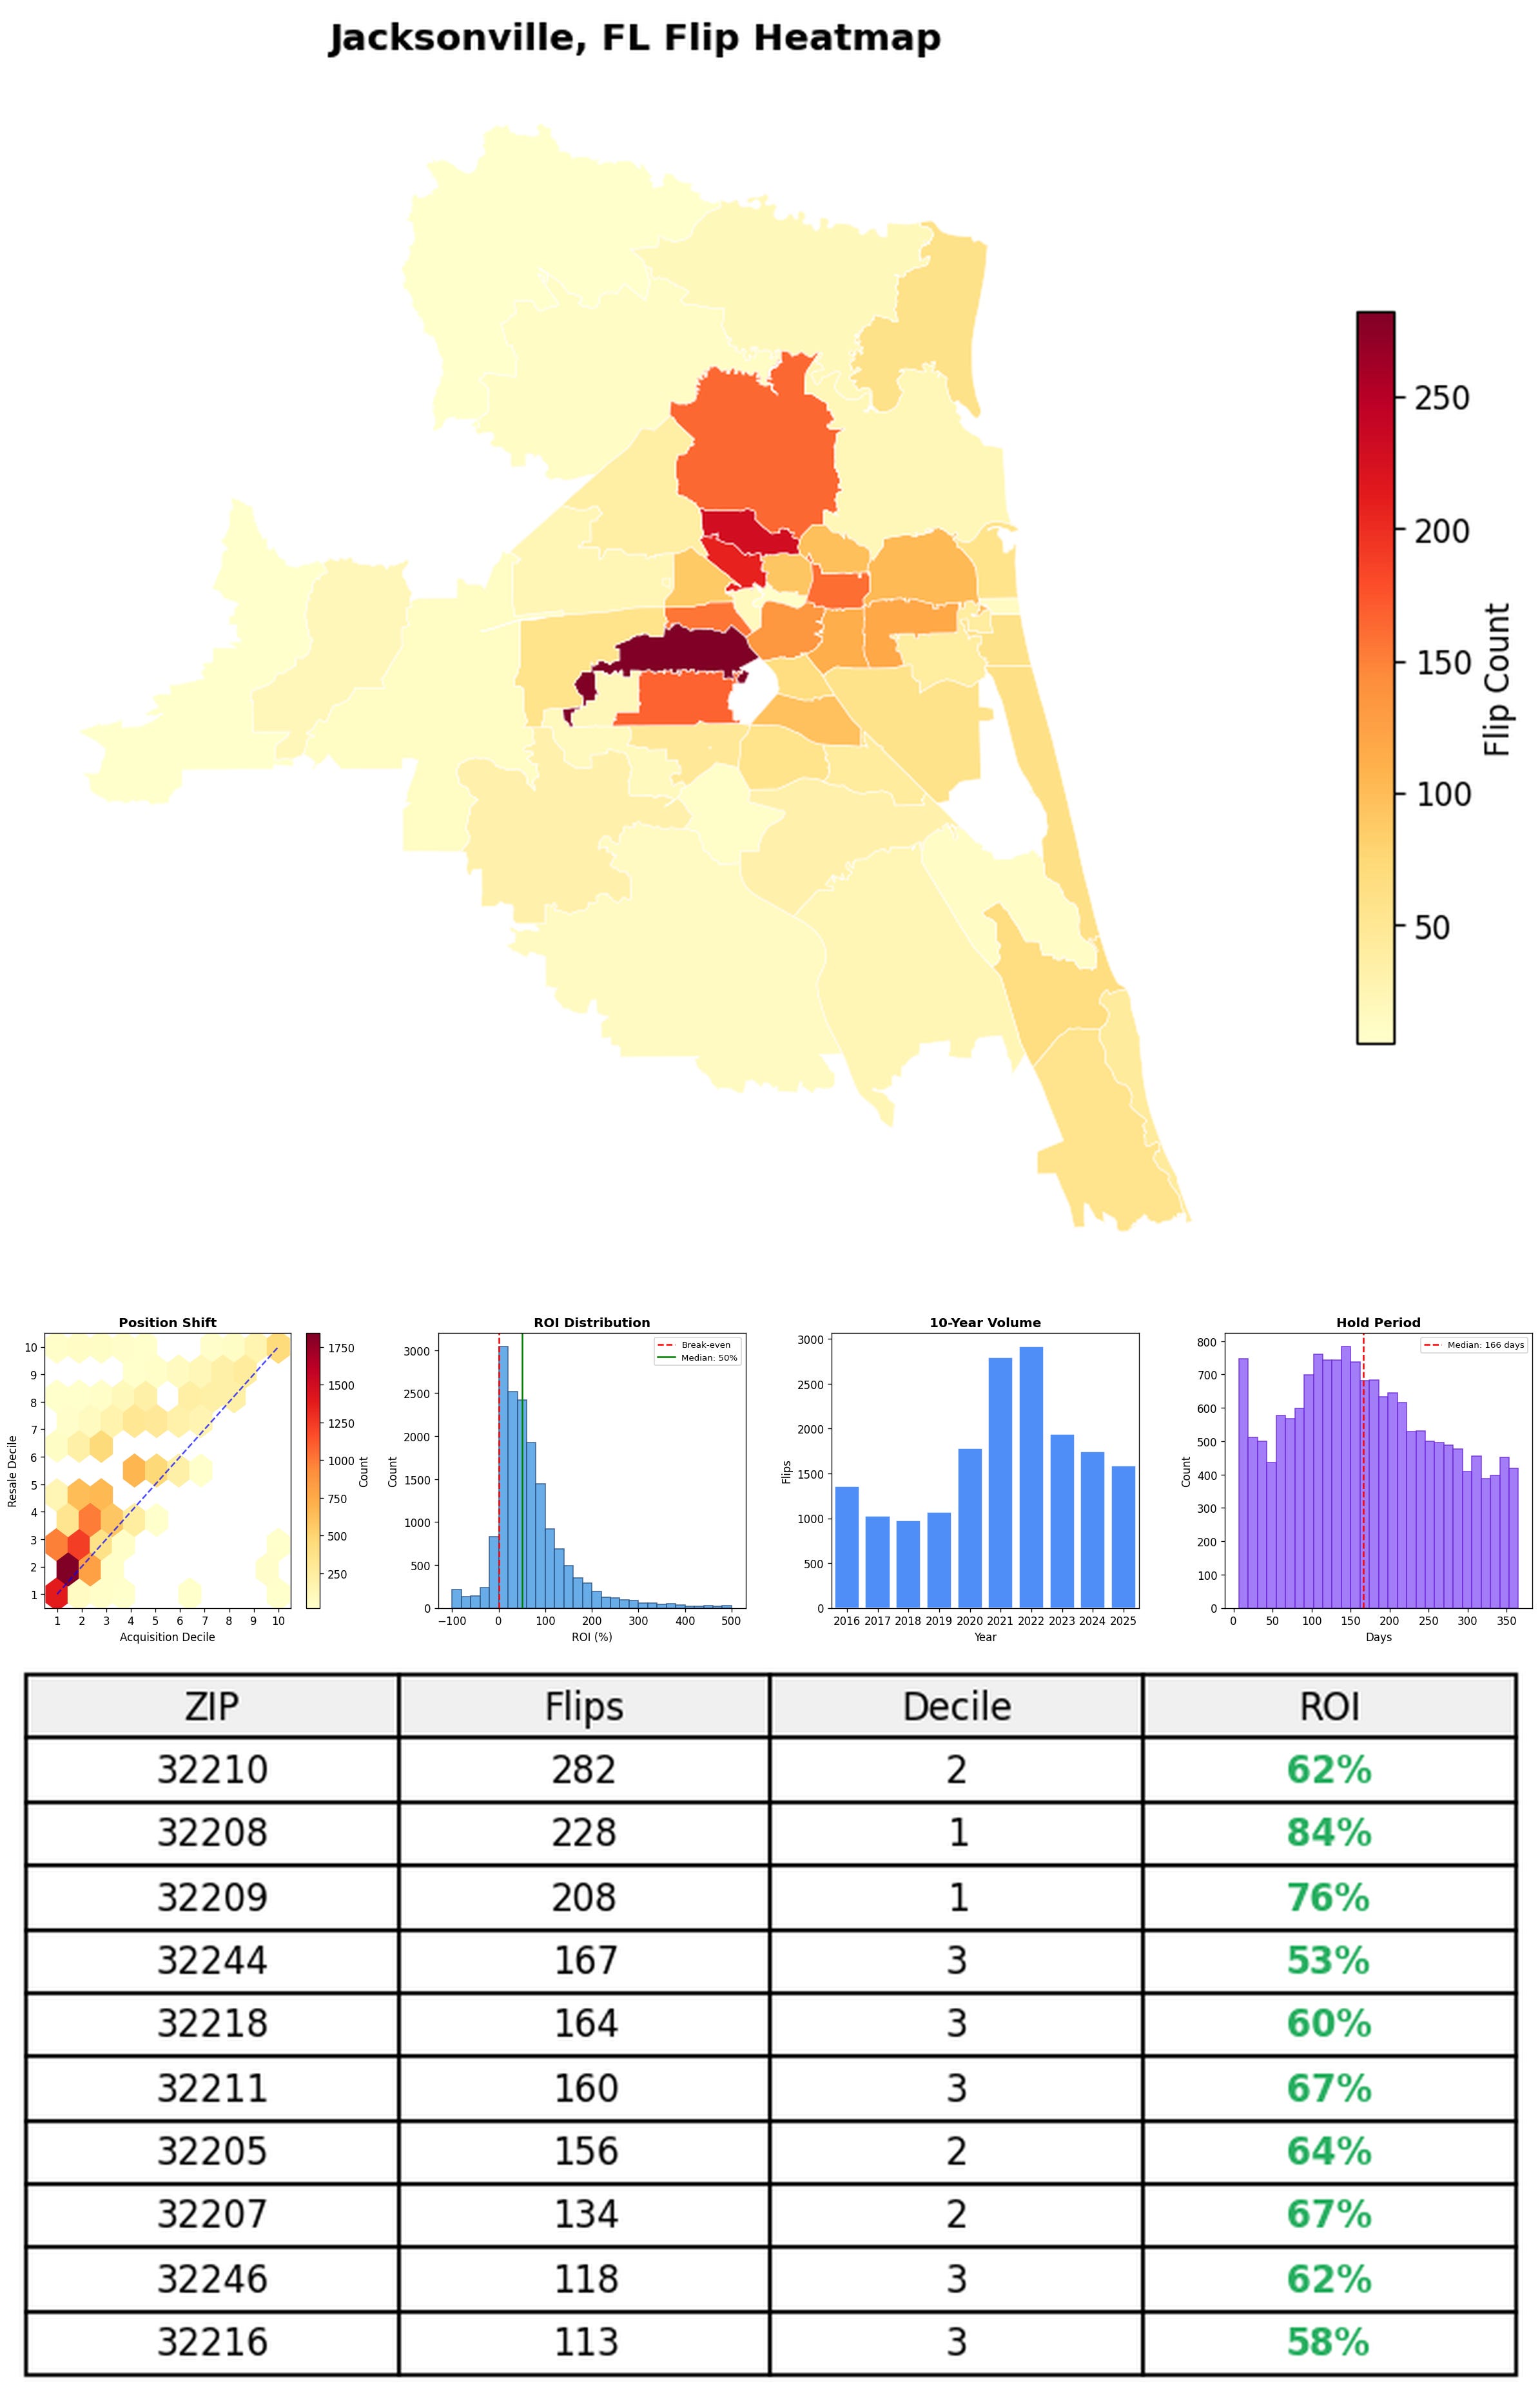
Ogden, LA, and Austin had the most concentration of the top ZIP codes for flipping happening in the upper 40th percentile in prices. Meanwhile, Detroit, Jacksonville, and Providence had the most activity concentrated in lower-value ZIP codes.
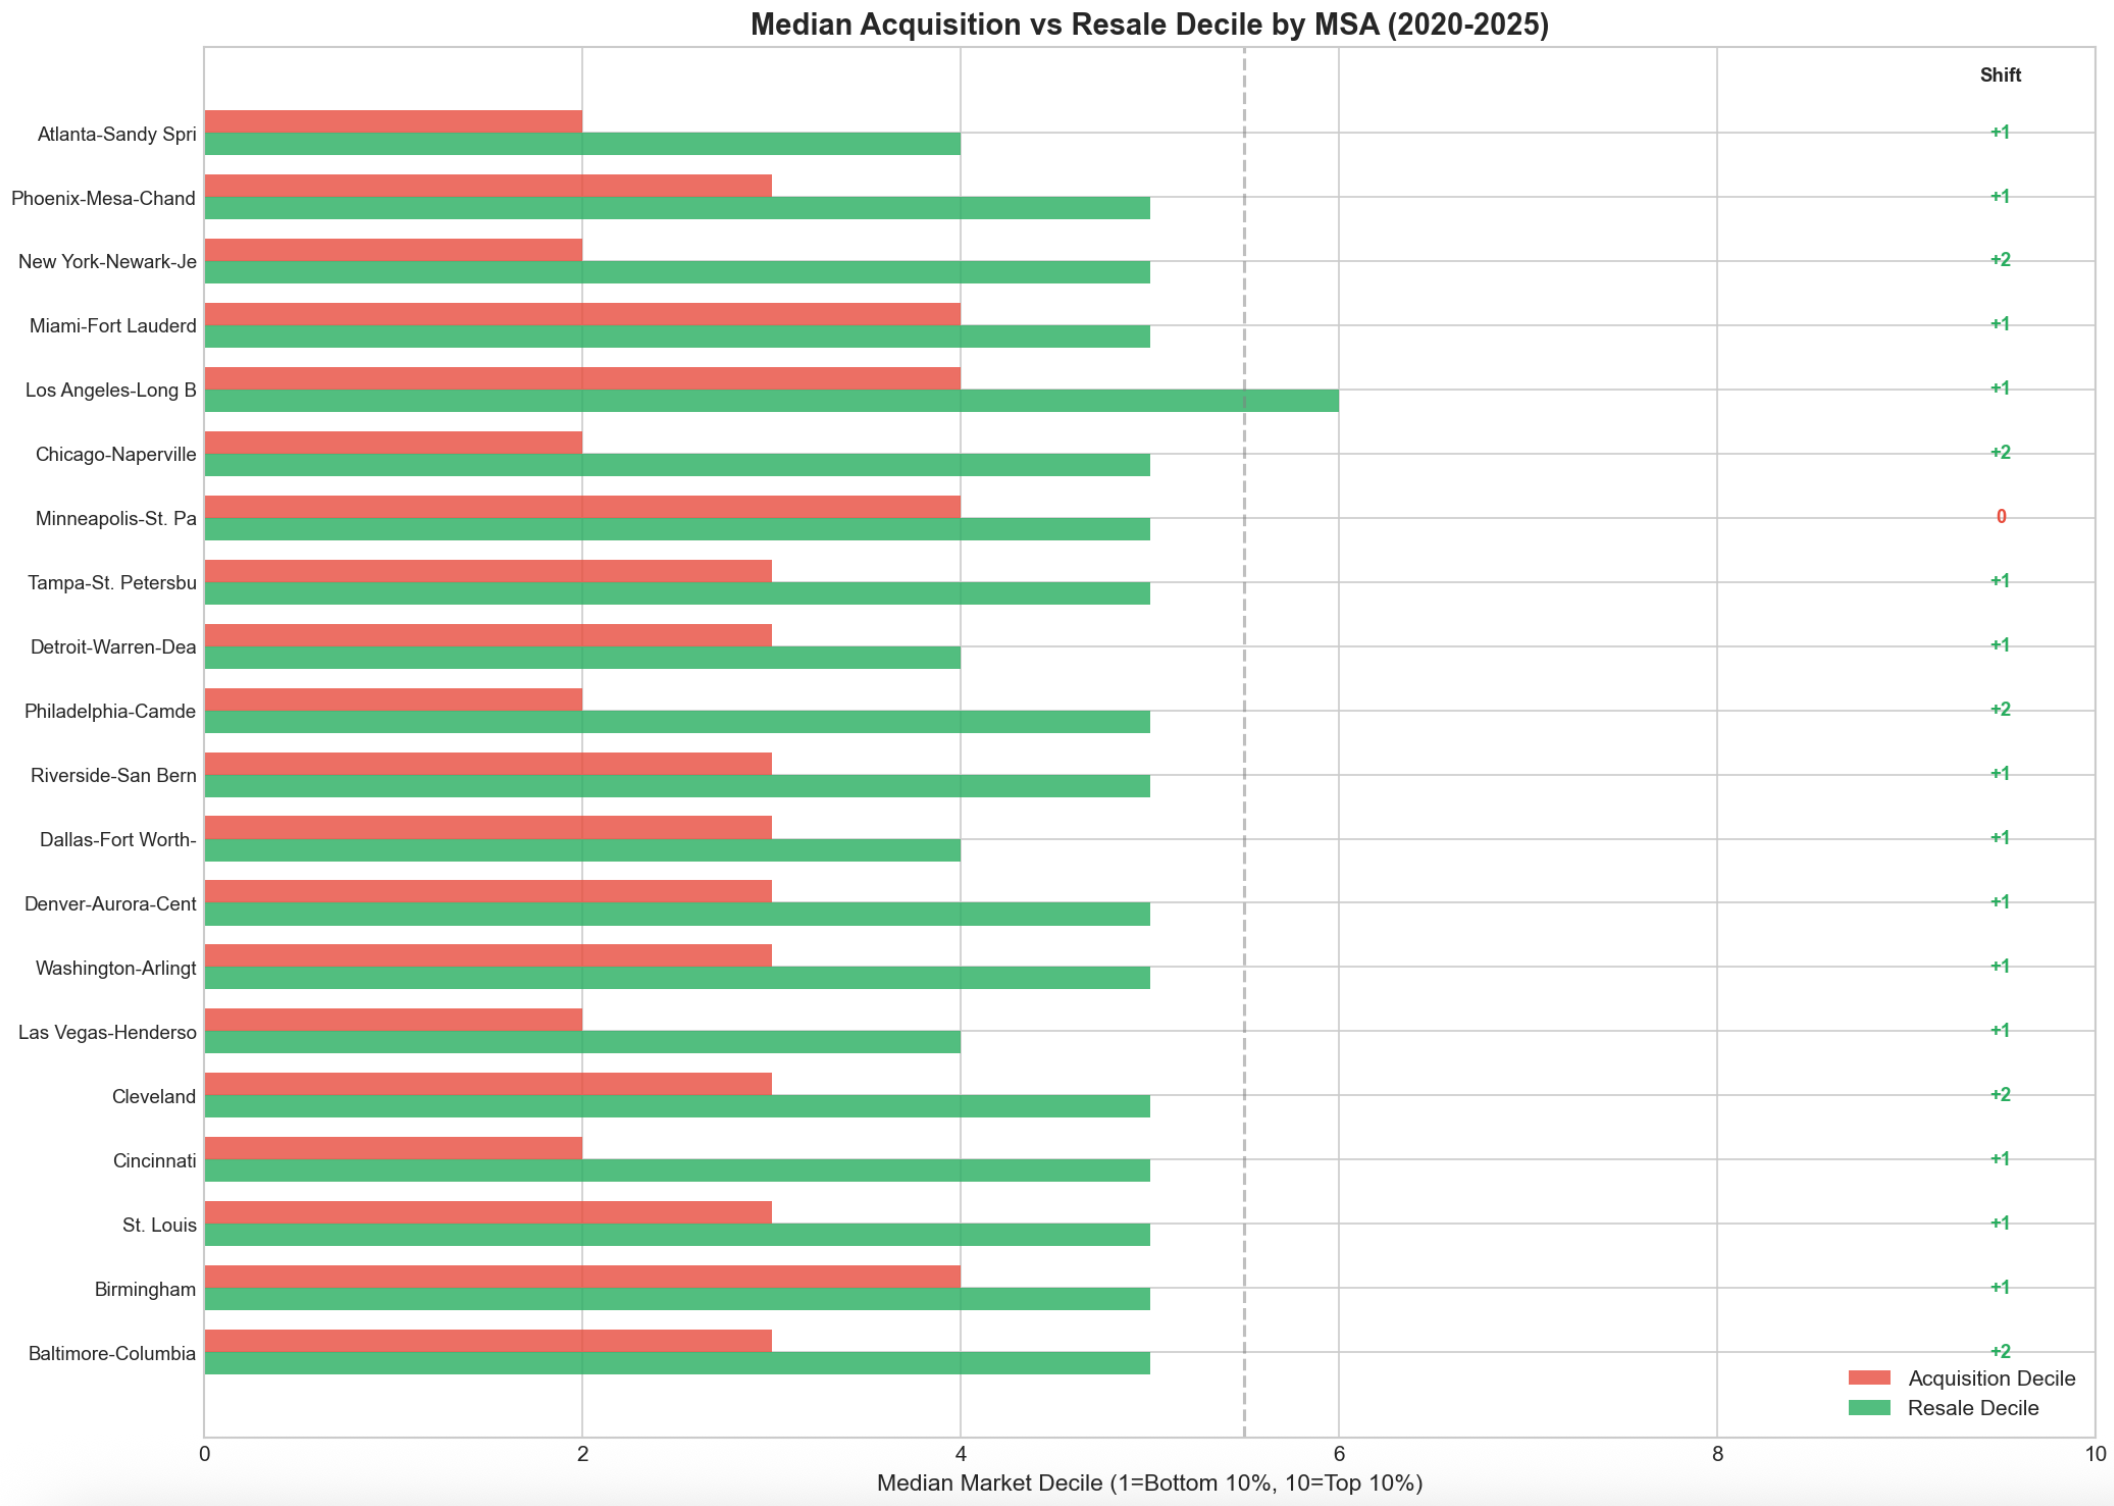
Comparing acquisition to resale price percentiles, properties typically jump one to two deciles. A common pattern is buying in the 10-20th percentile for the MSA, and reselling it at the 40th-50th percentile. Flippers often buy damaged properties and renovate them to be mid-market properties.
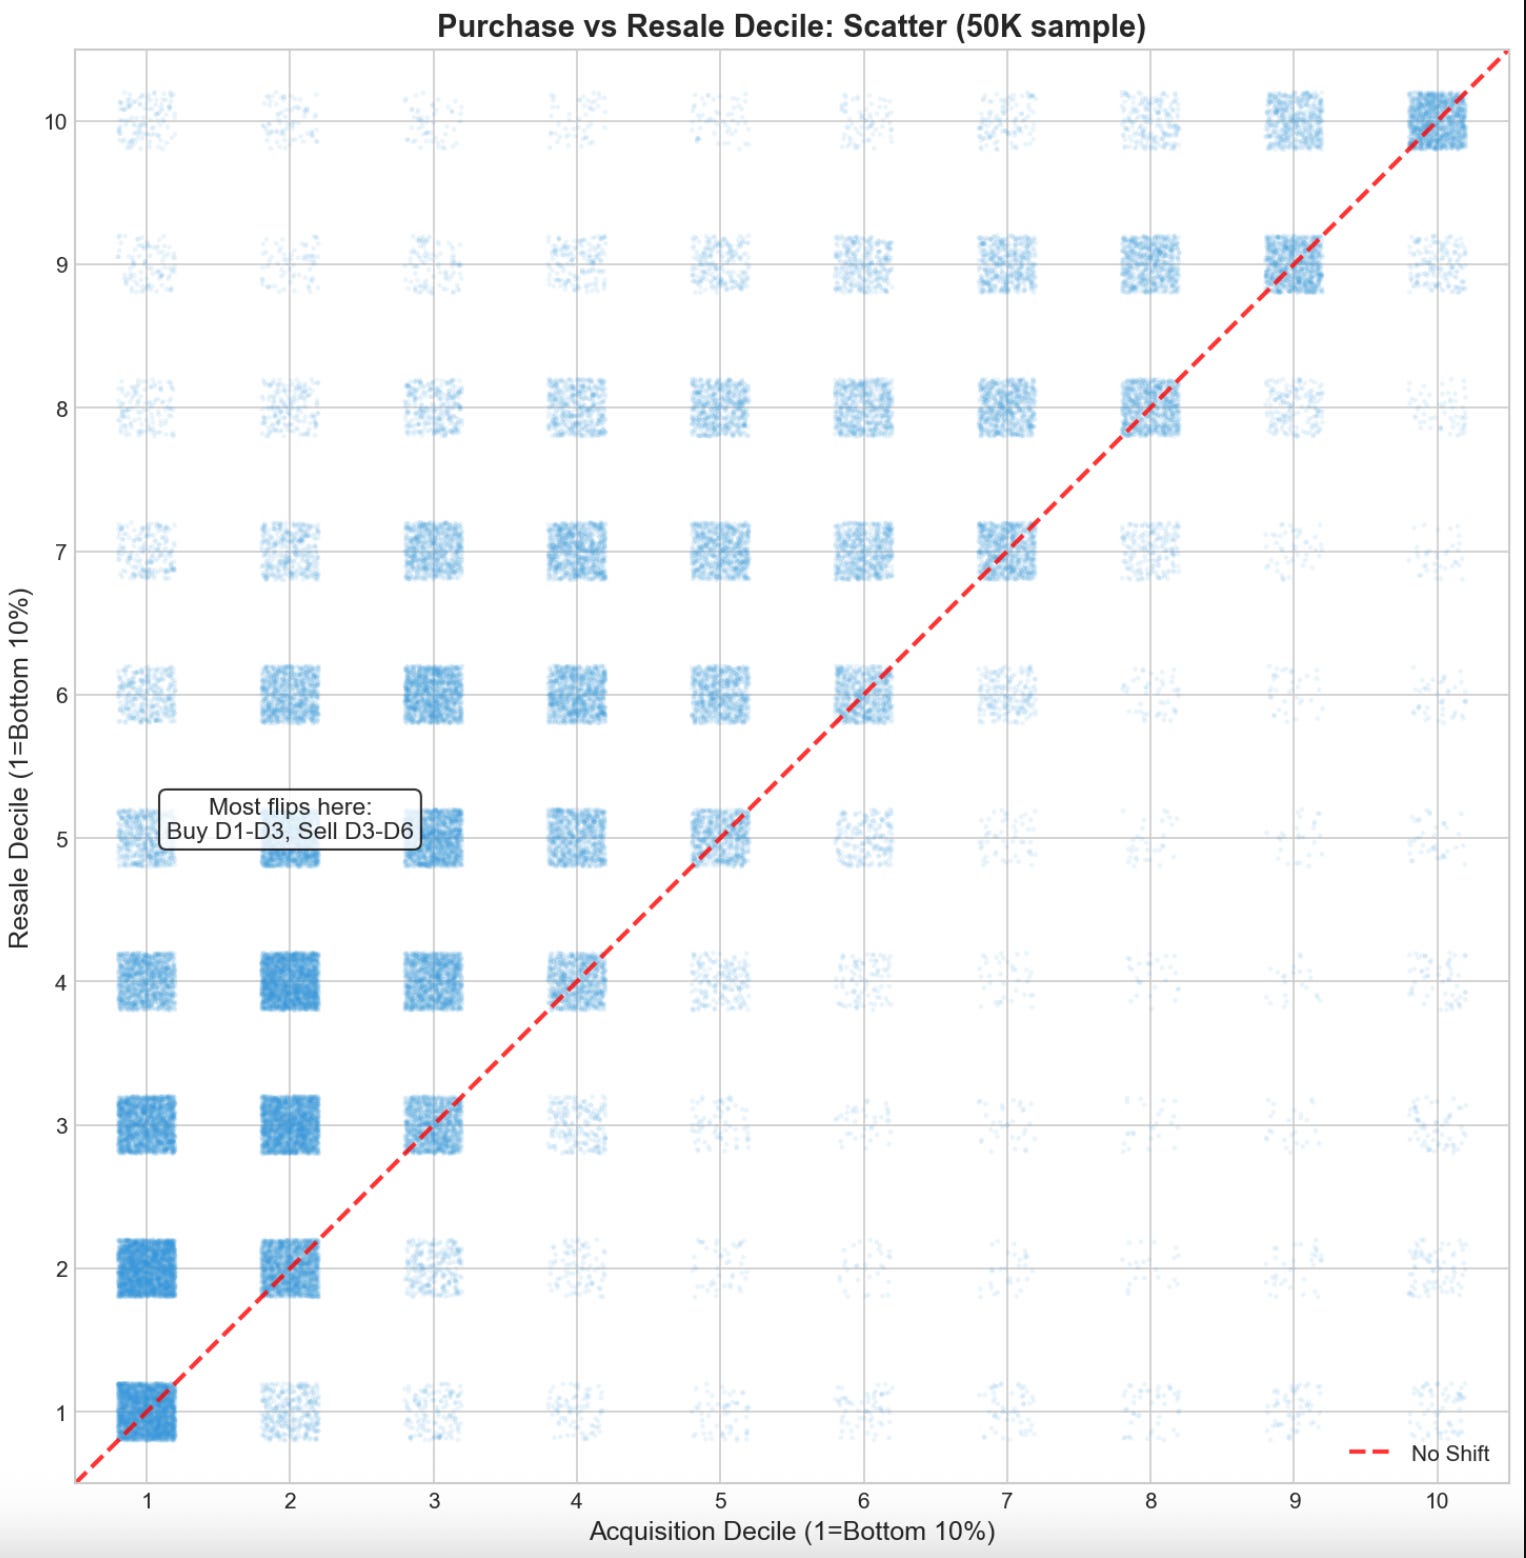
When aggregated nationwide, we can see this pattern clearly: the vast majority of flips are bought in the bottom 30% and resold in the top 50% of their local metro area.
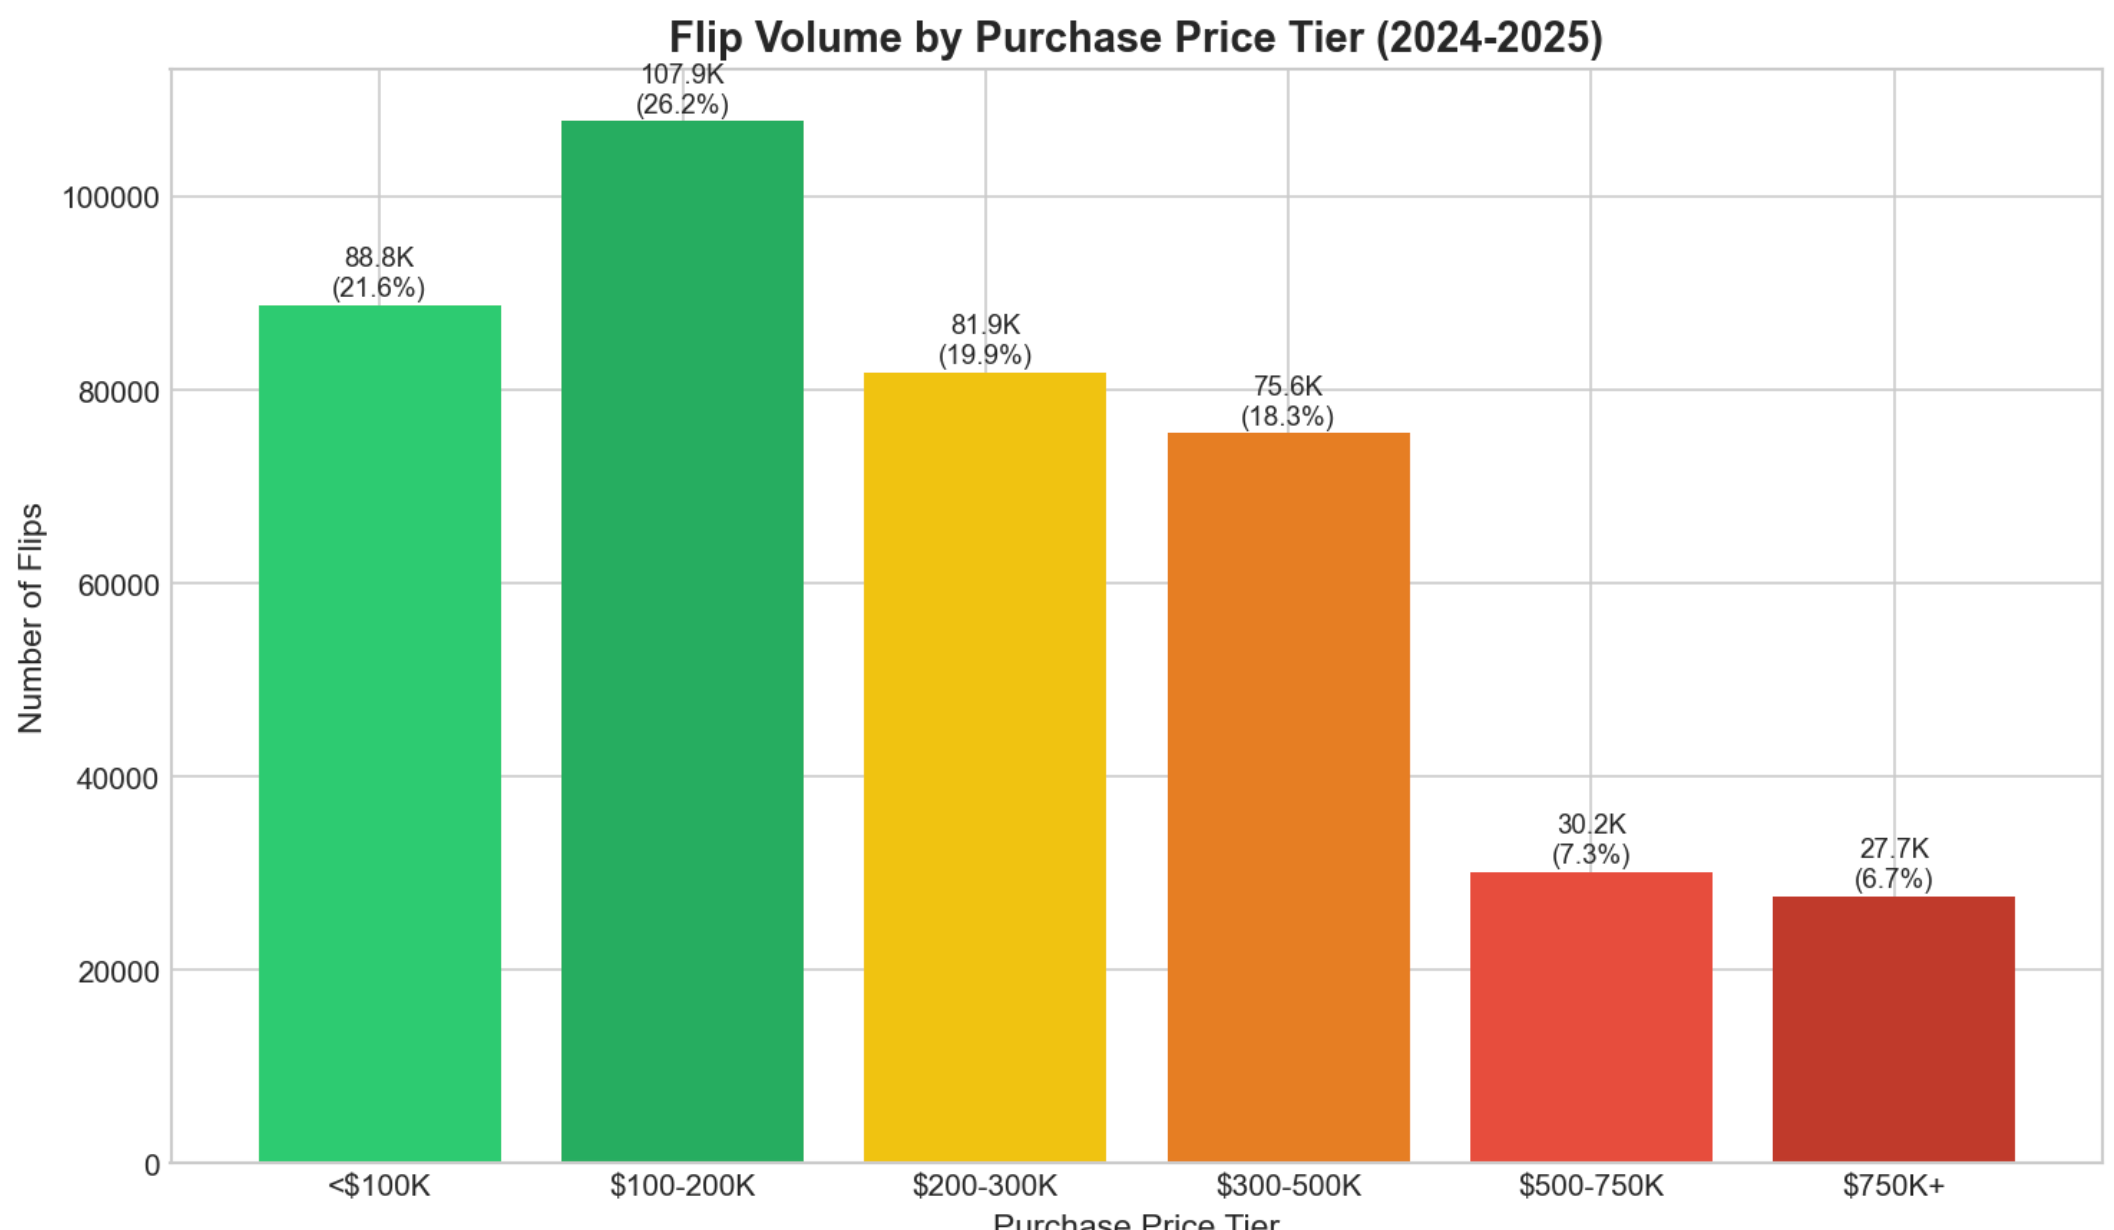
Below is the distribution by purchase price, showing the bulk of flipped properties bought below $300,000, but still sizable amounts bought above $500,000.
Duration
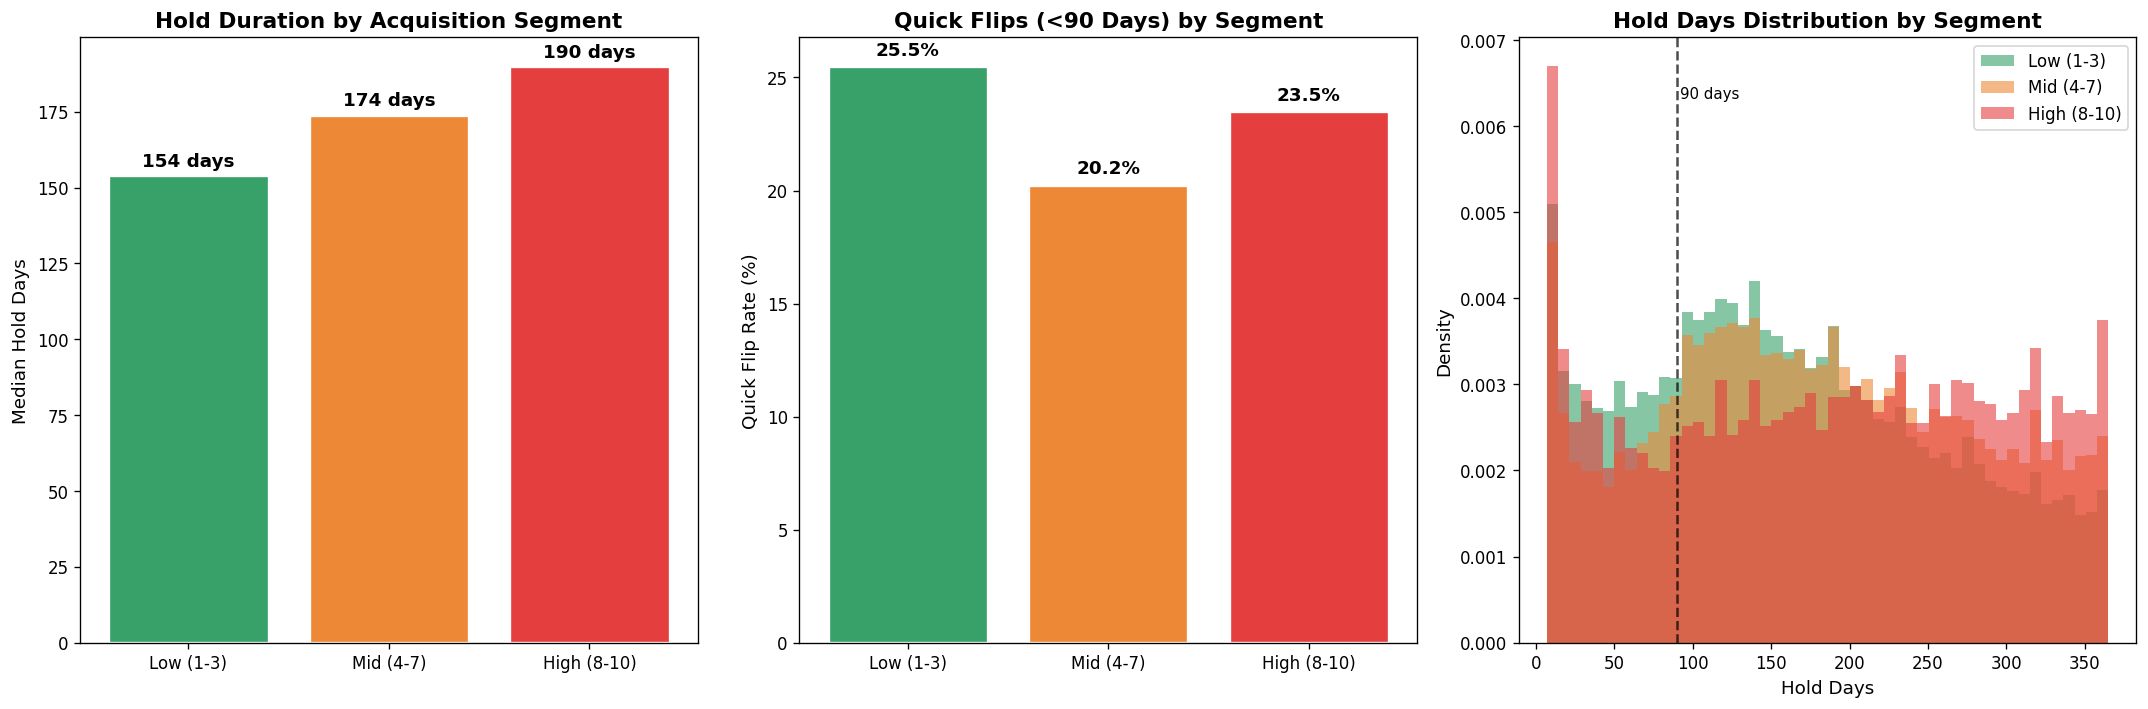
Higher acquisition prices correlate with longer hold times.
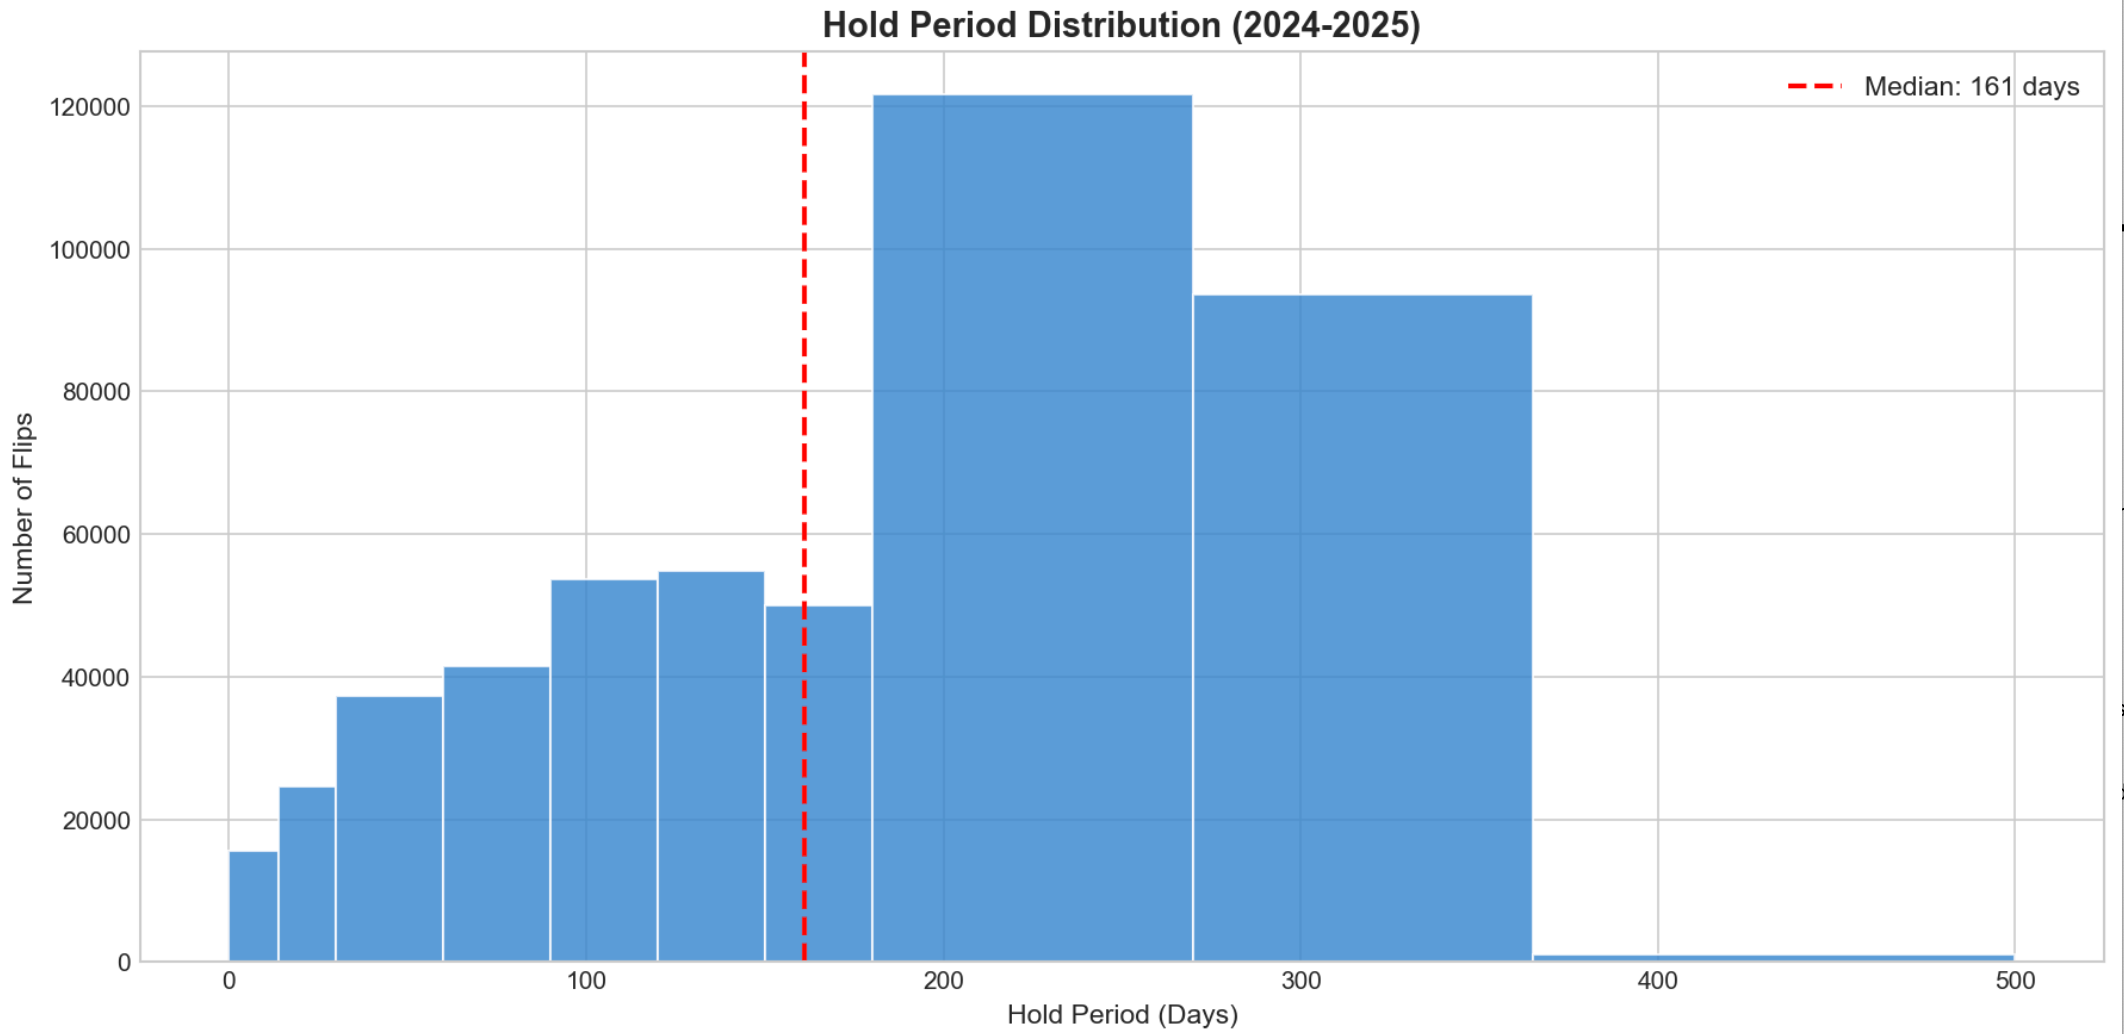
Flippers aim to minimize holding costs. The median hold time is 161 days.
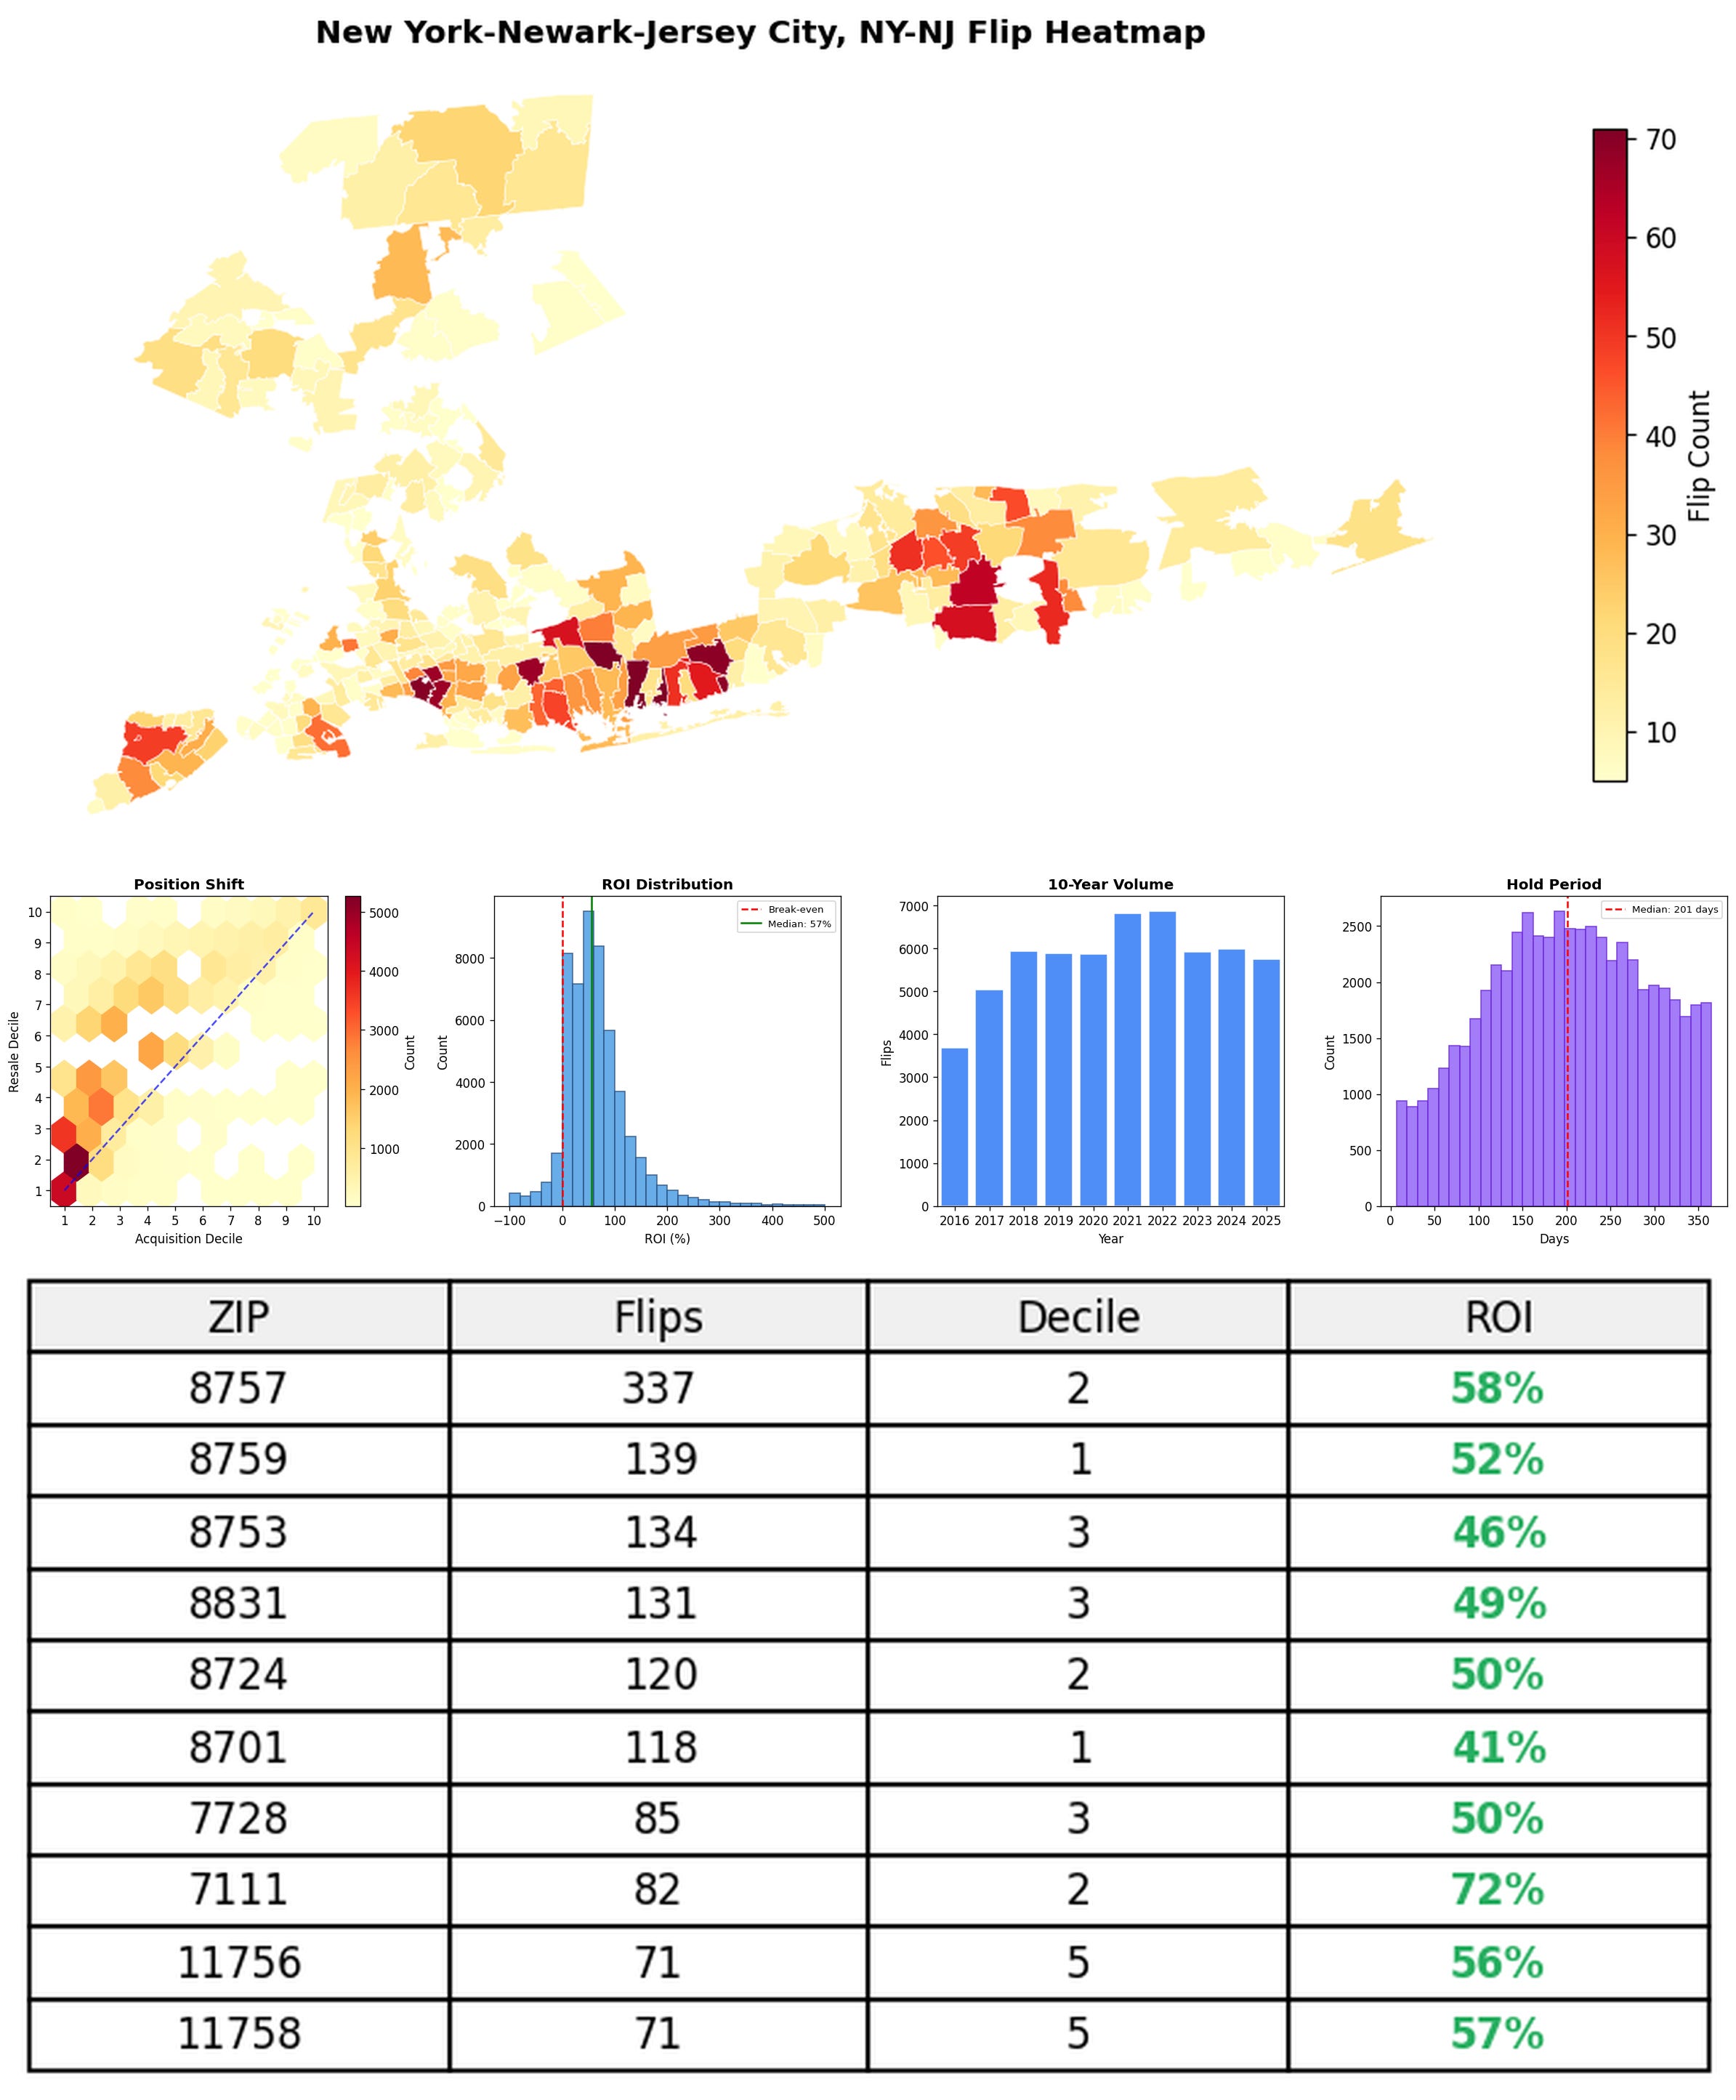
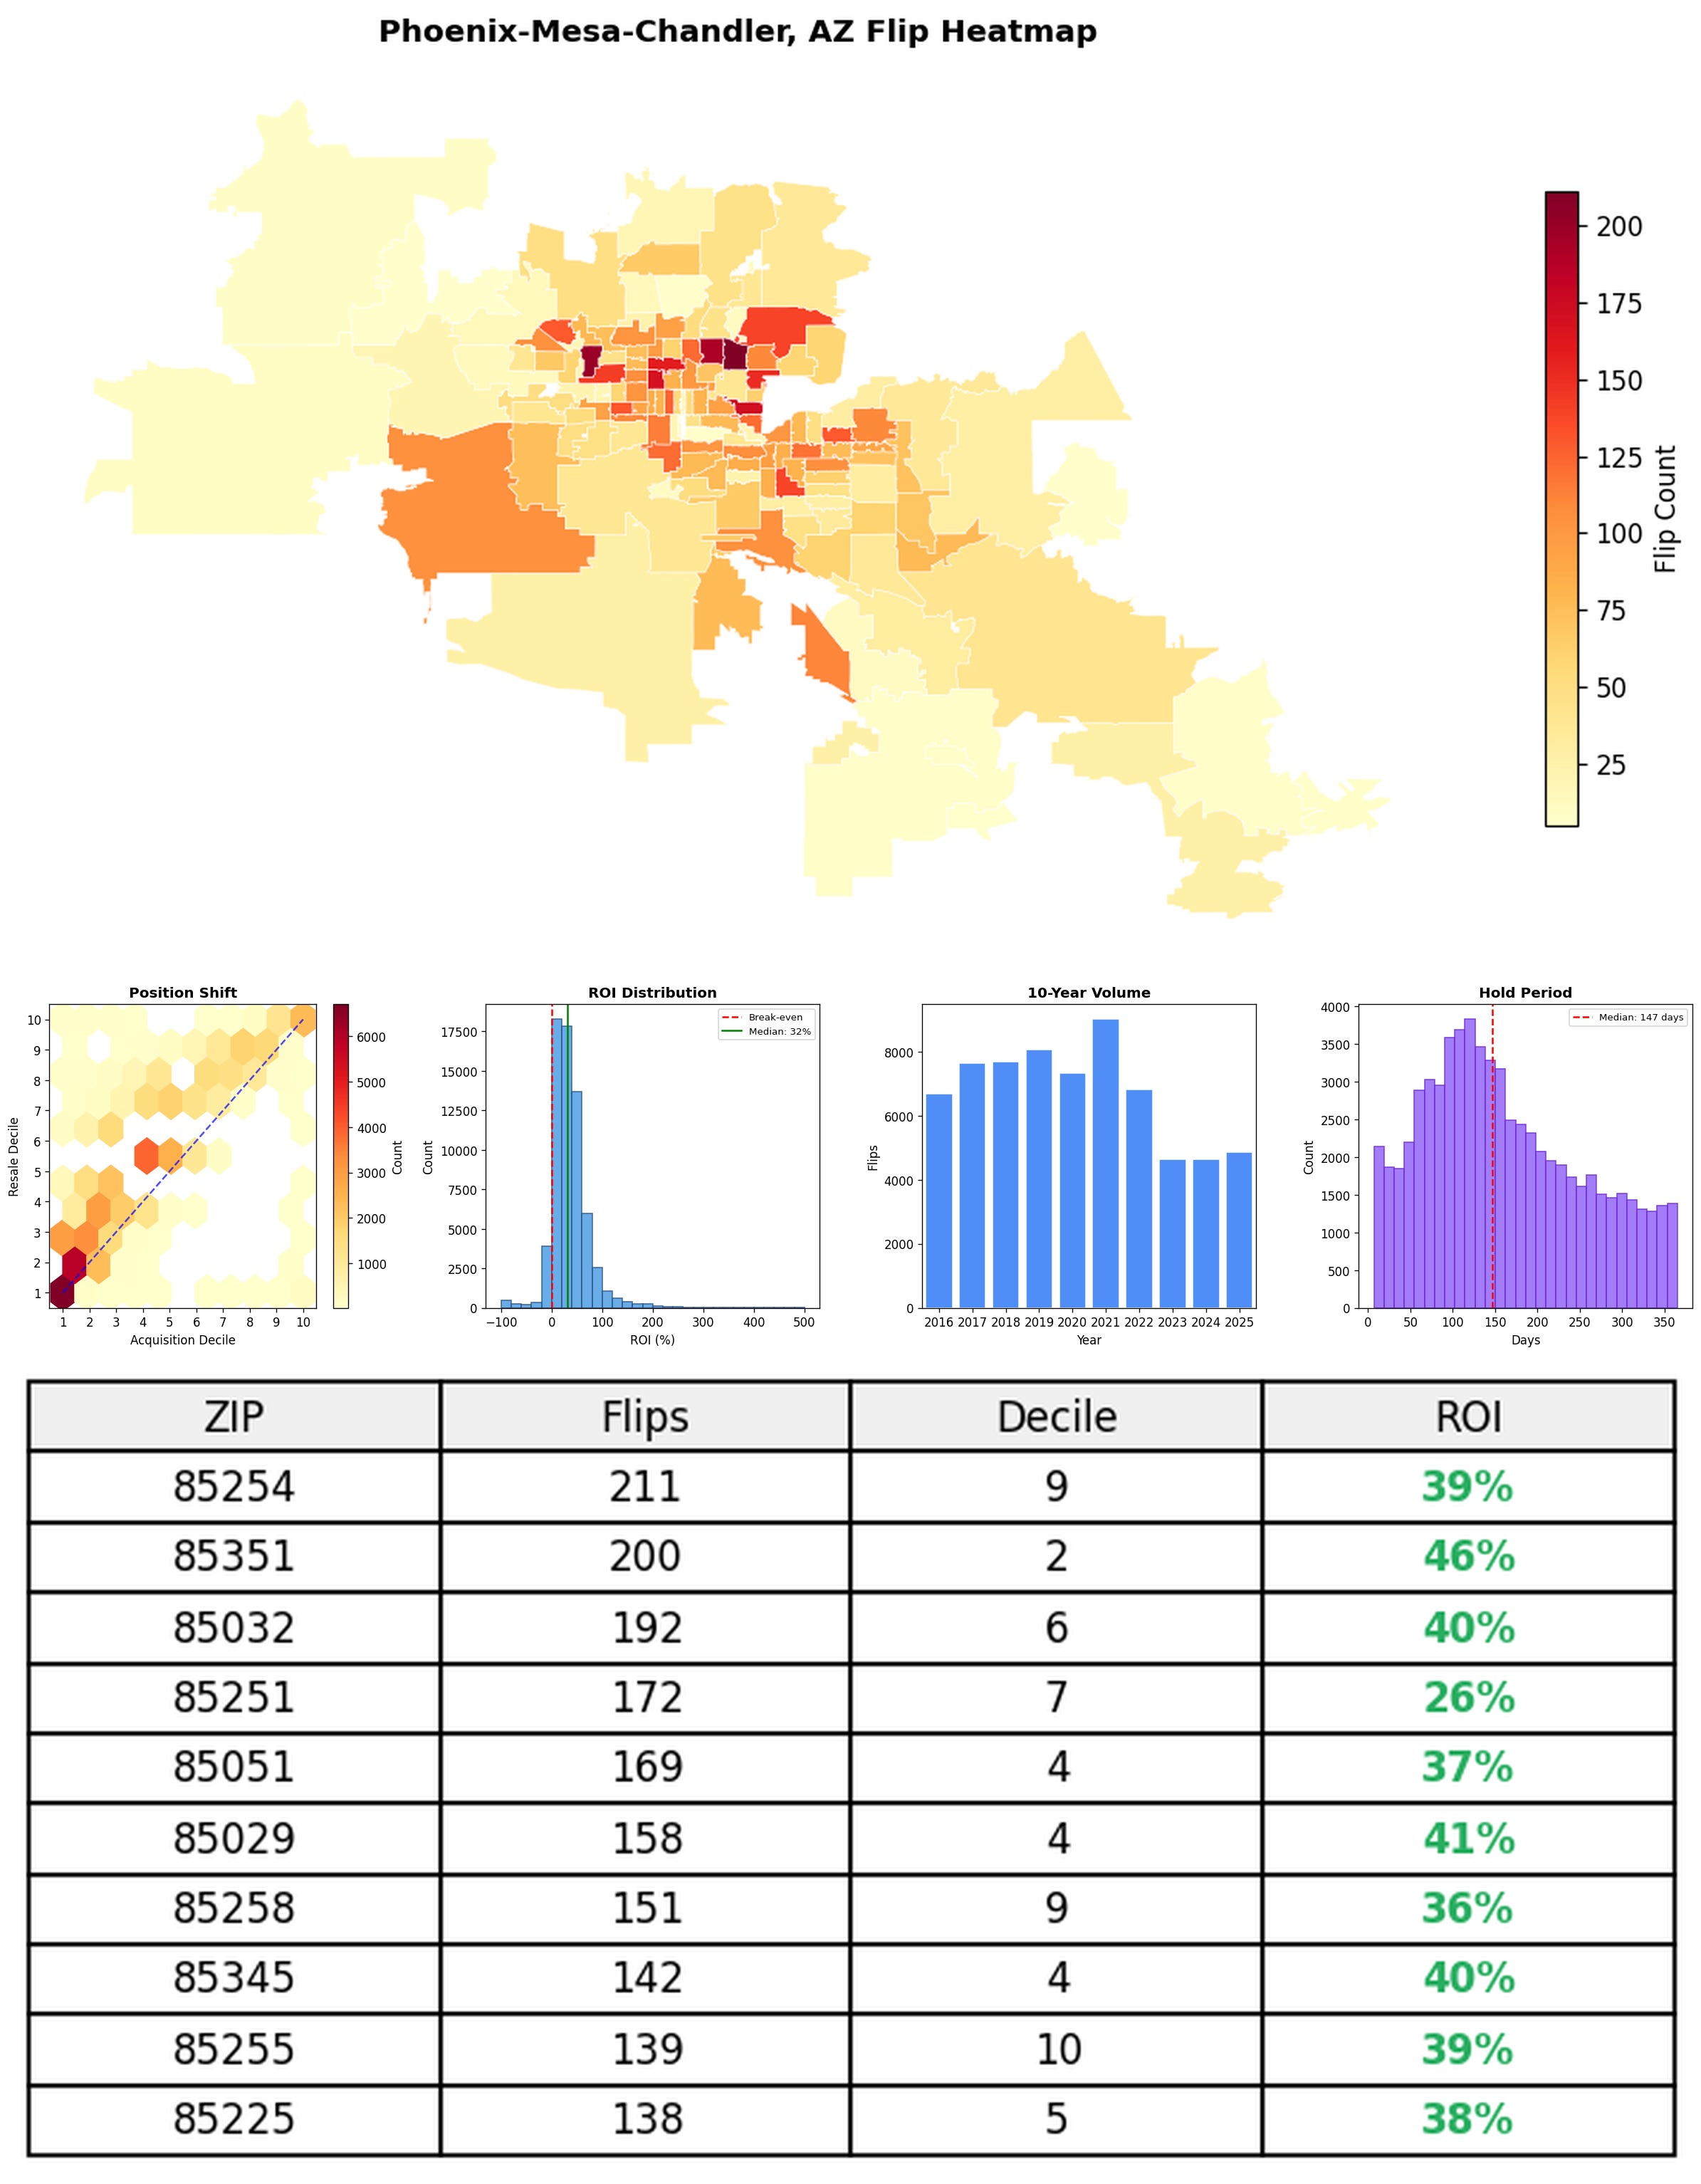
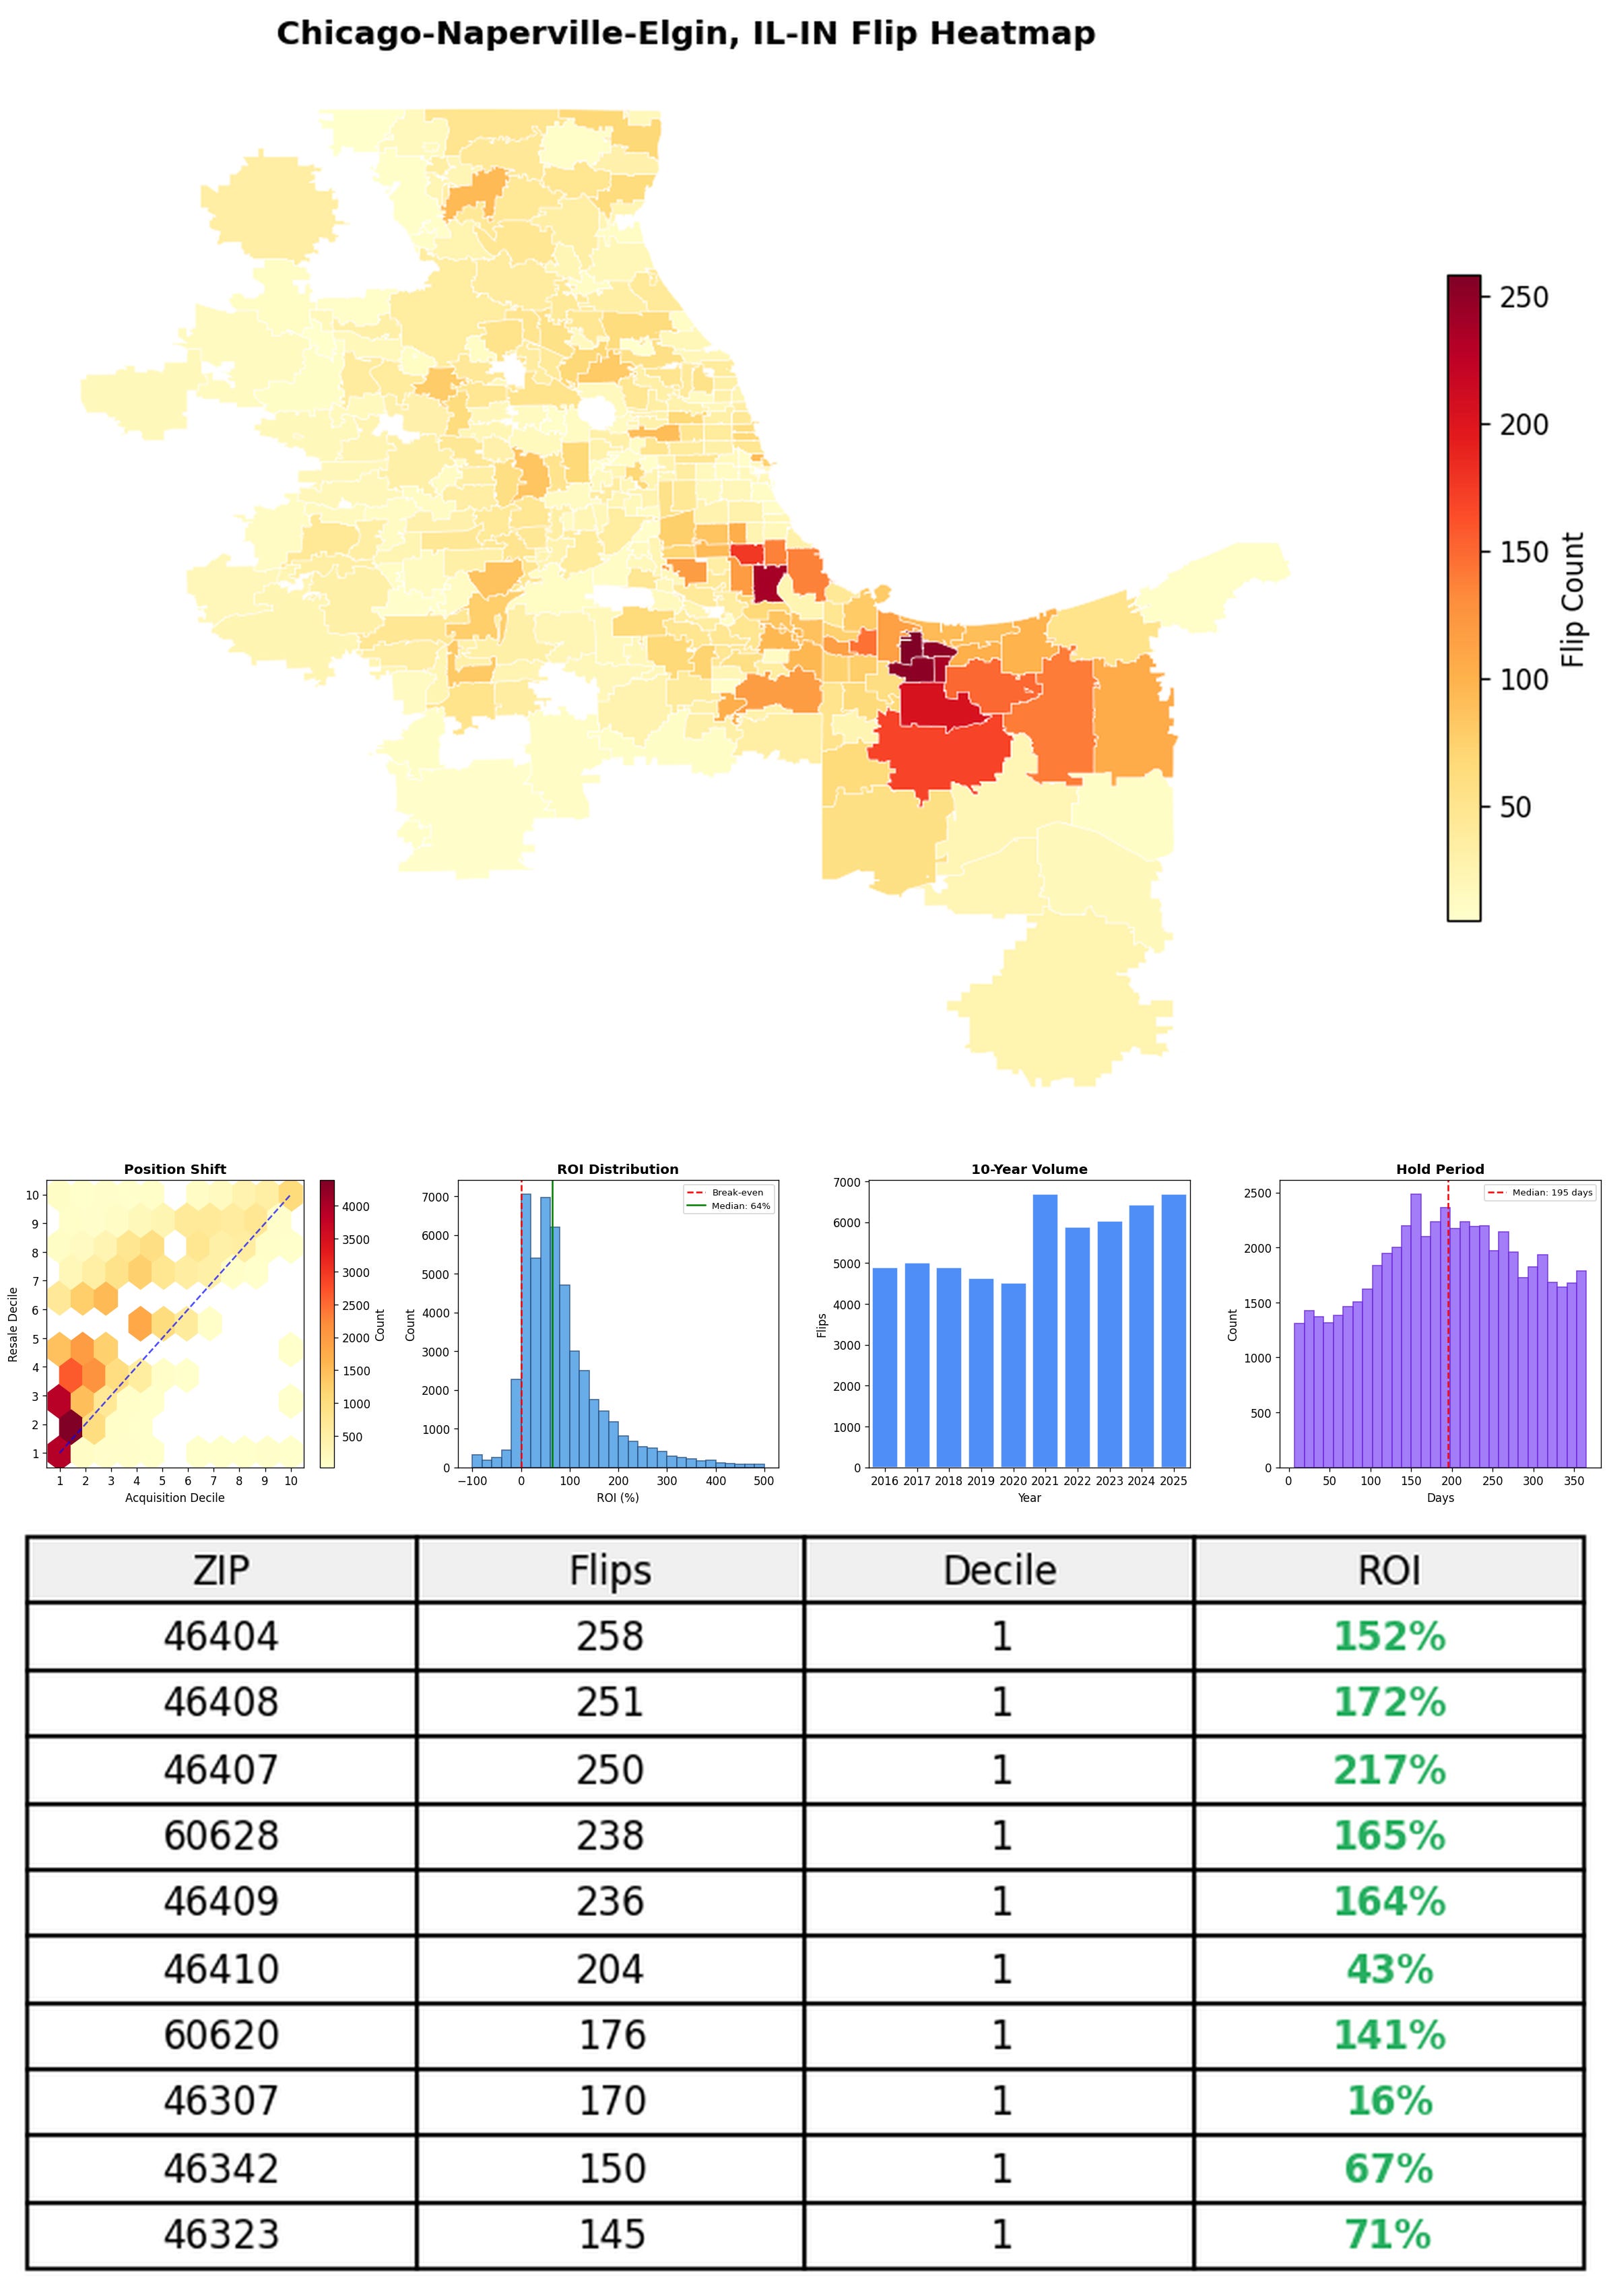
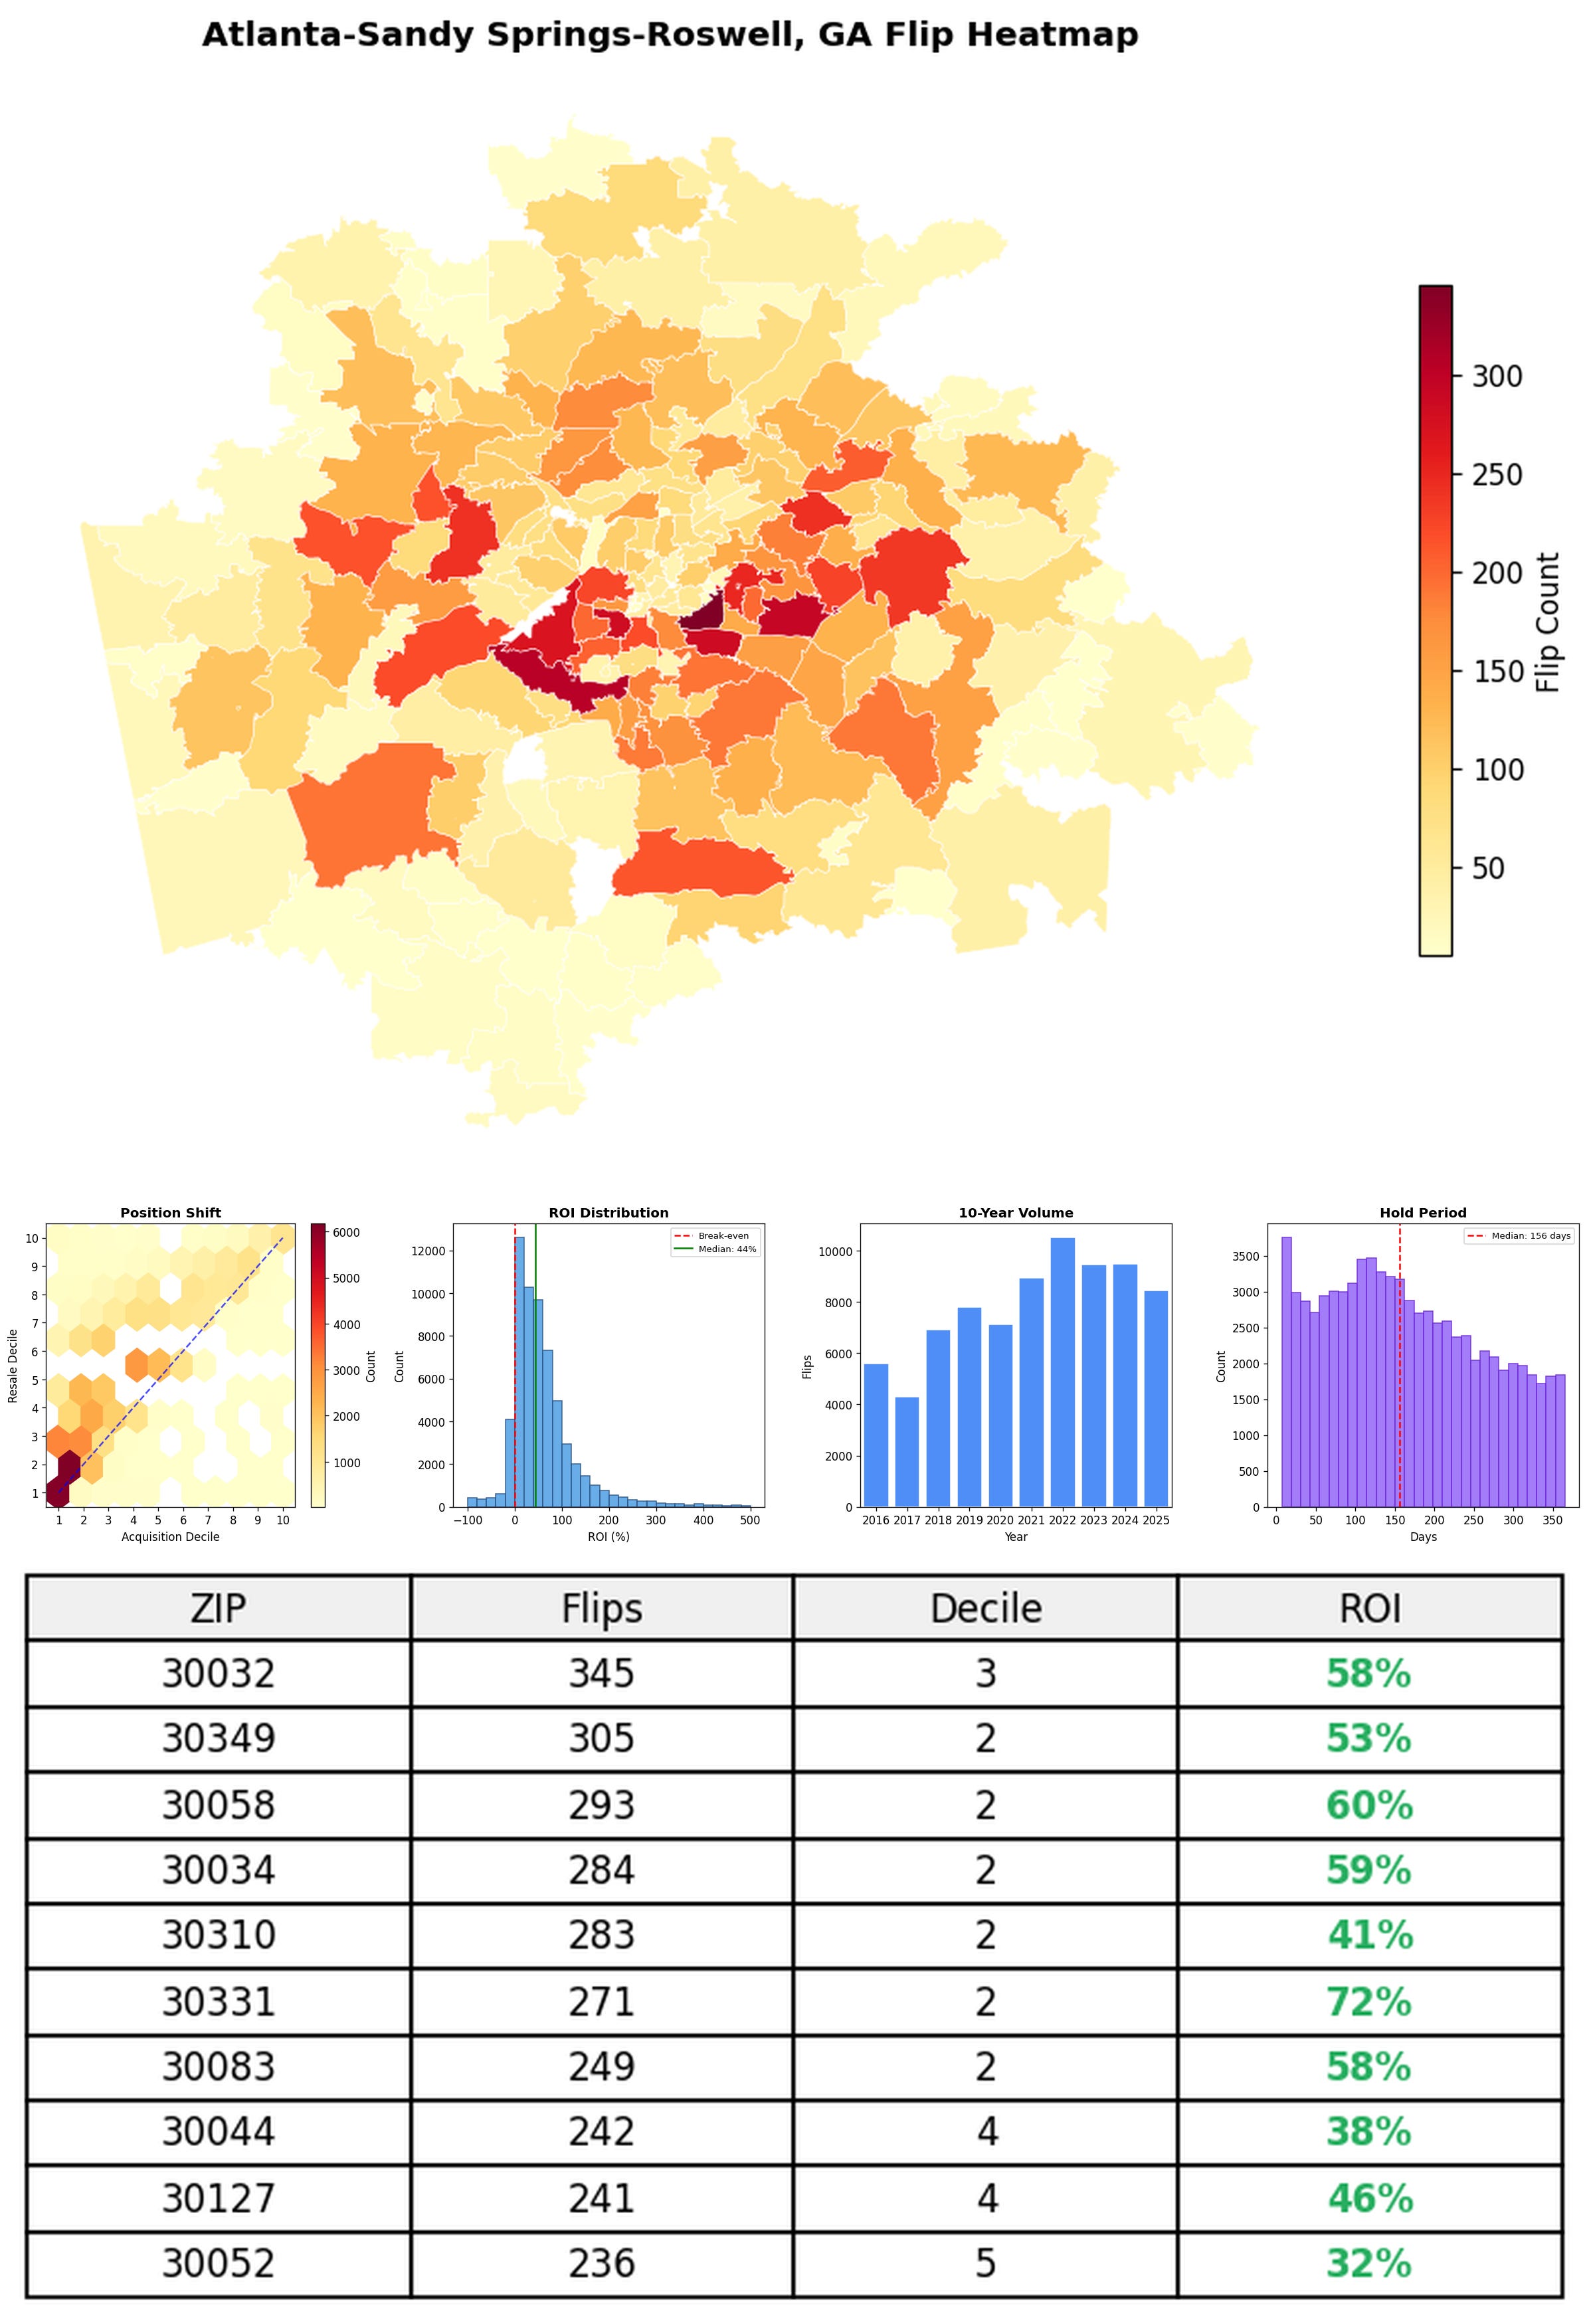
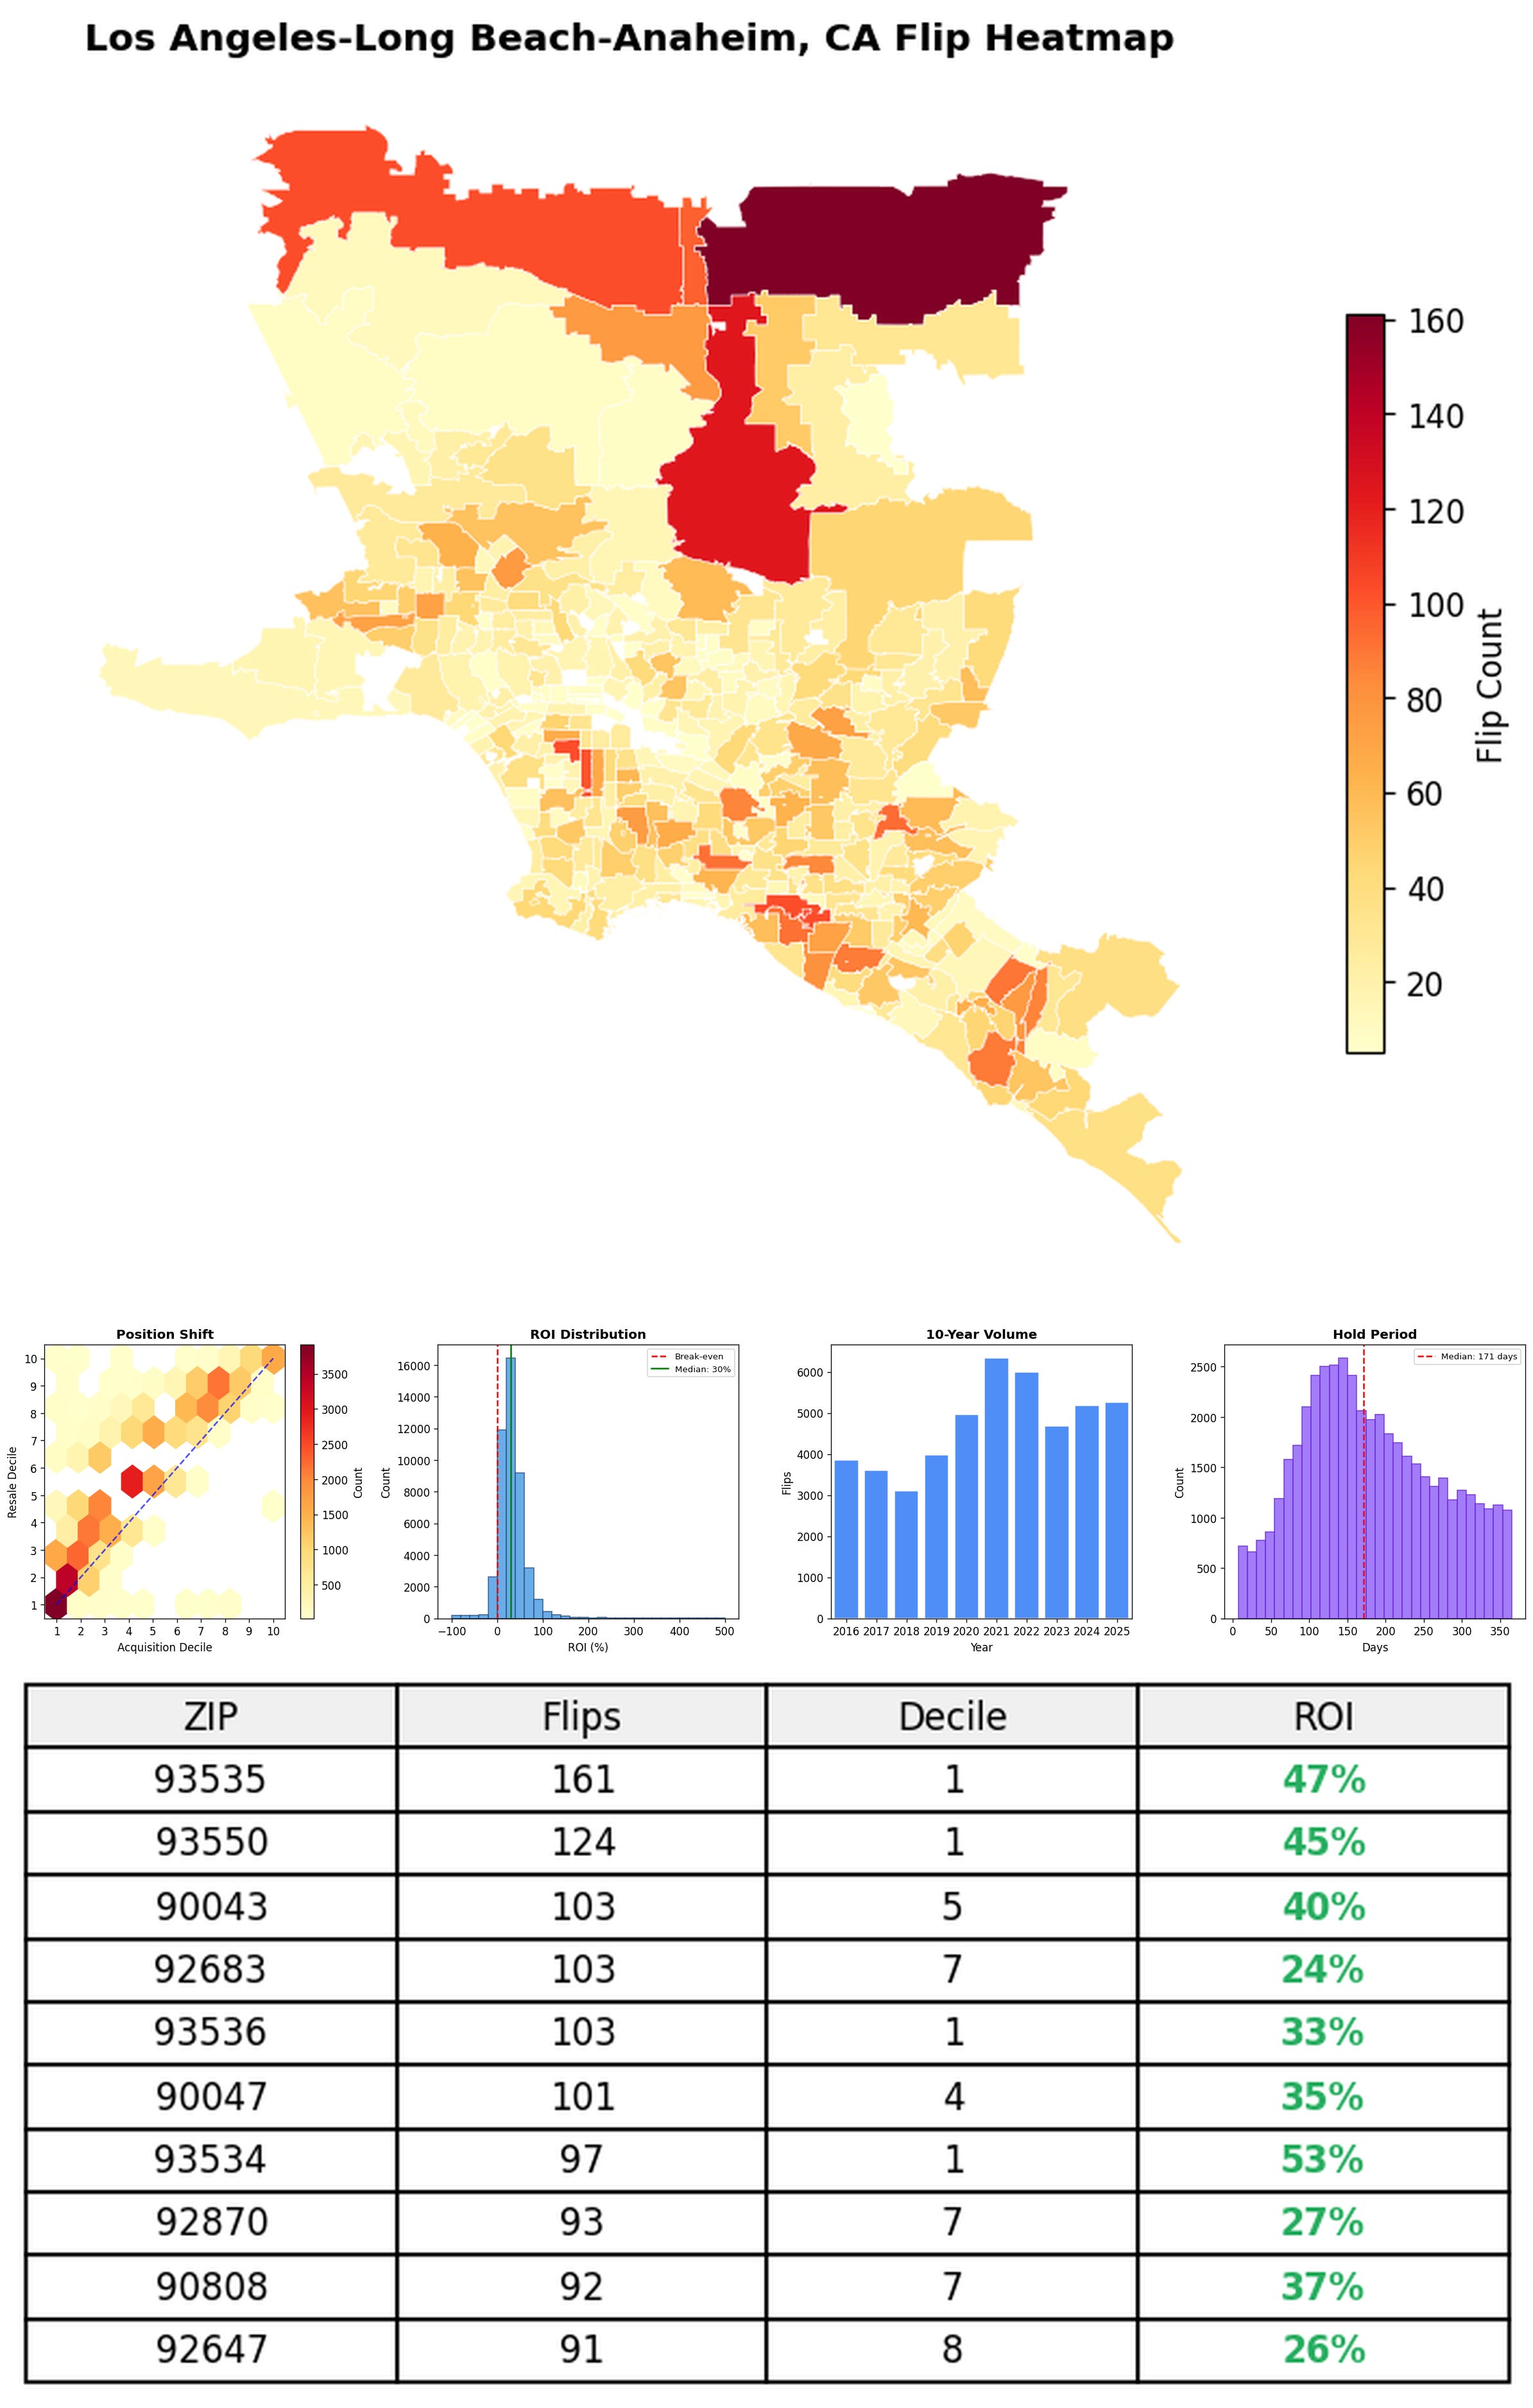
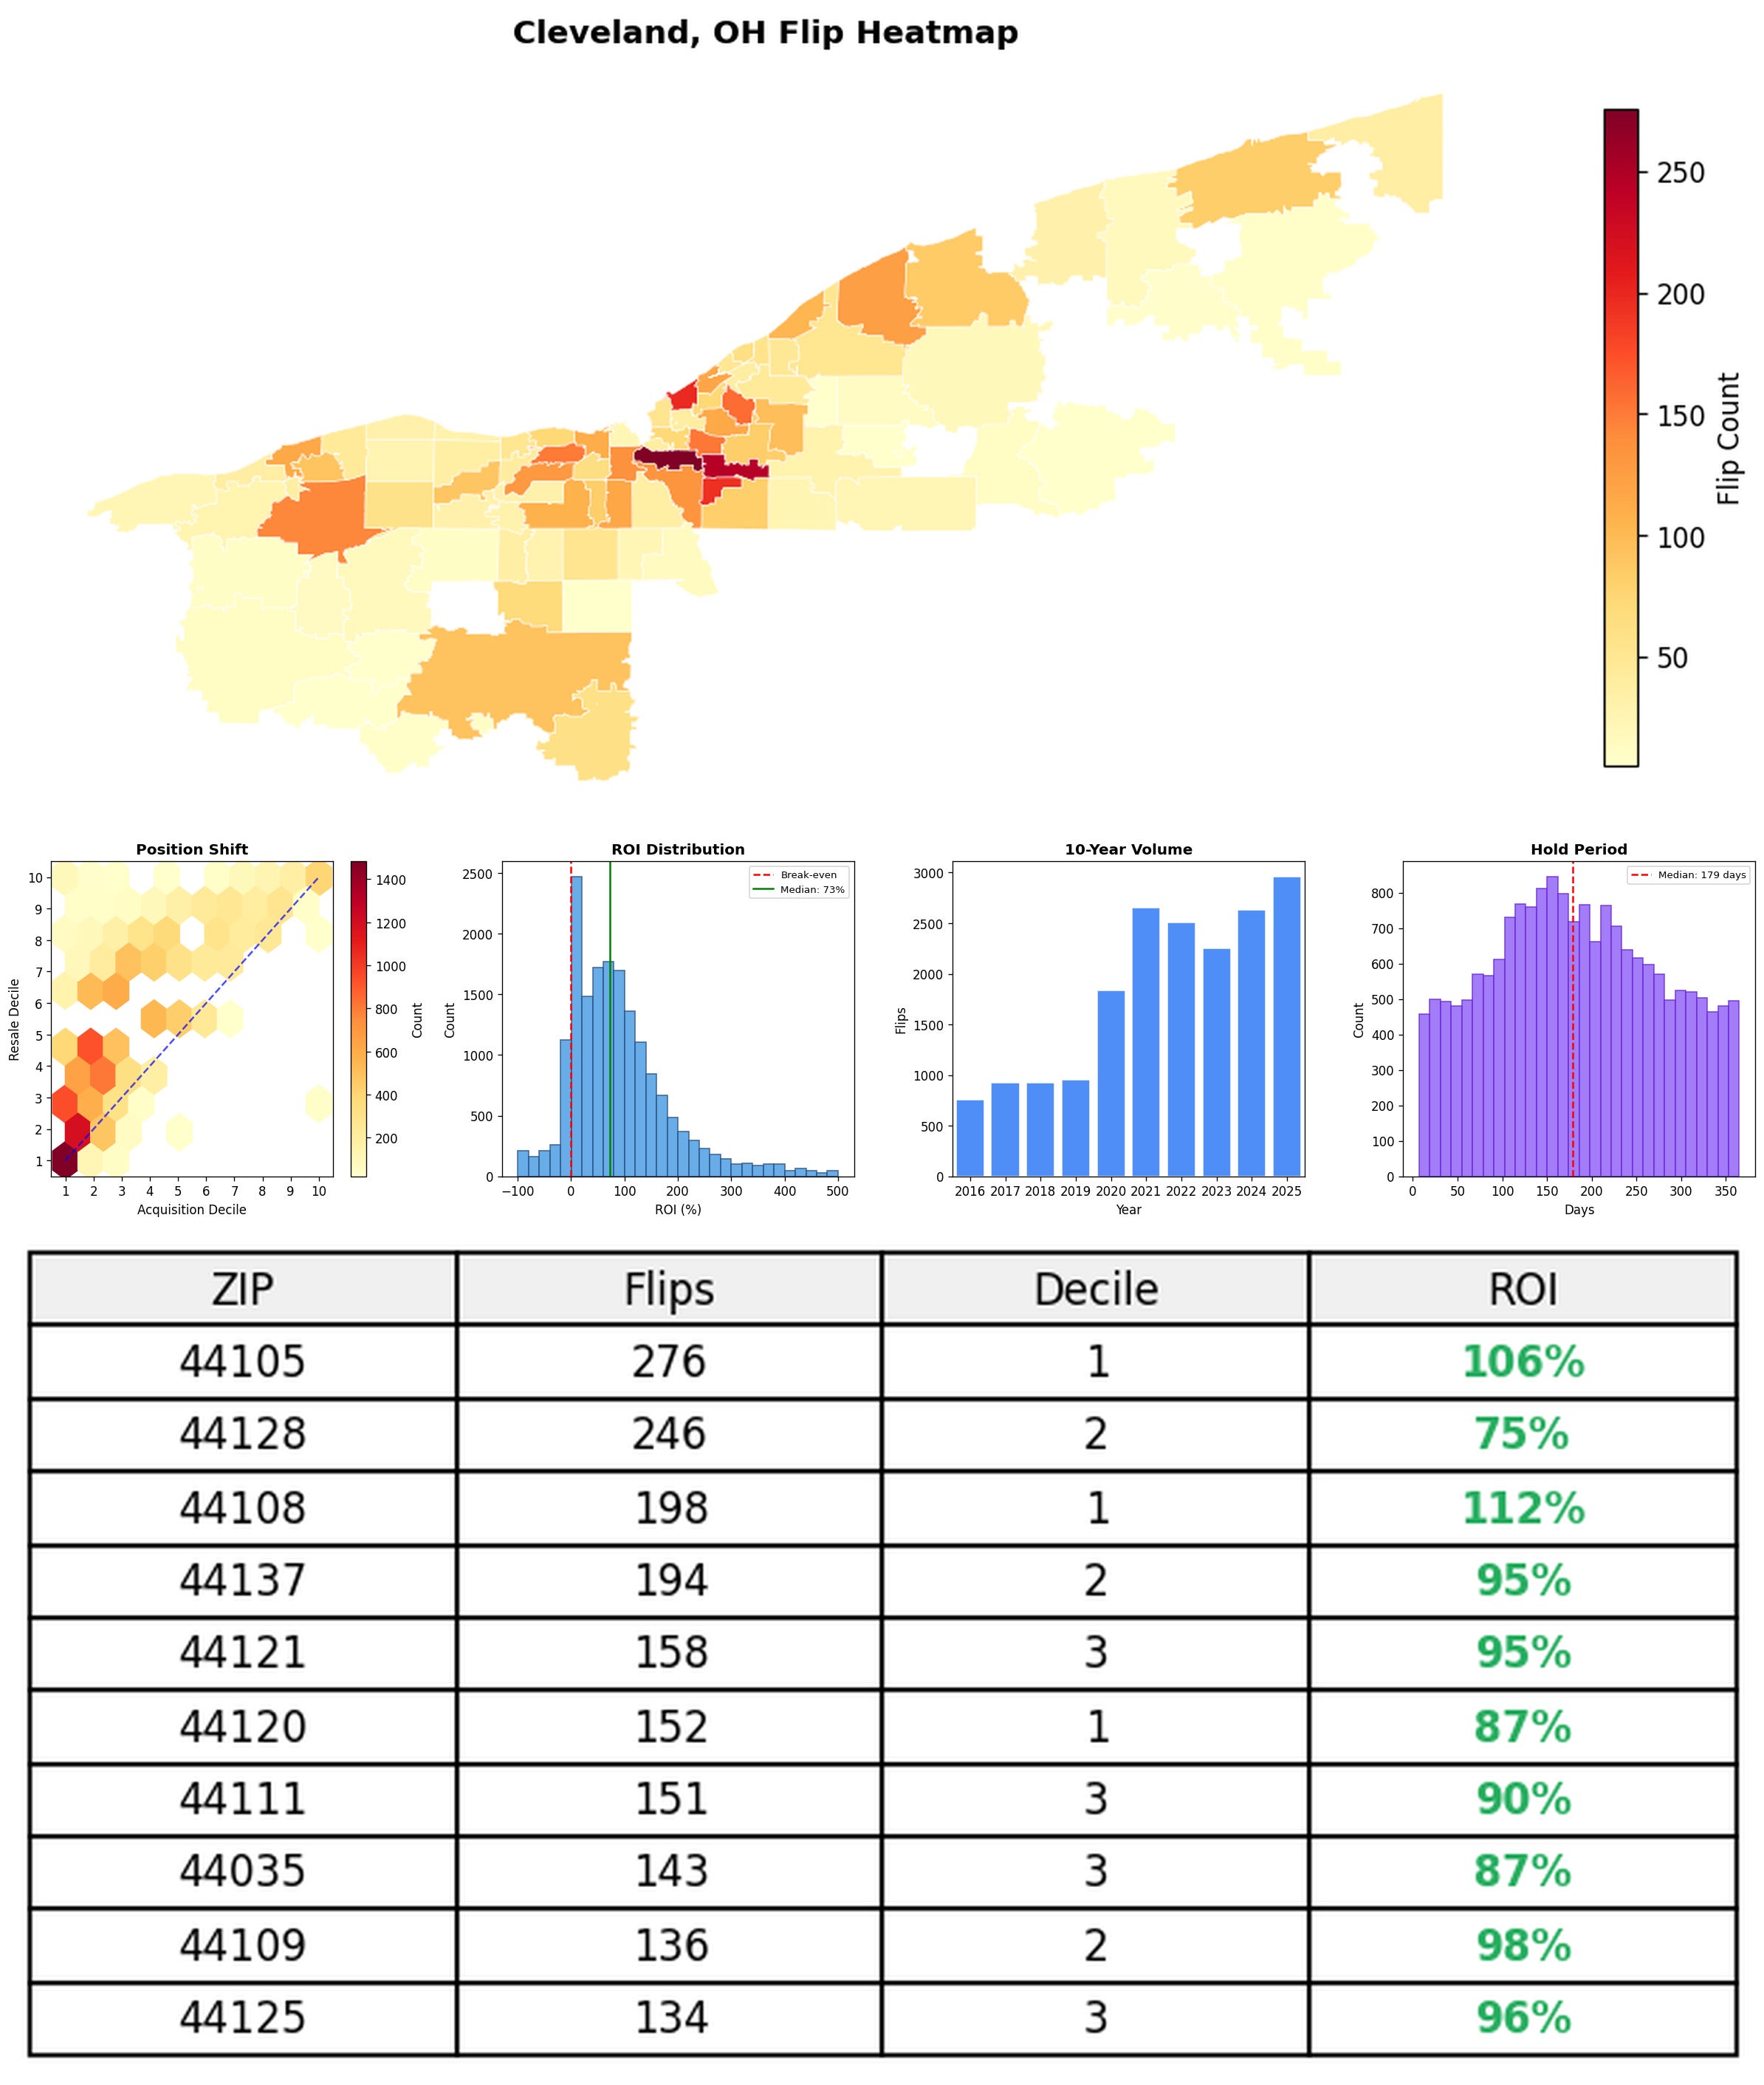
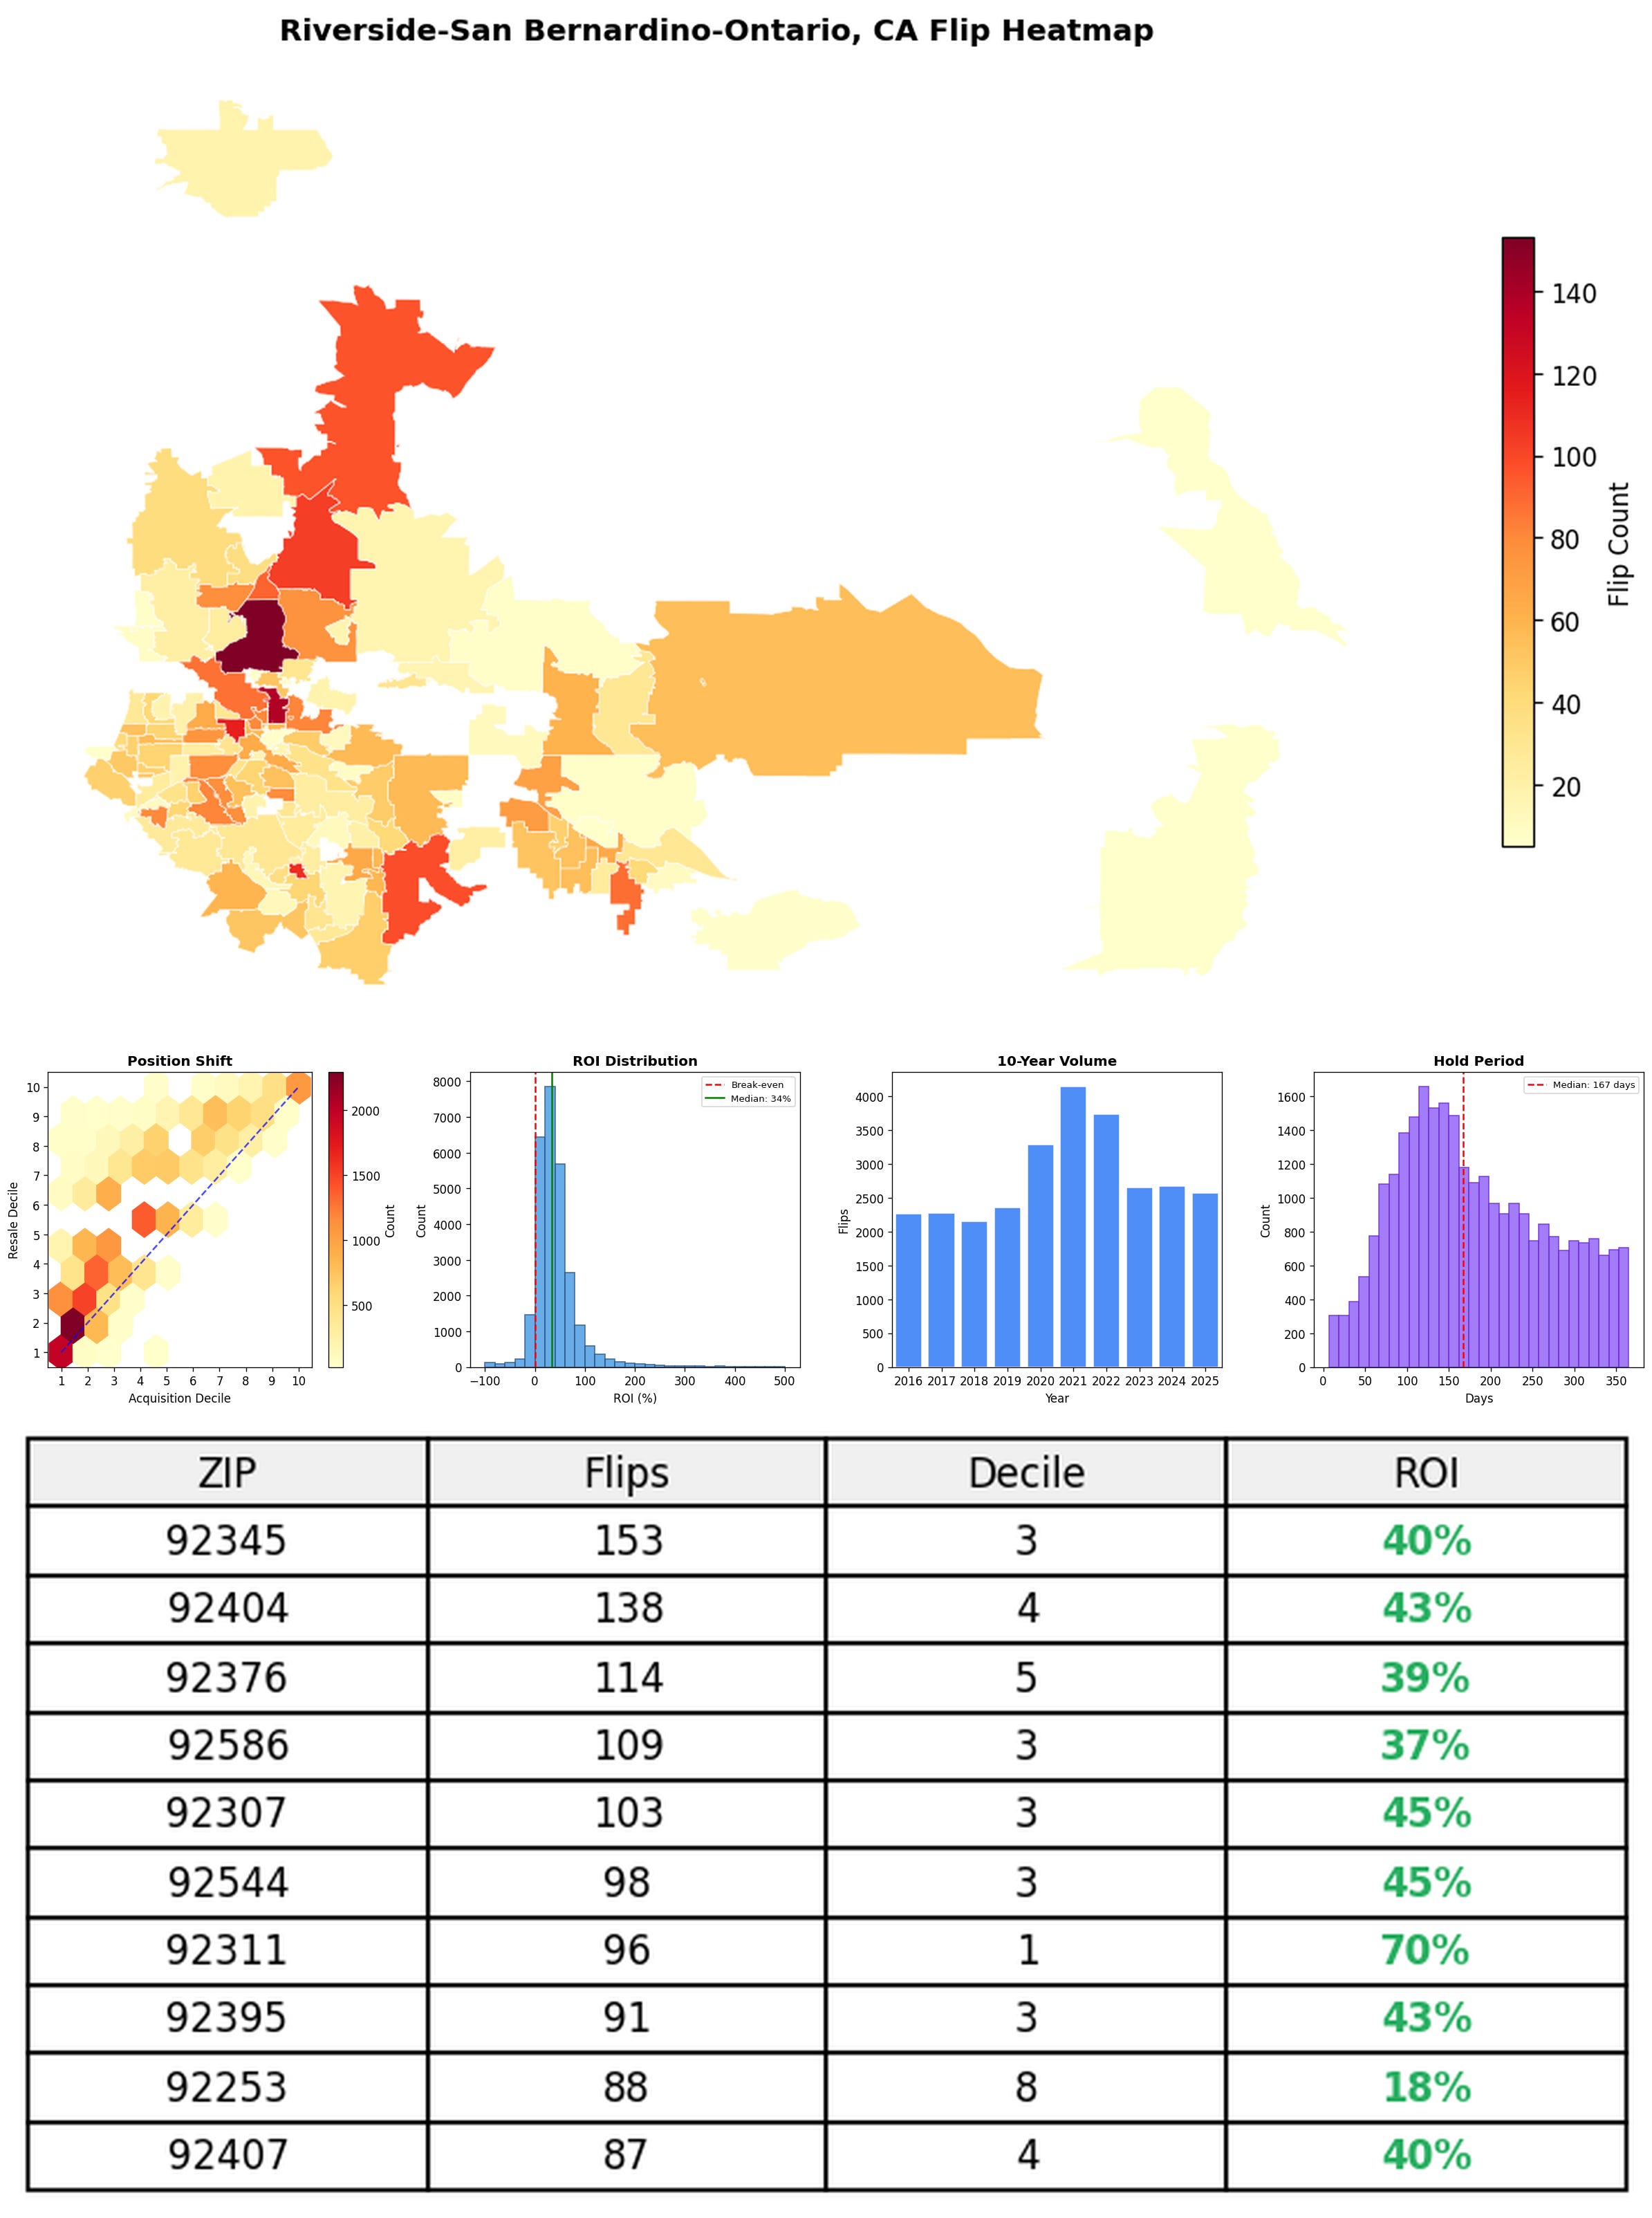
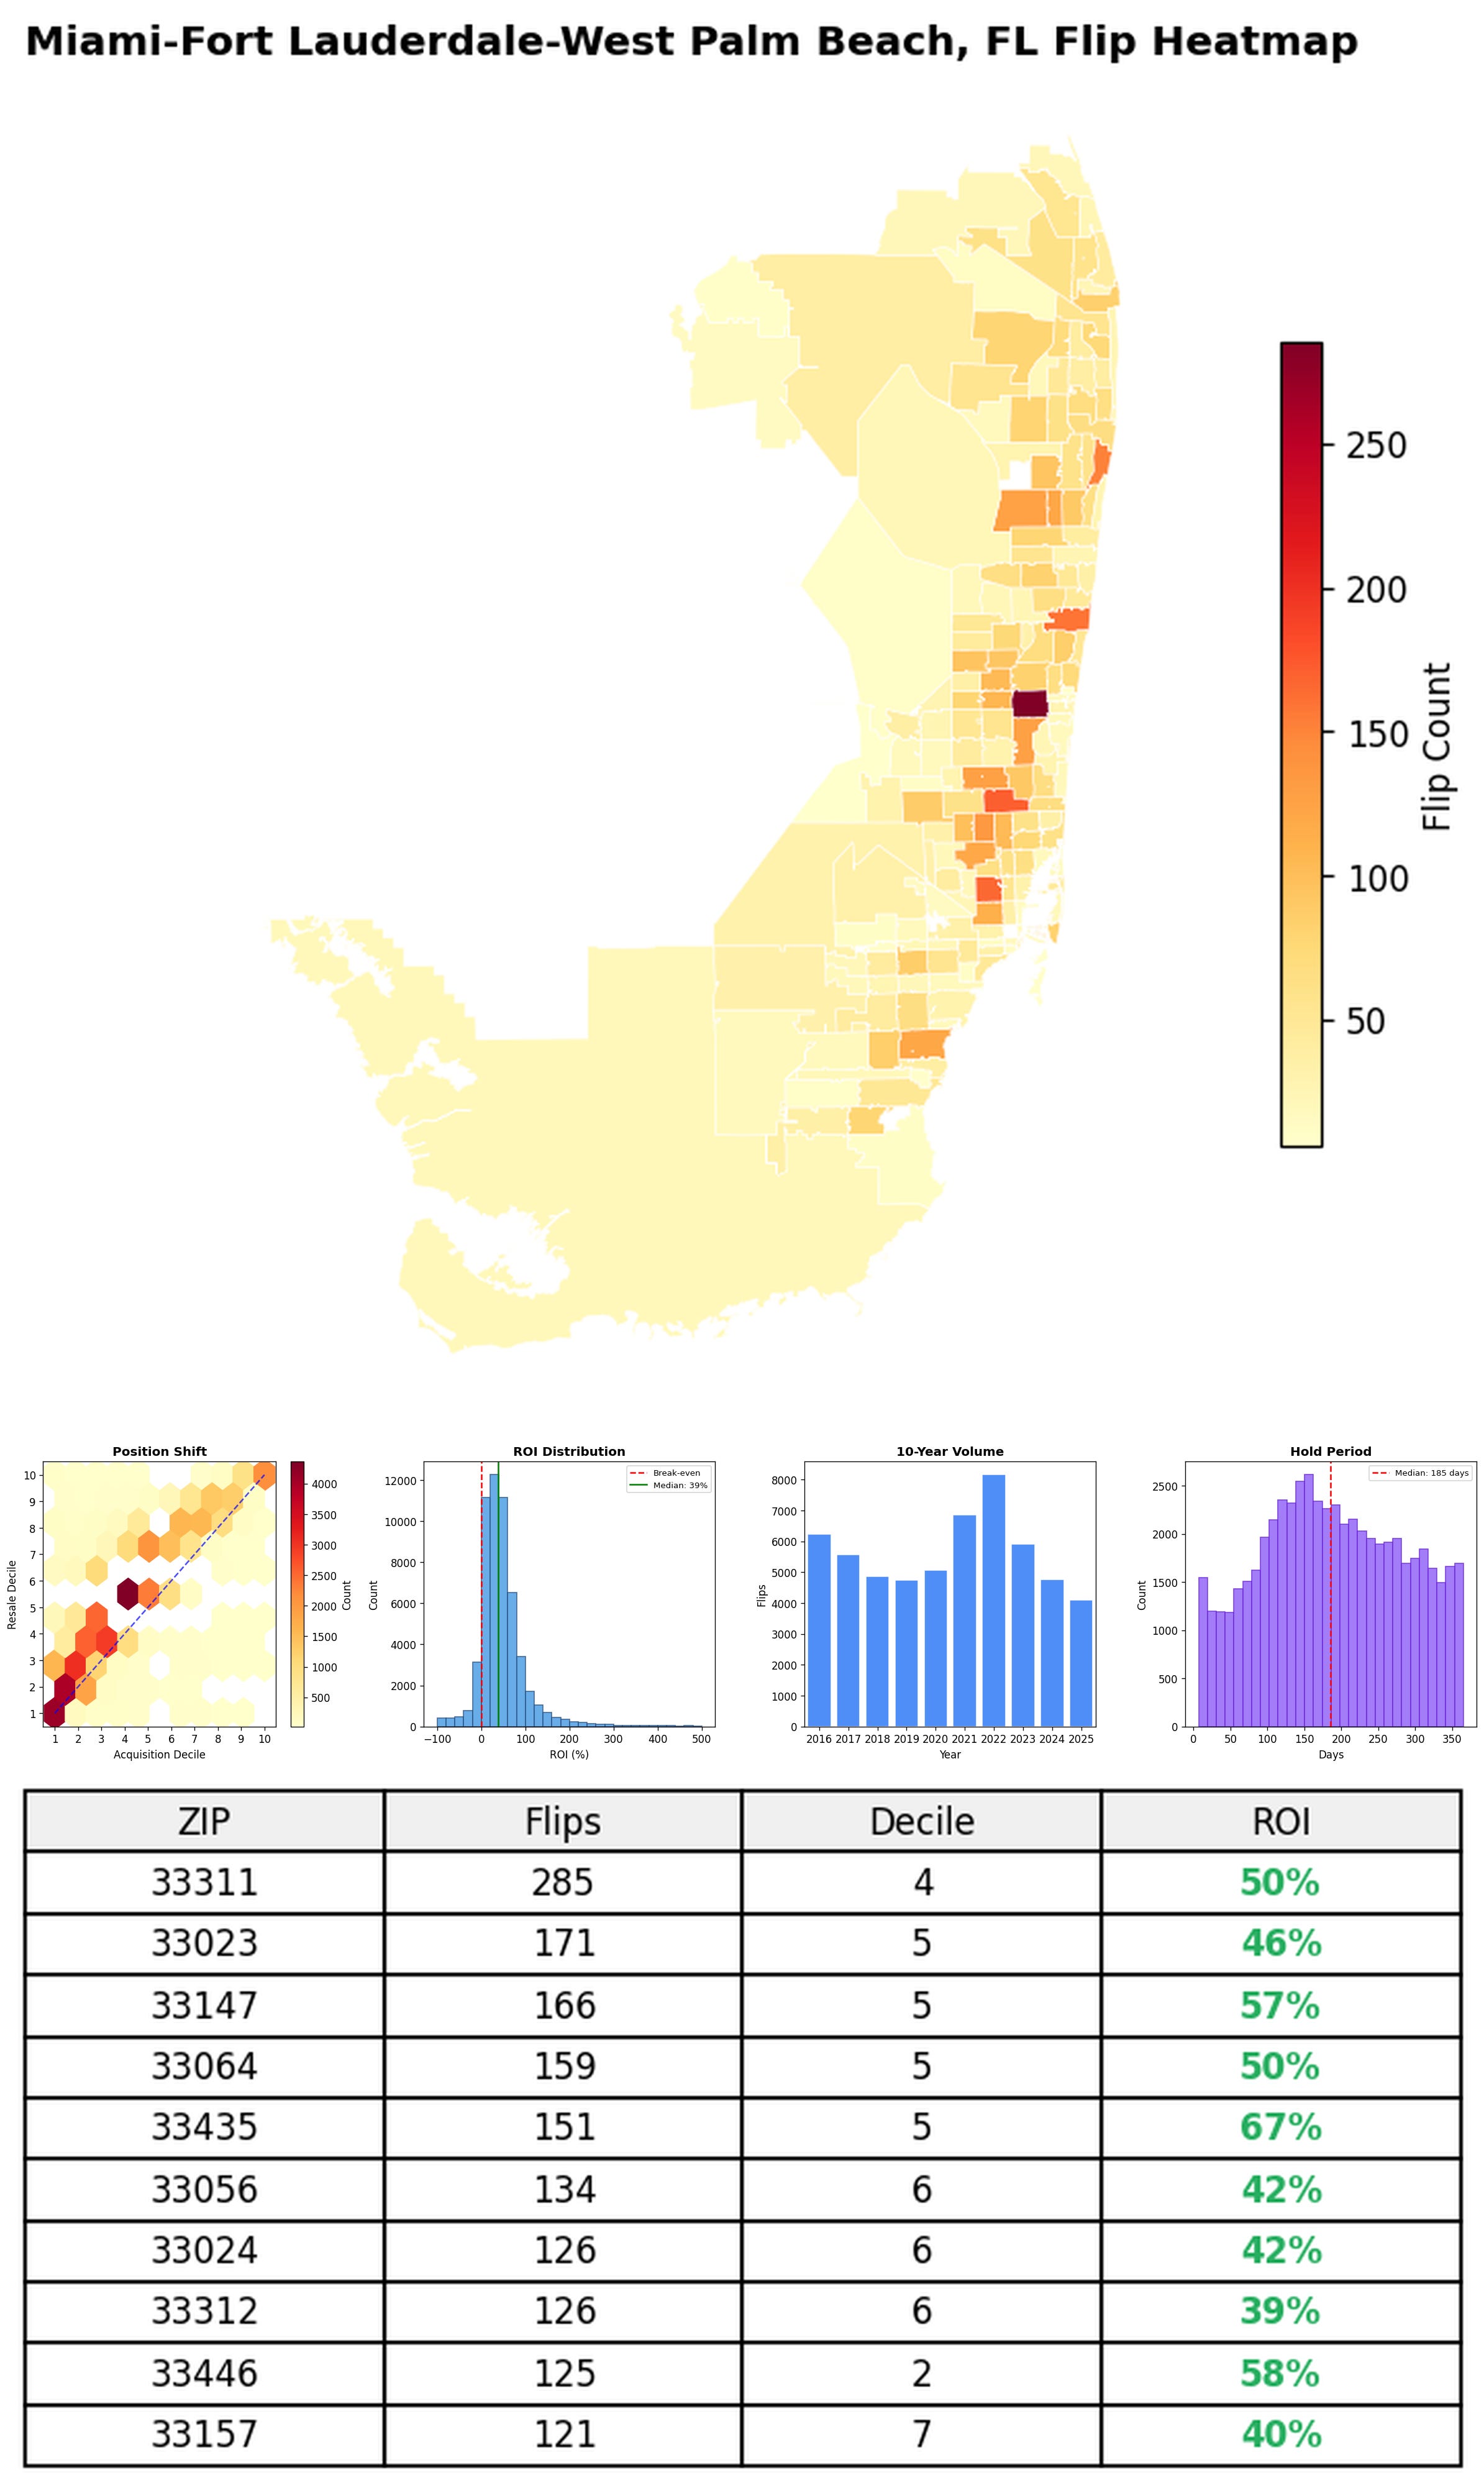
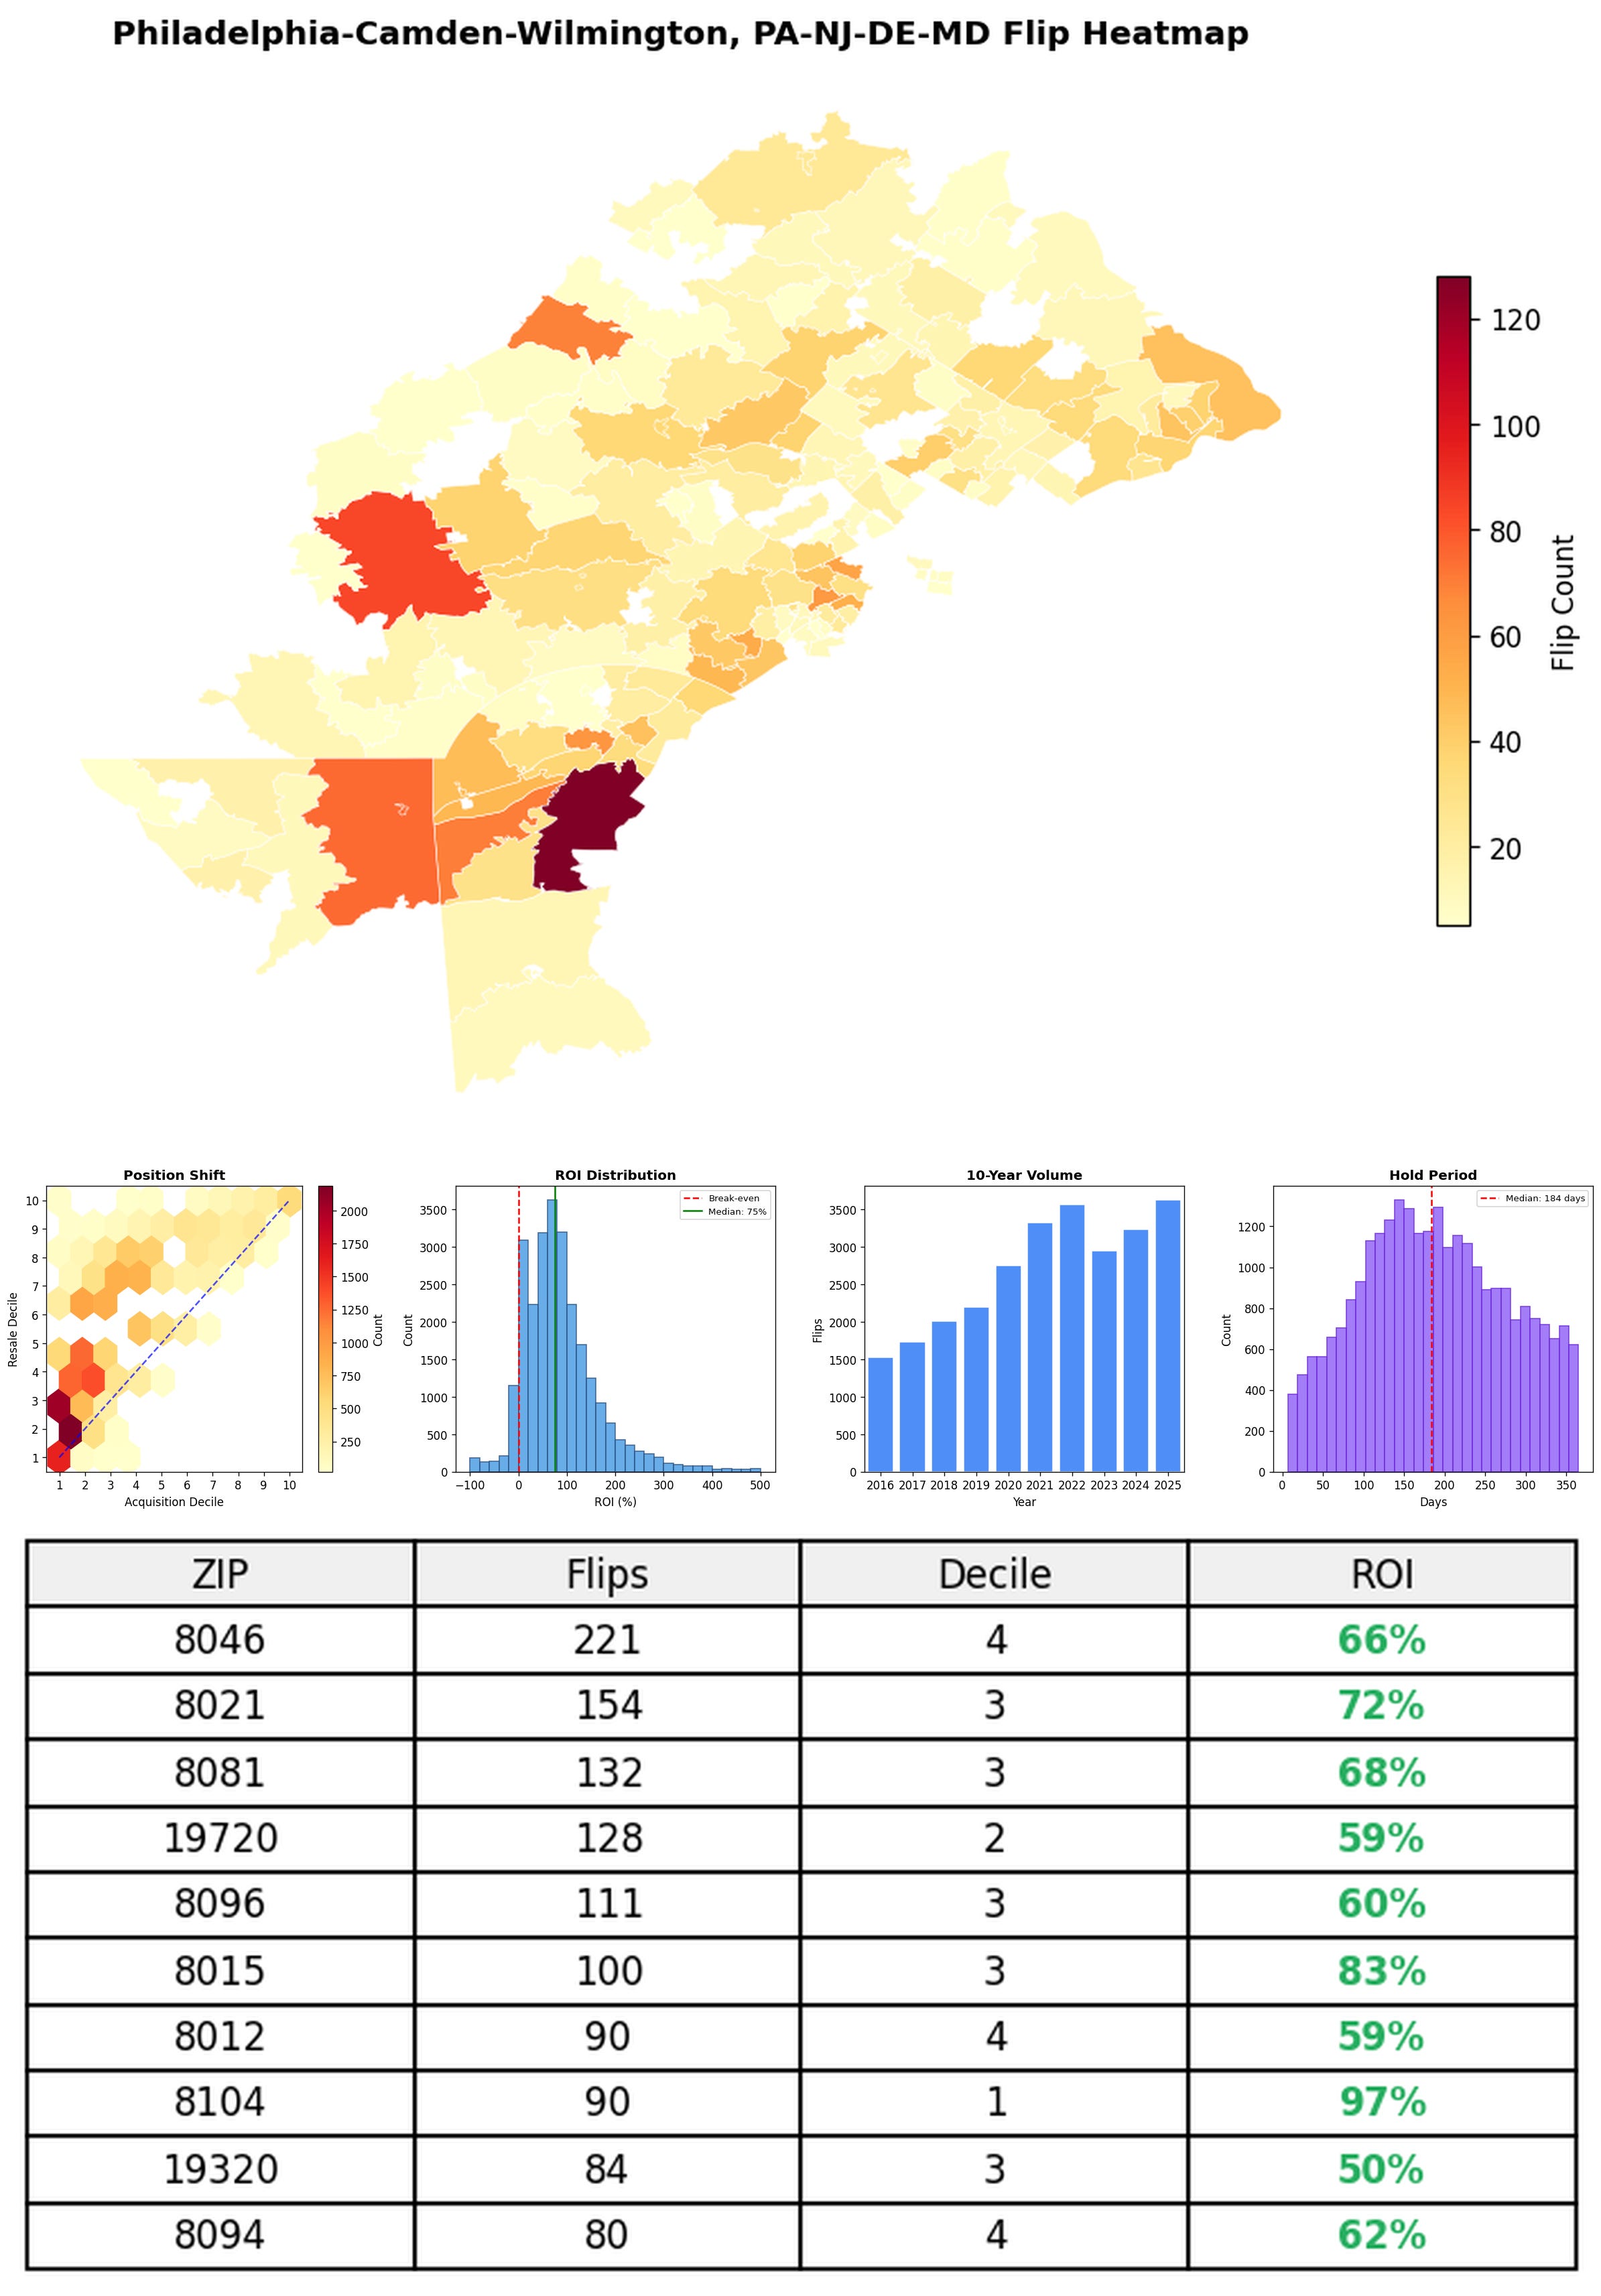
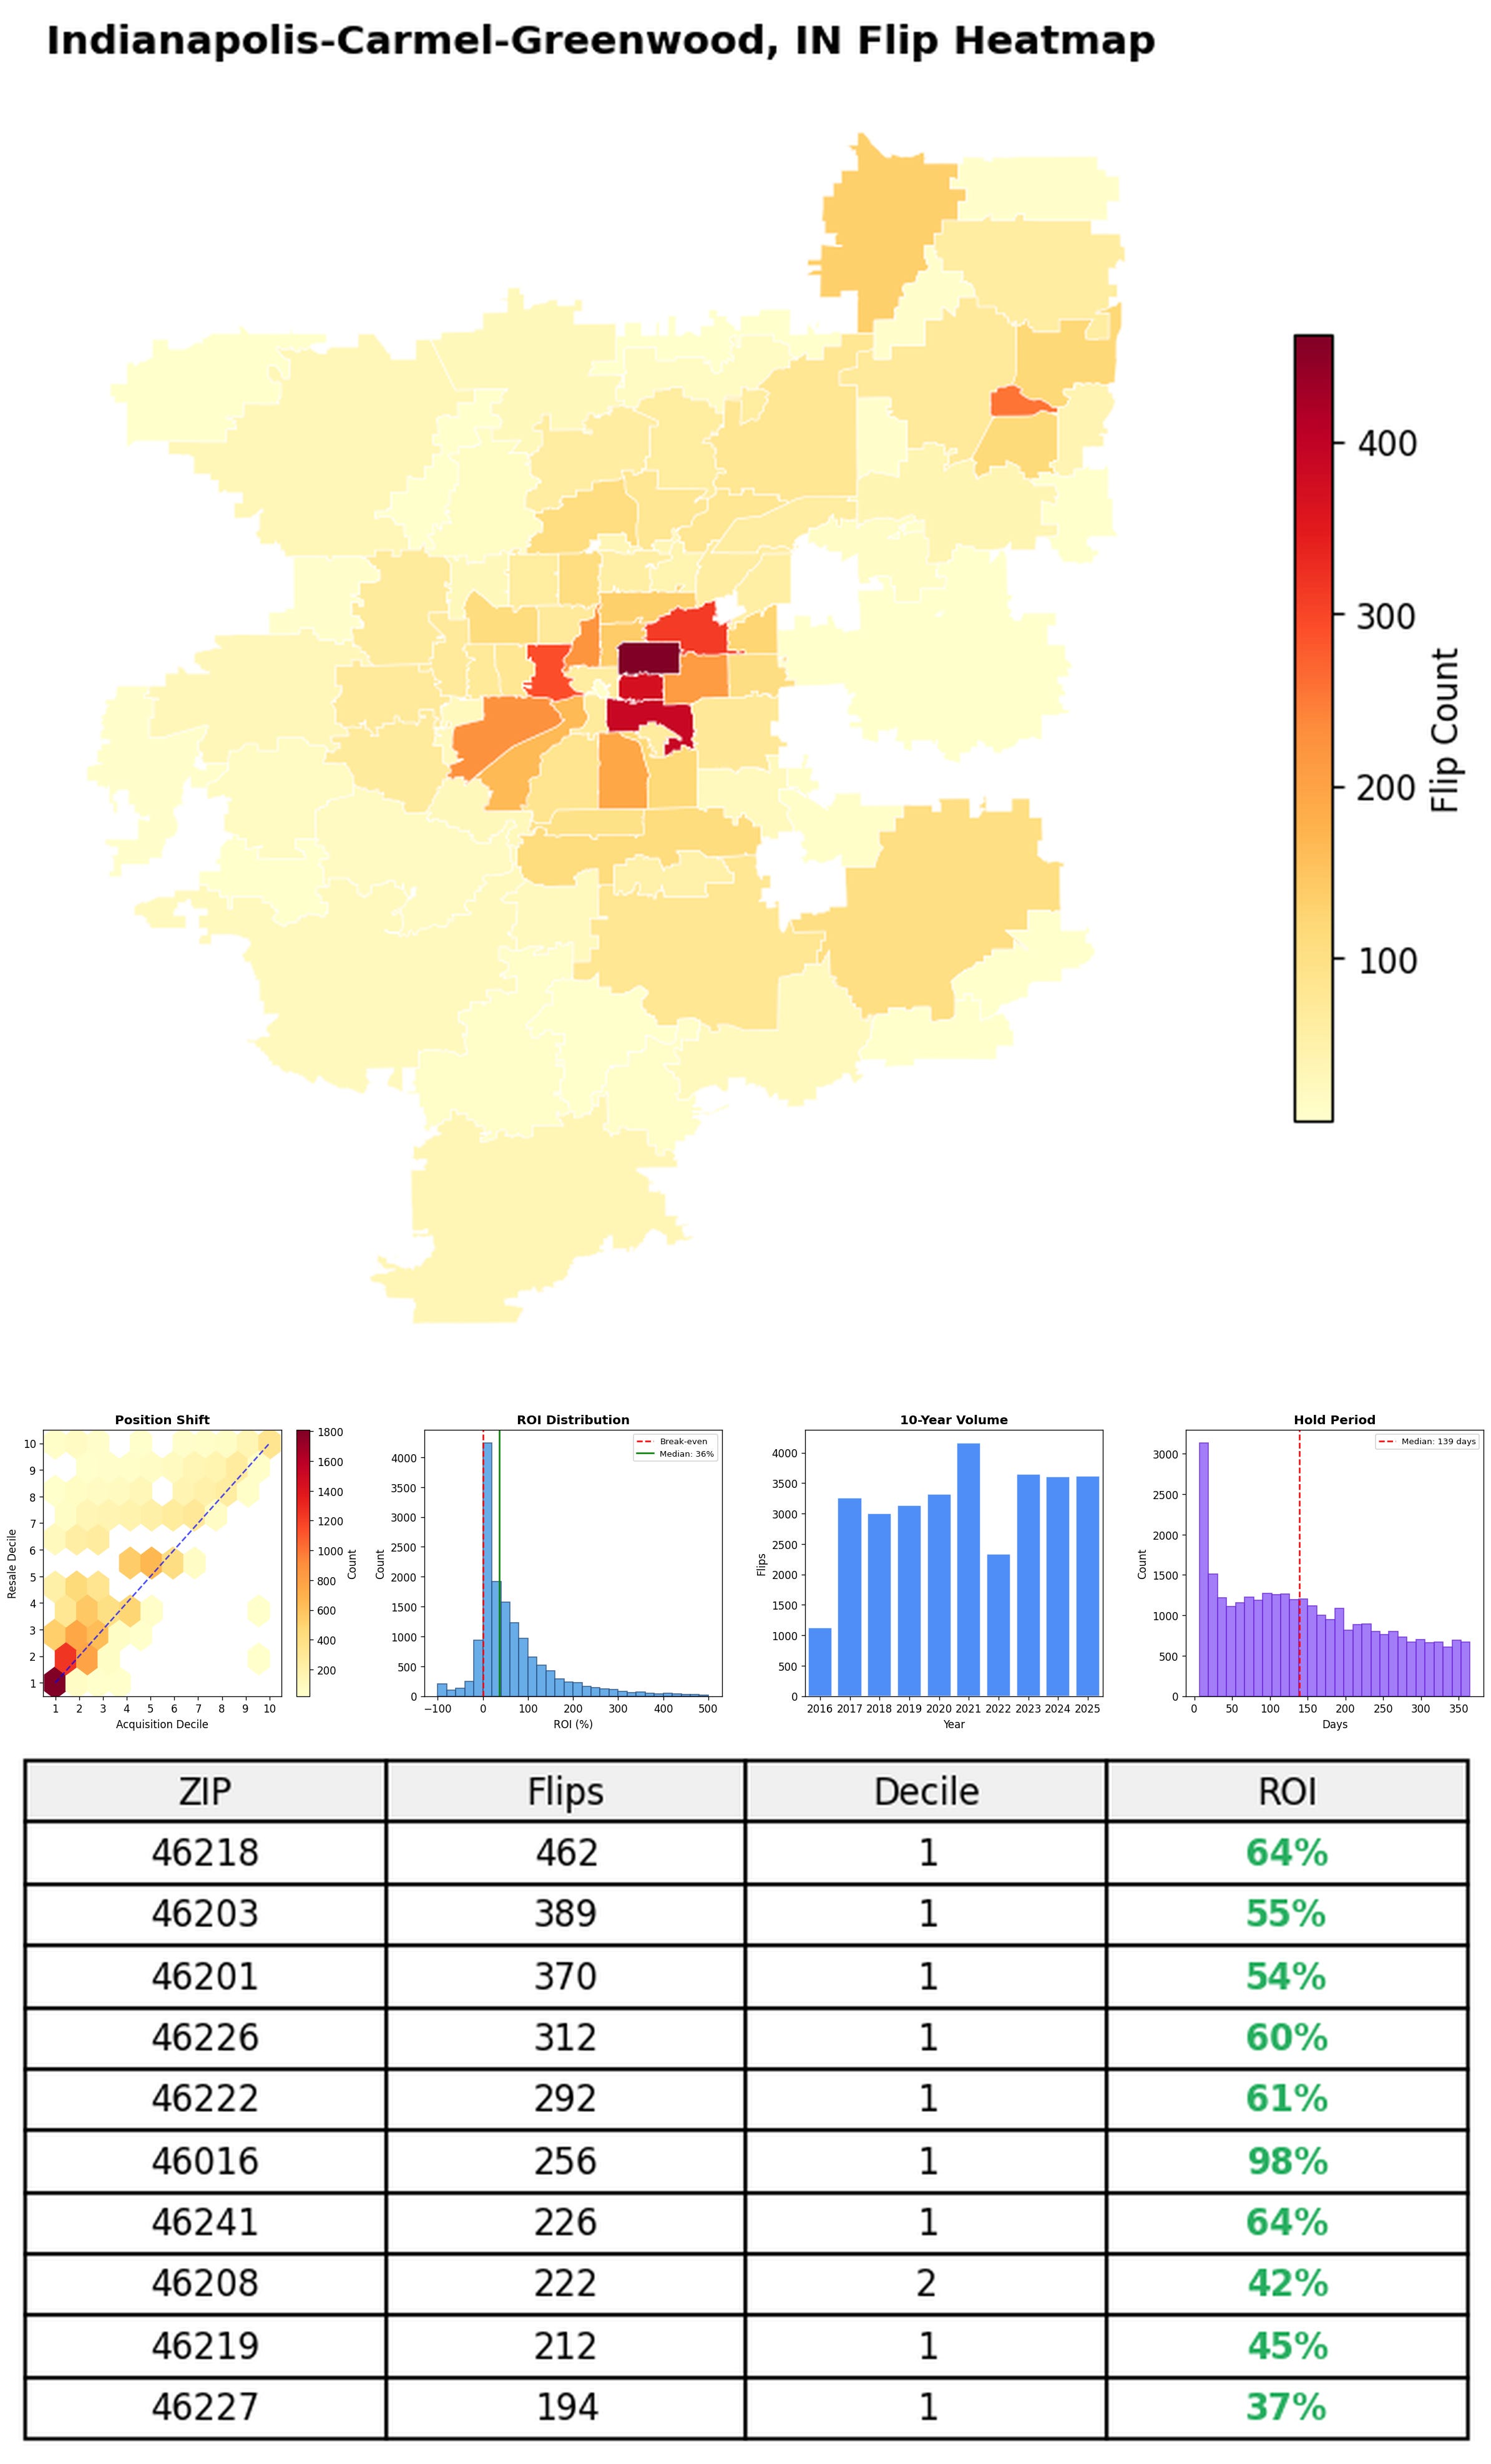
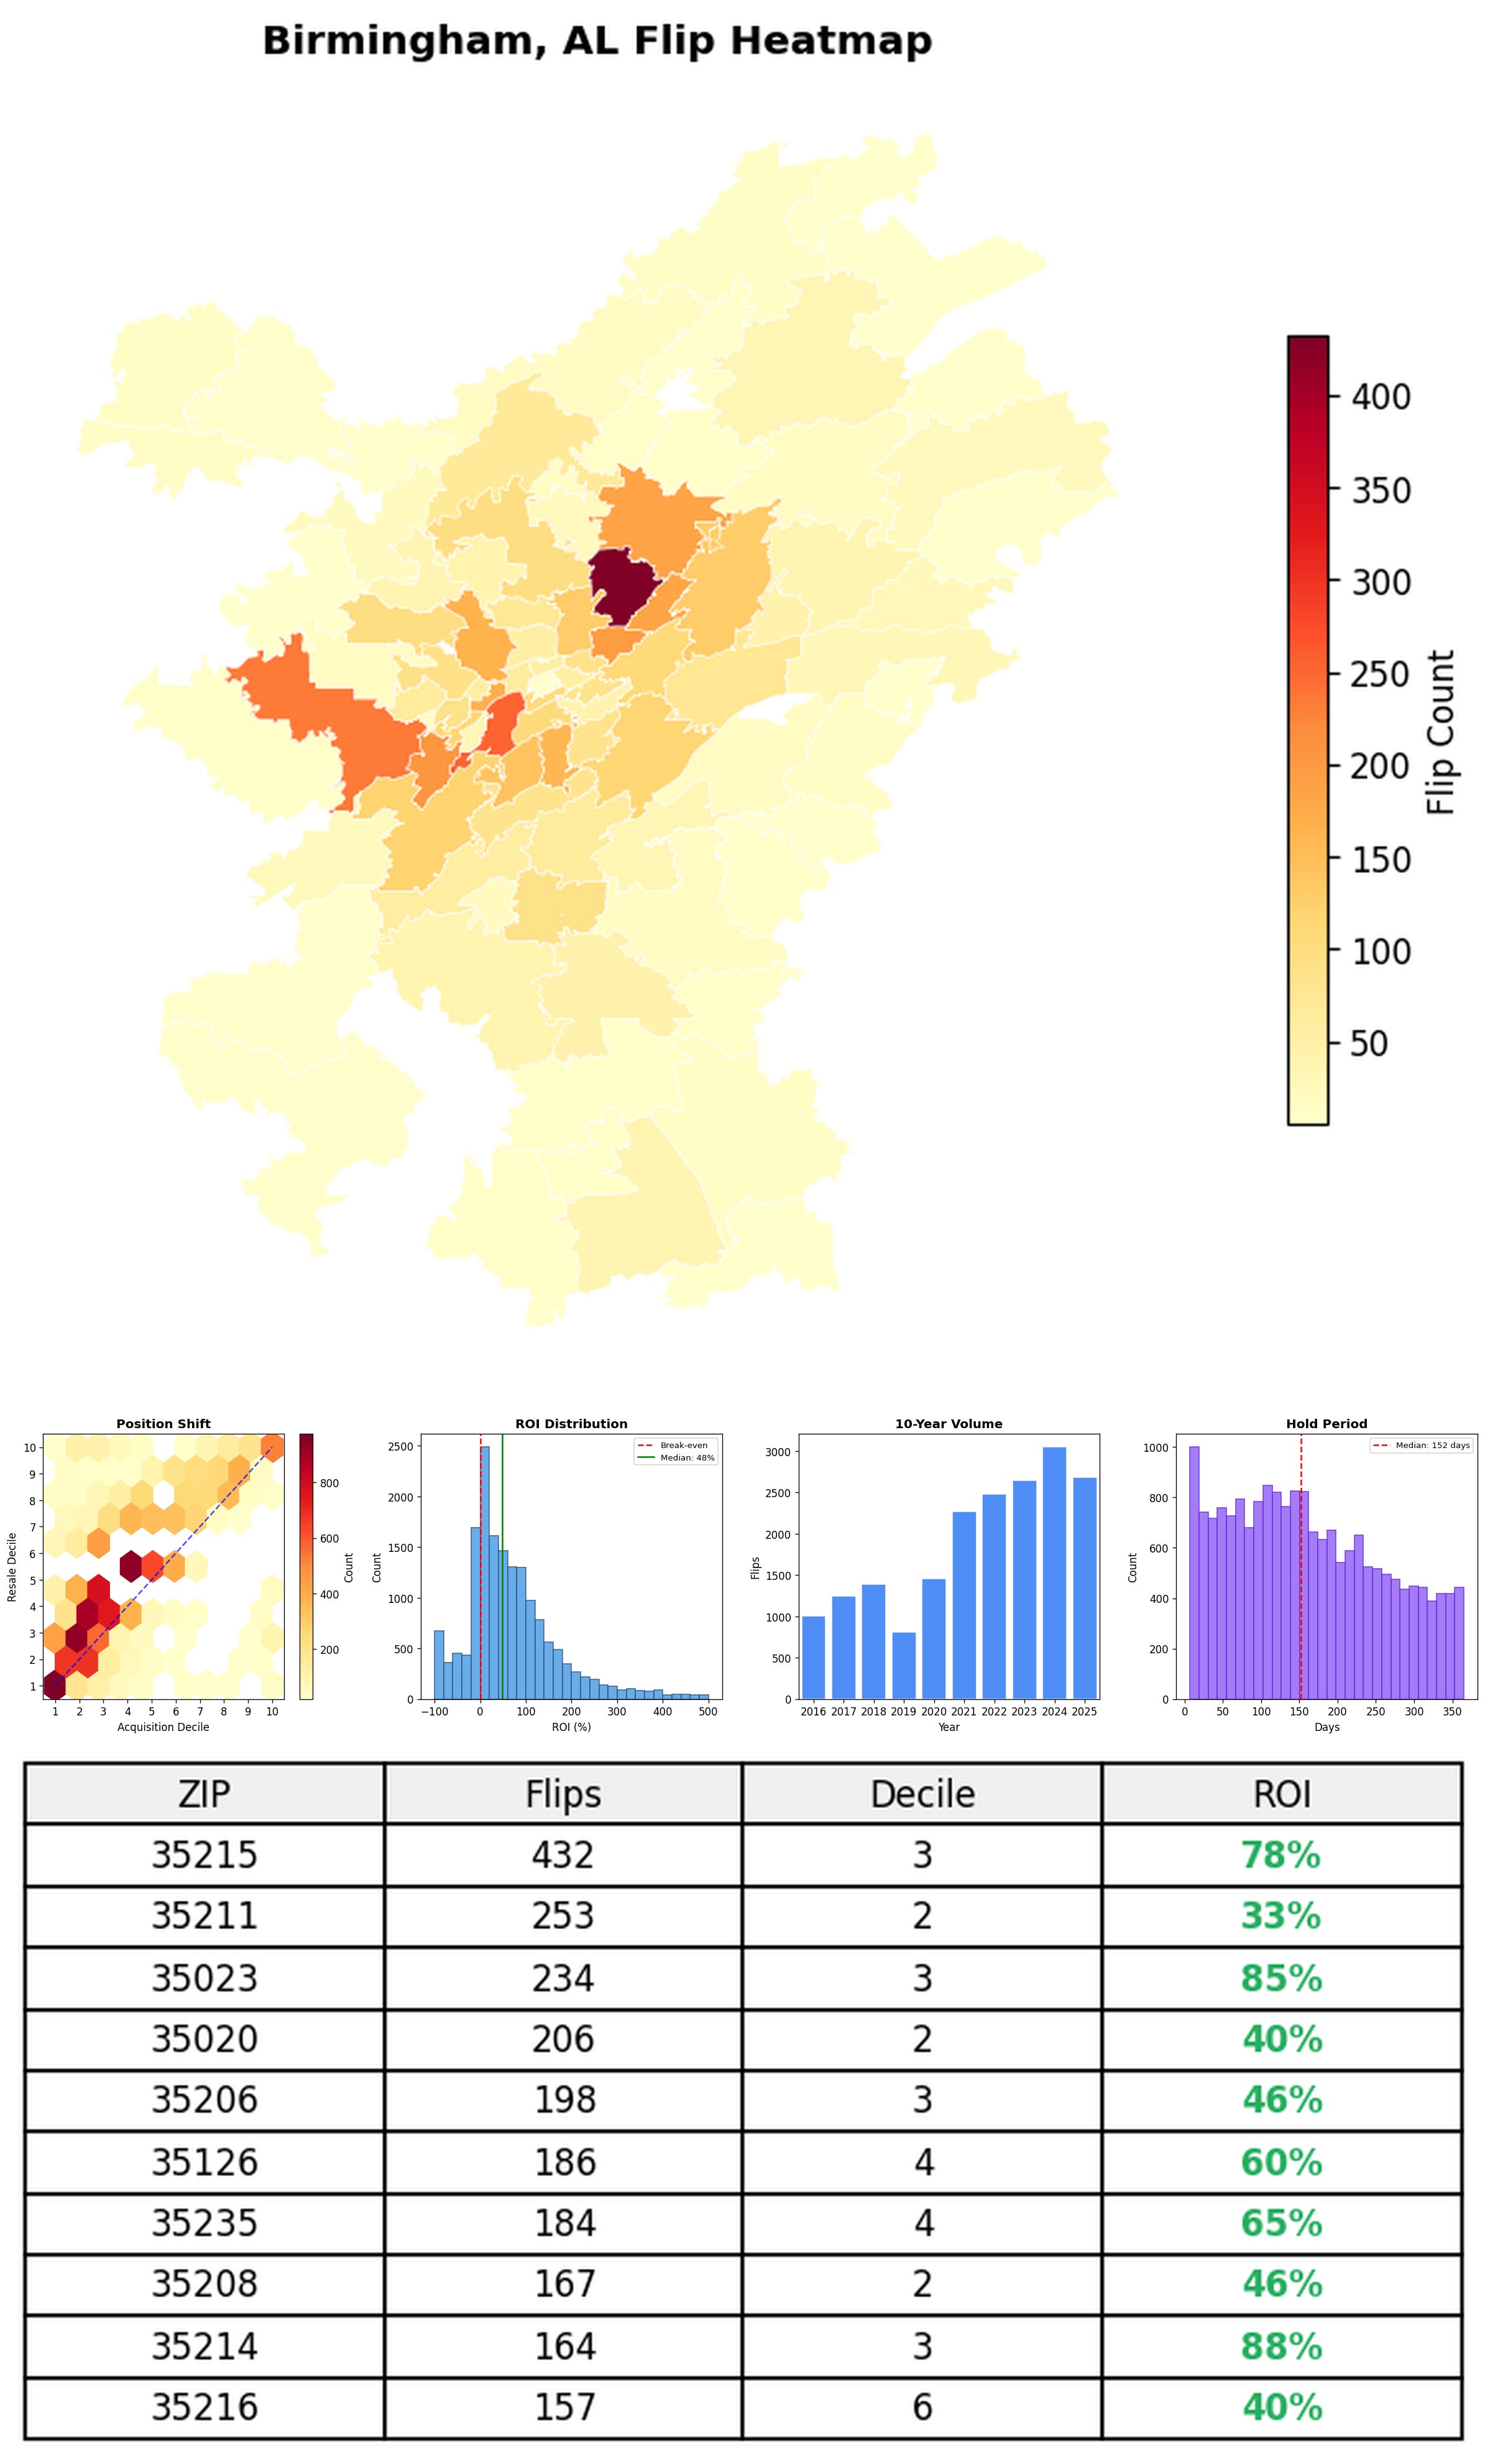
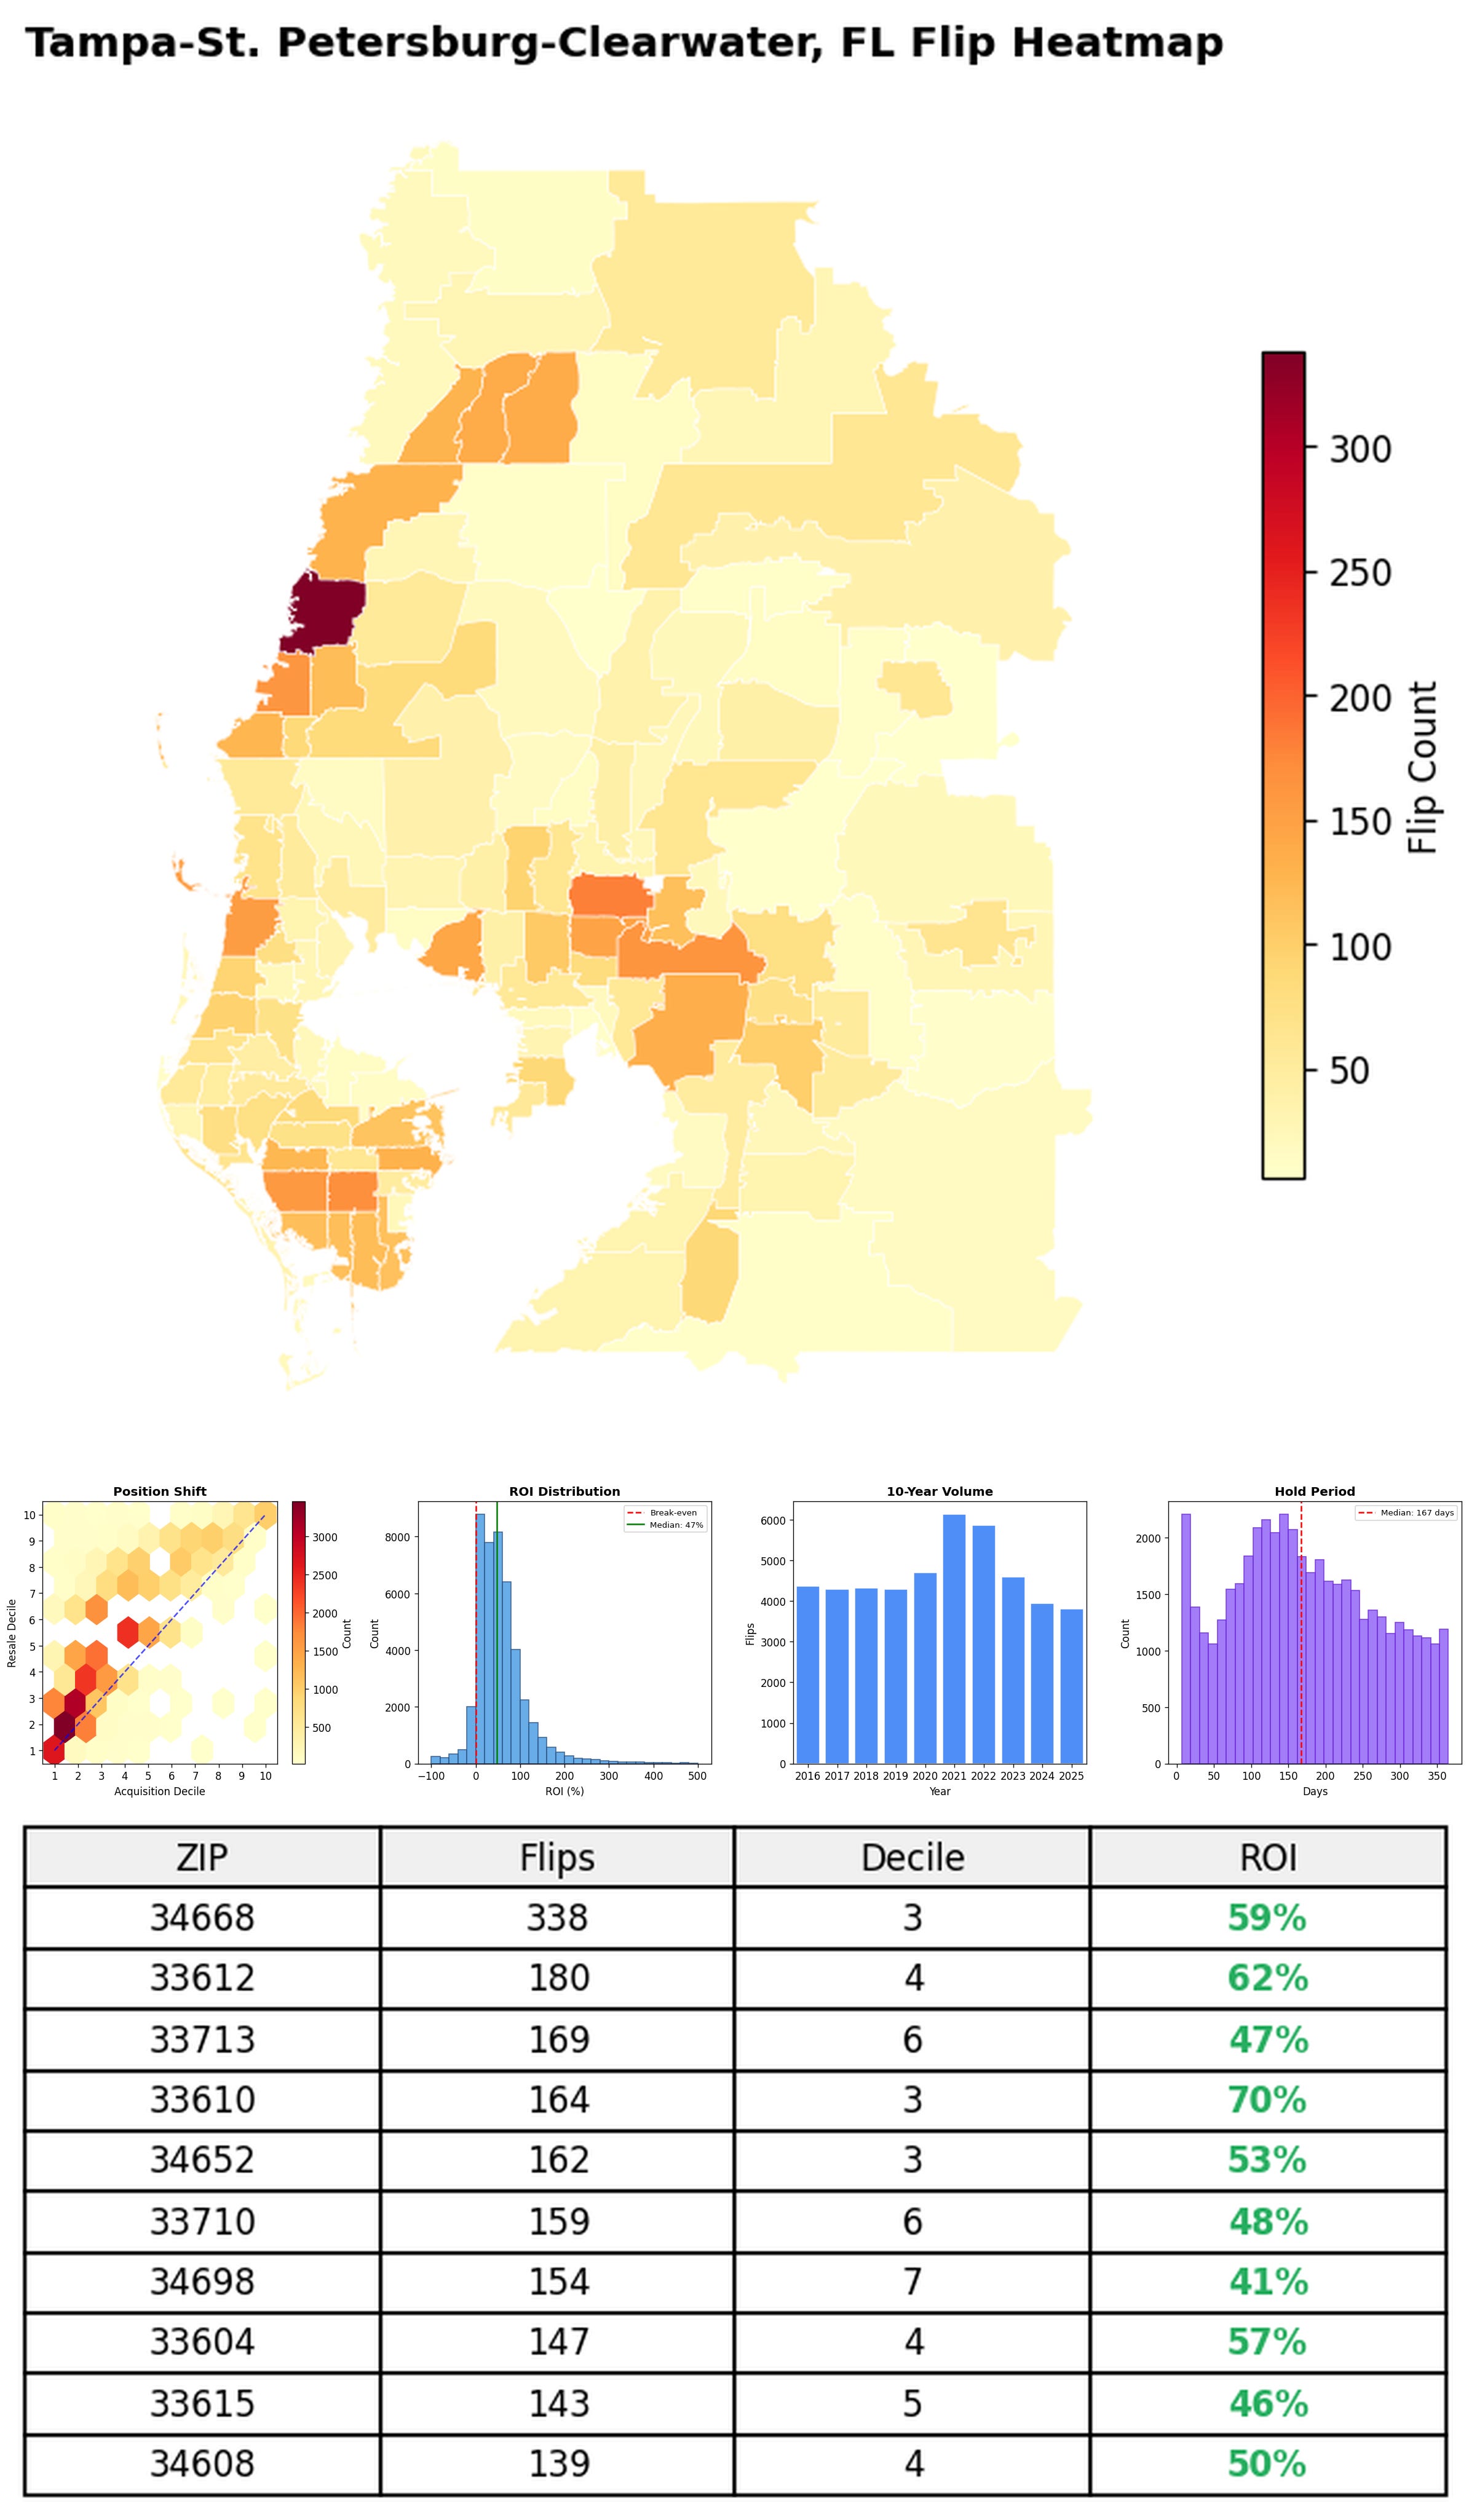
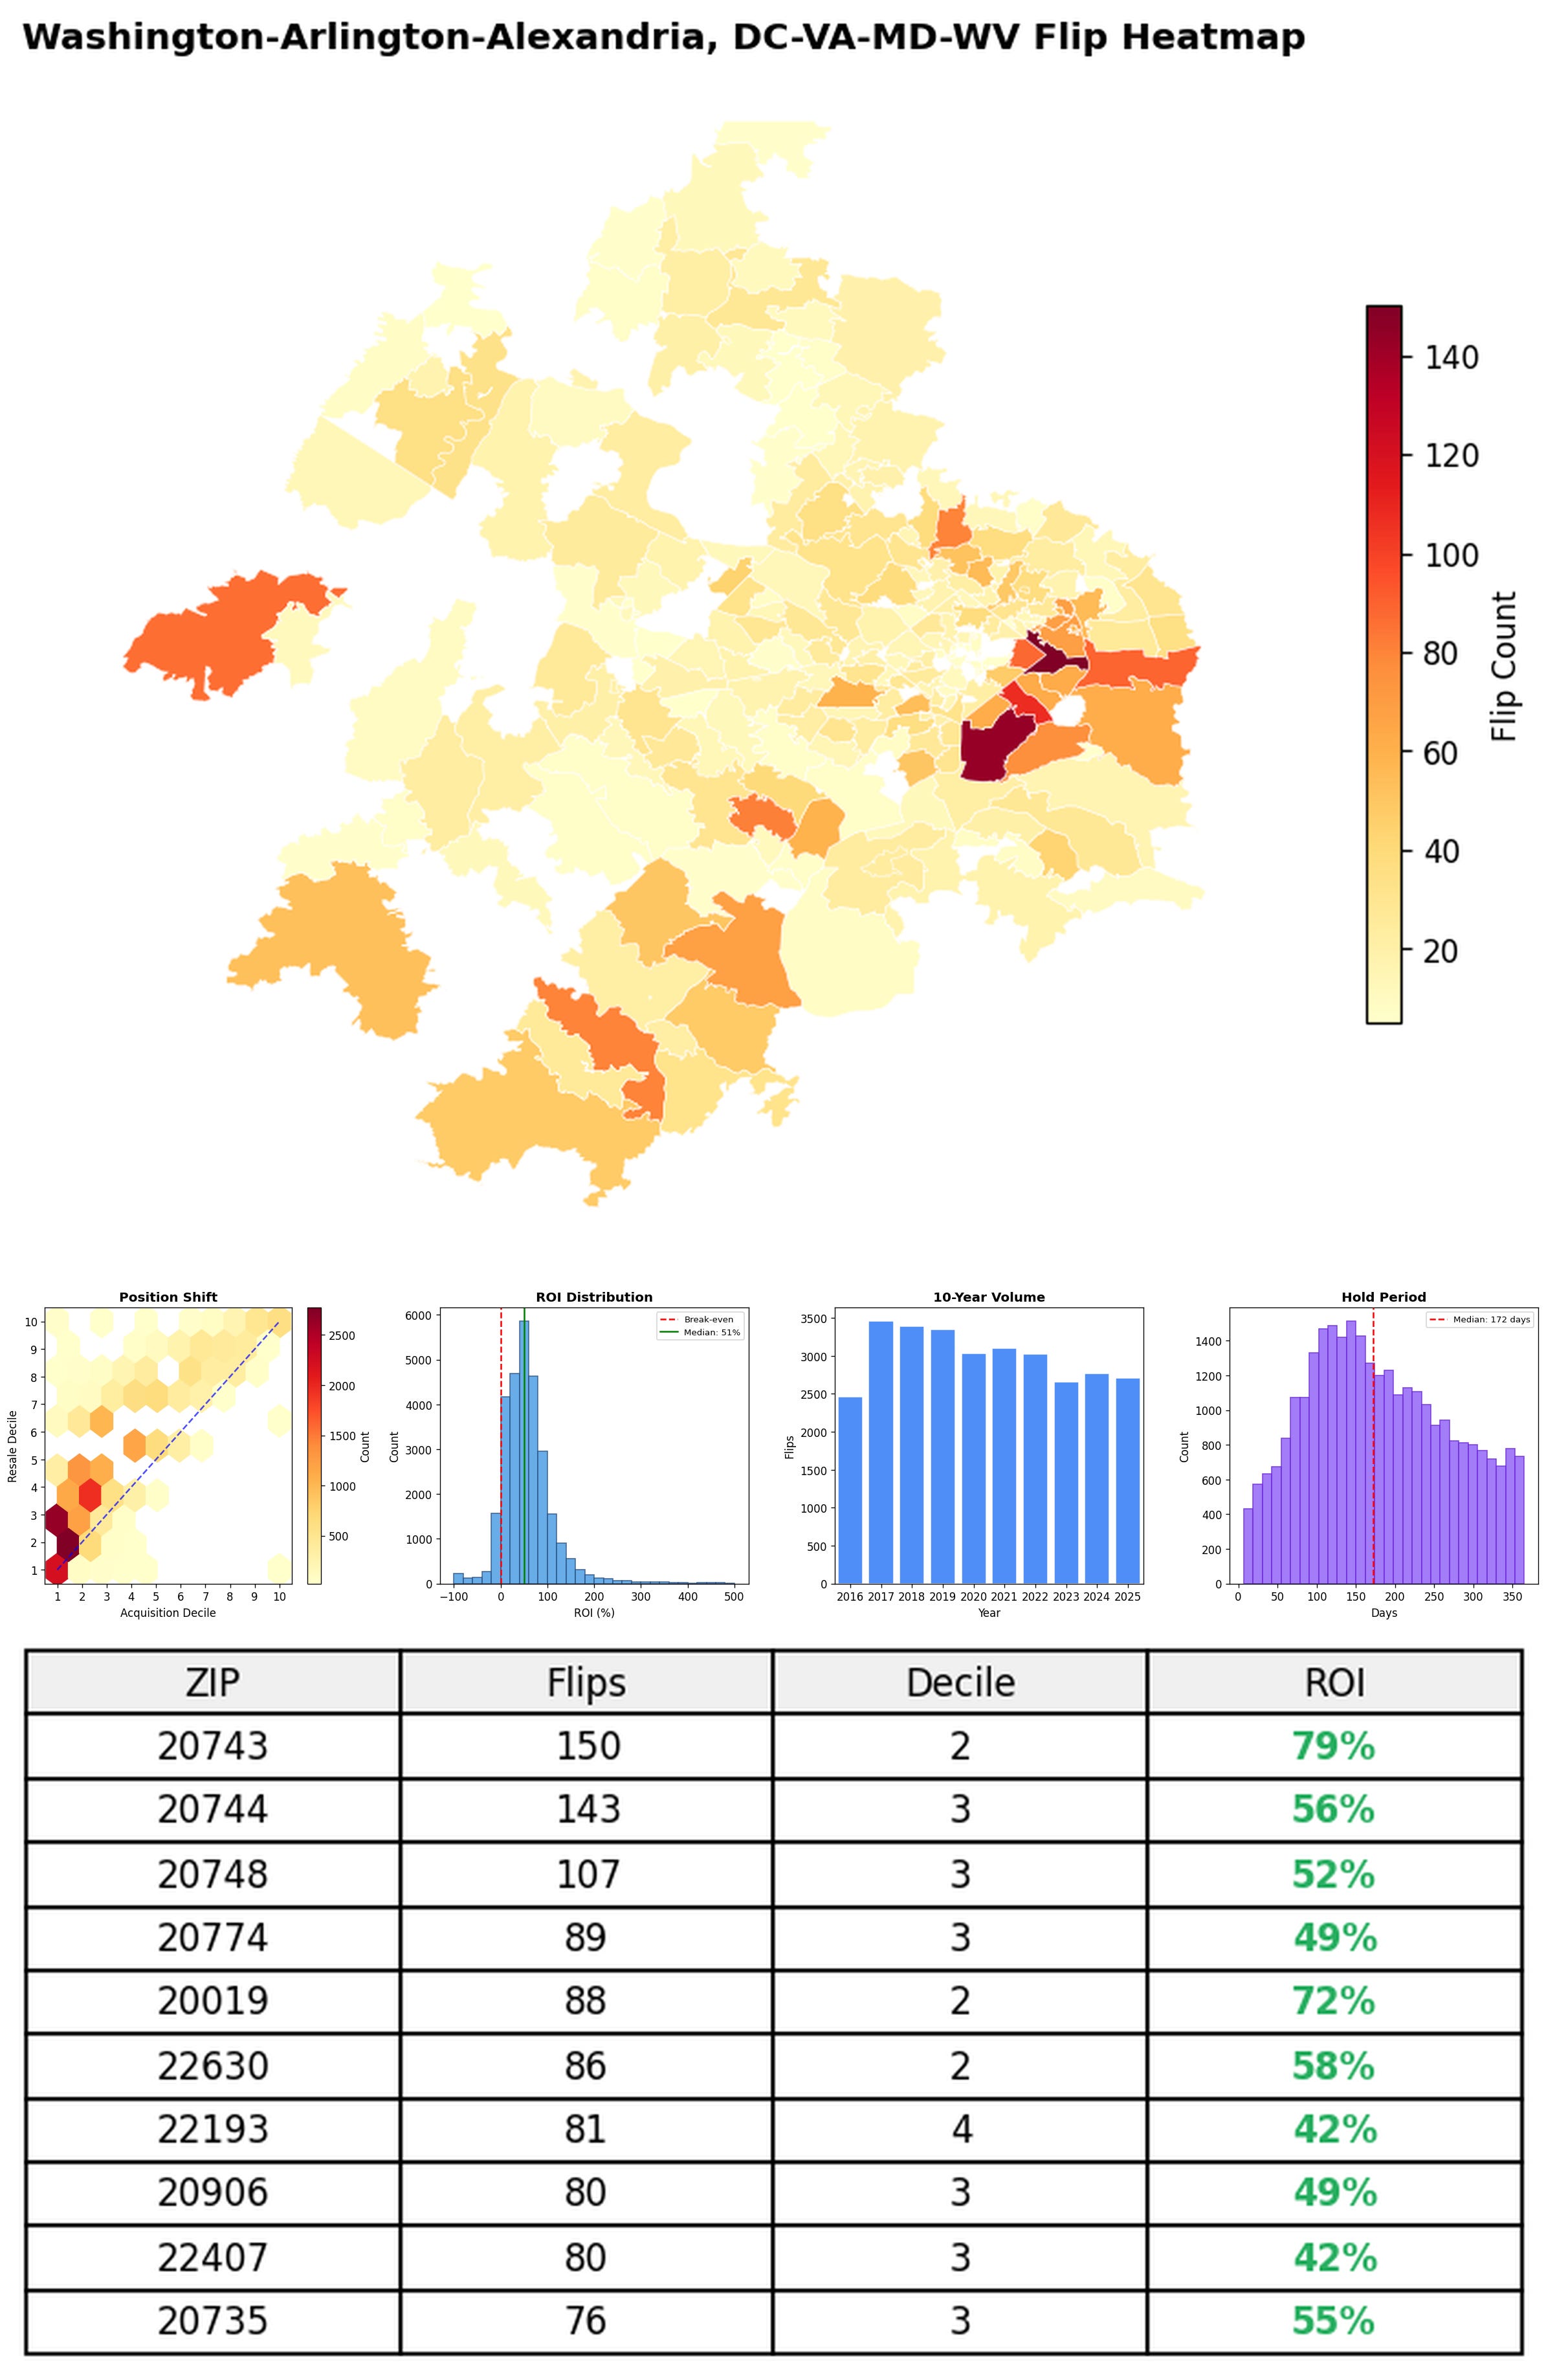
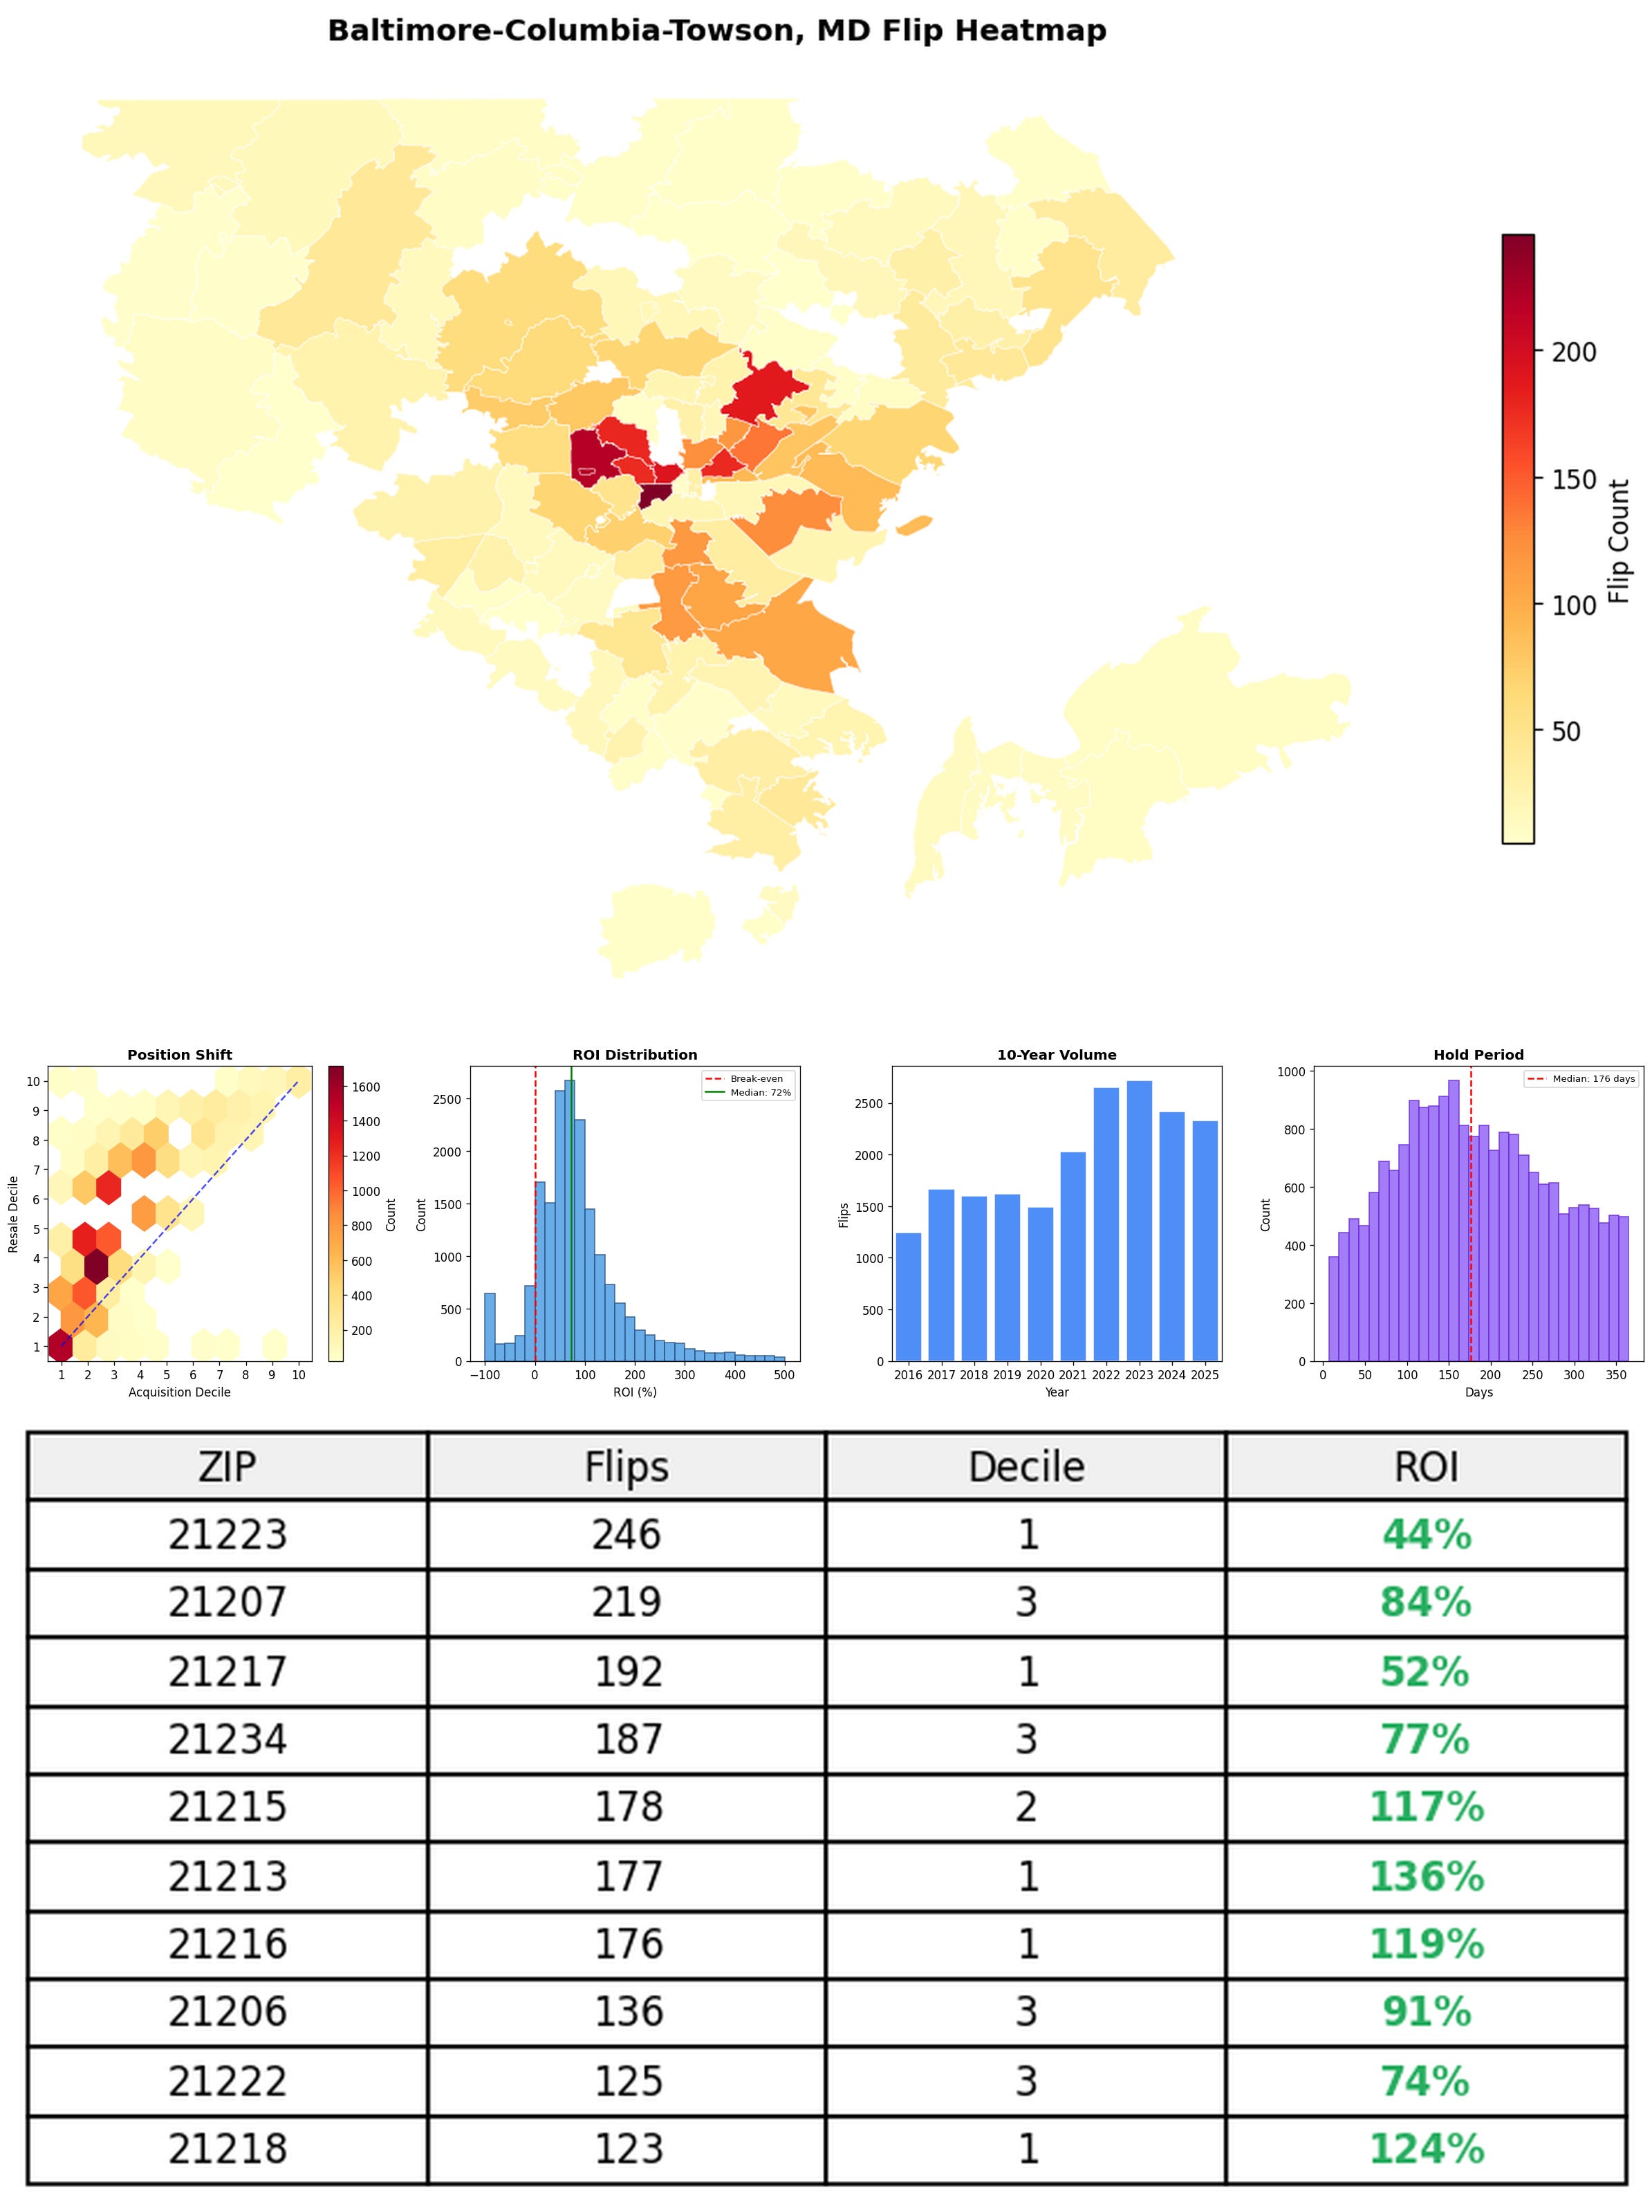
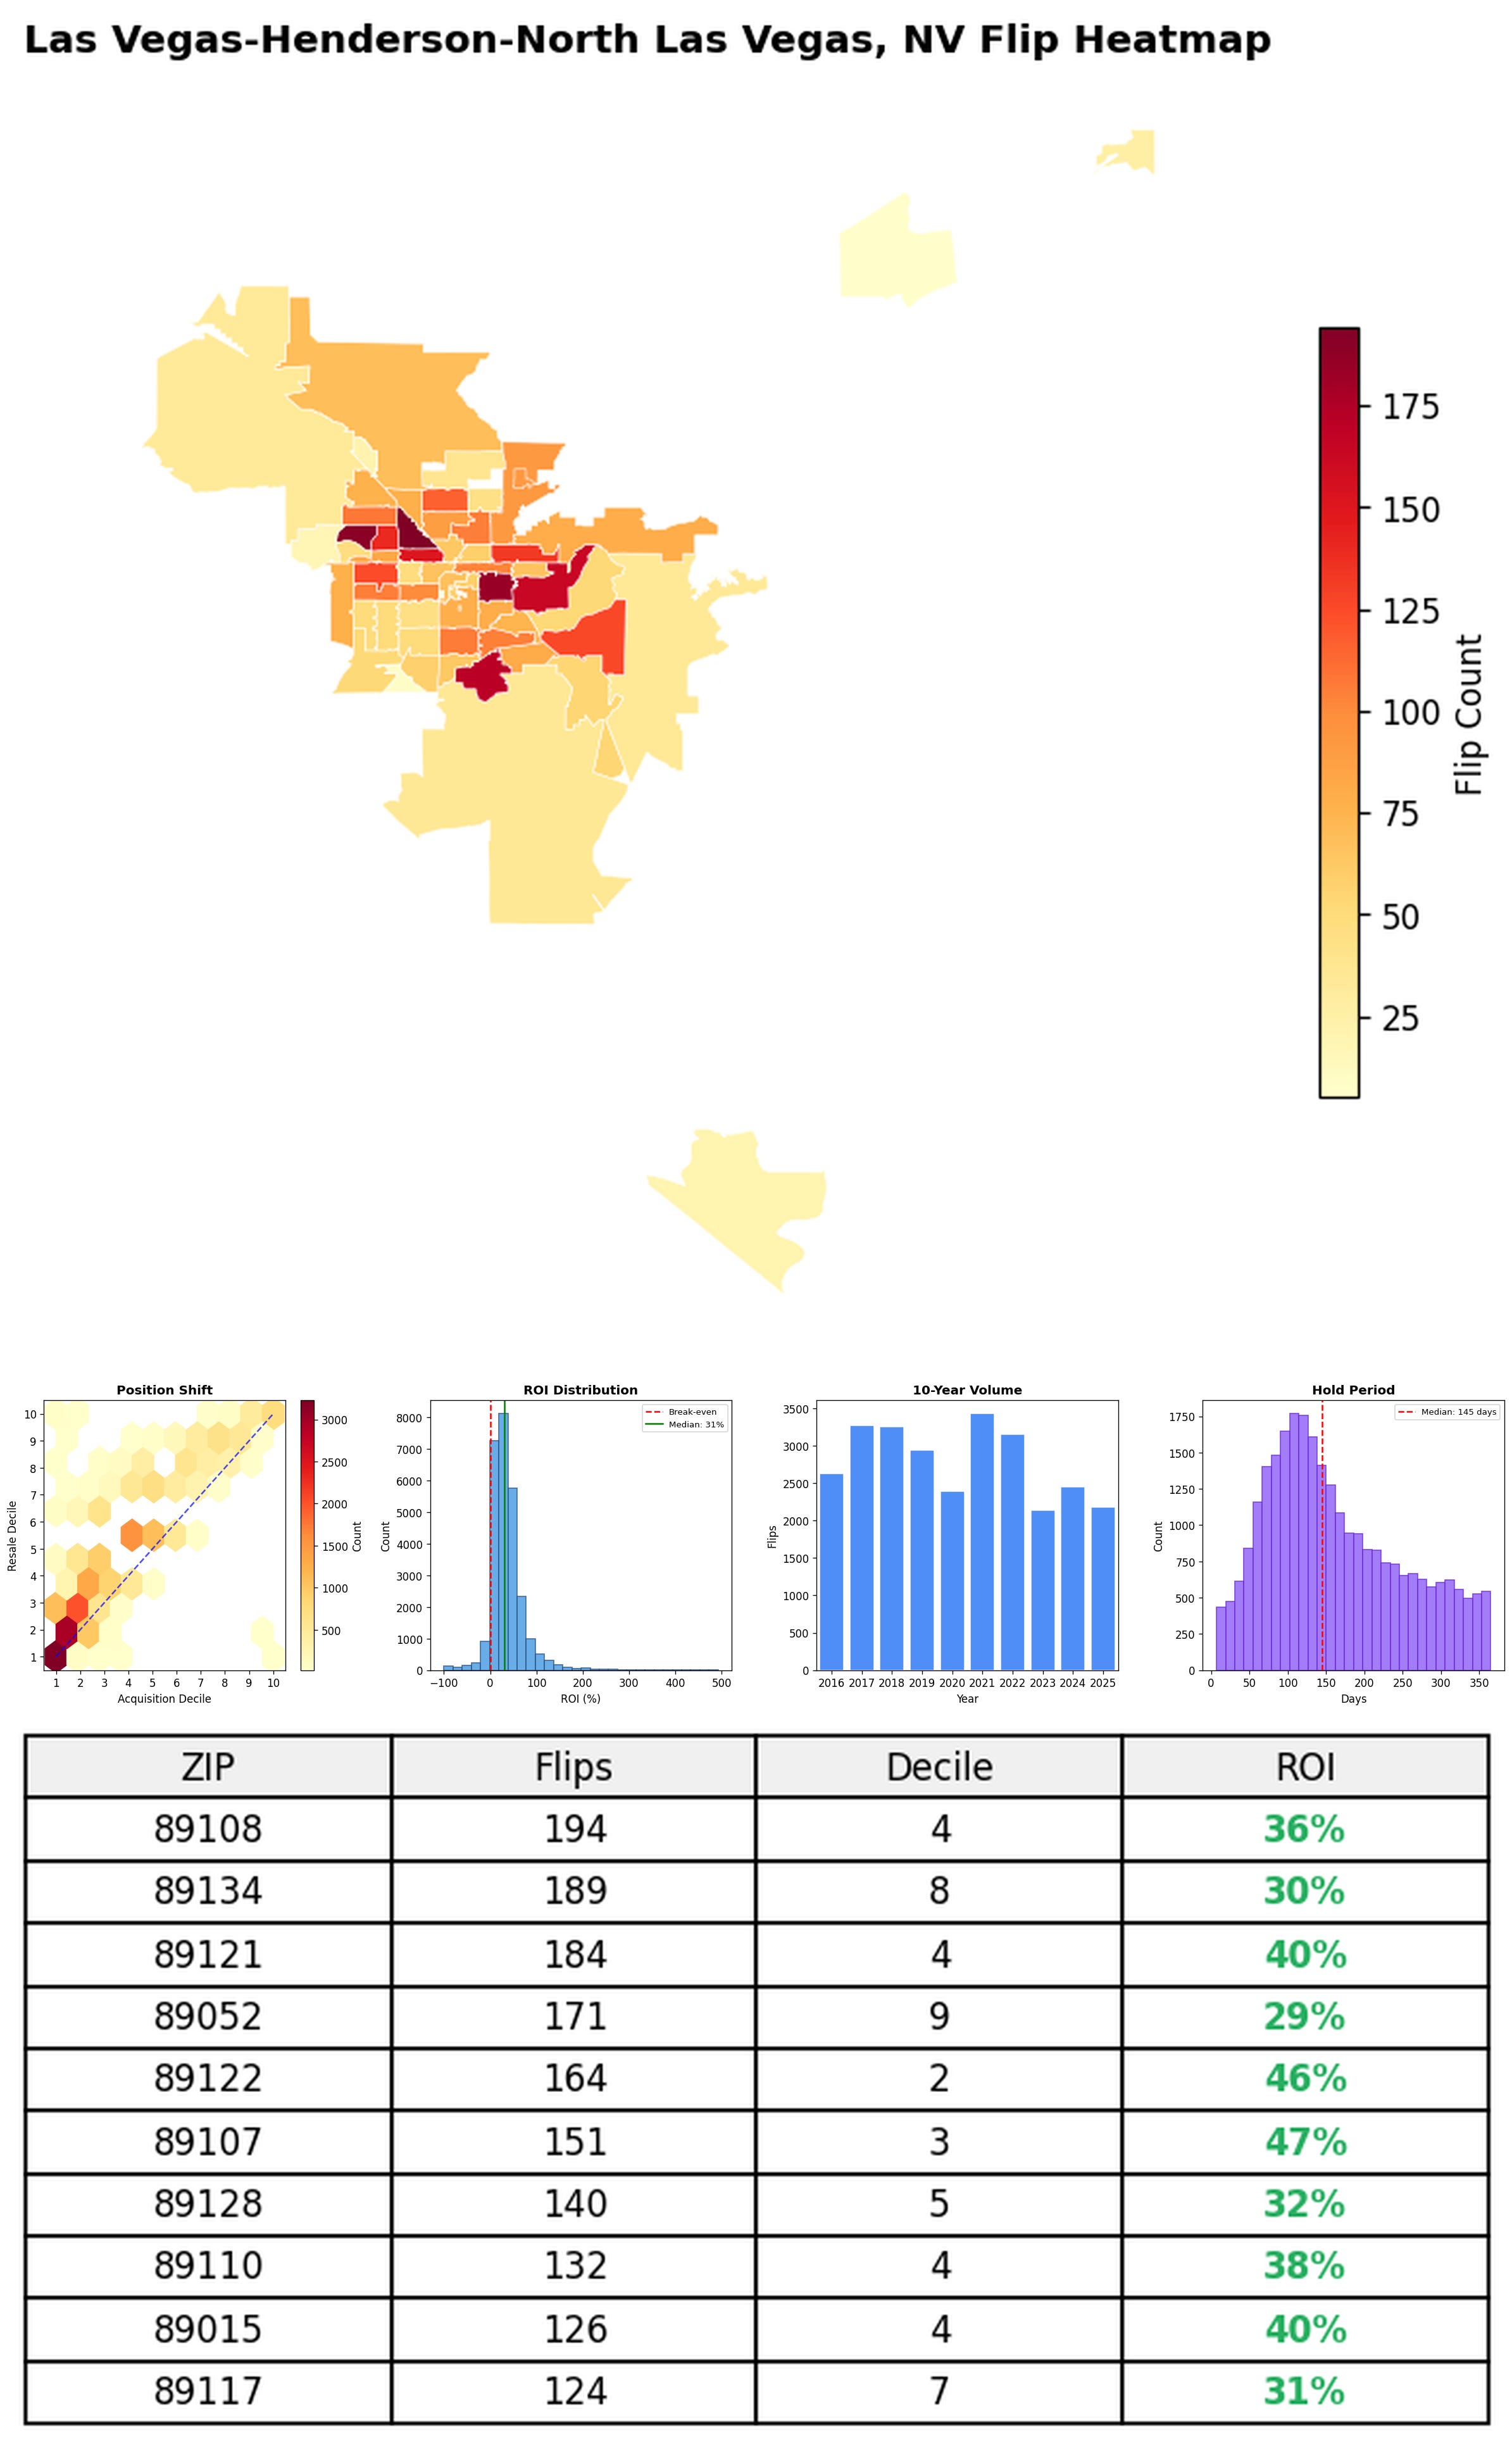
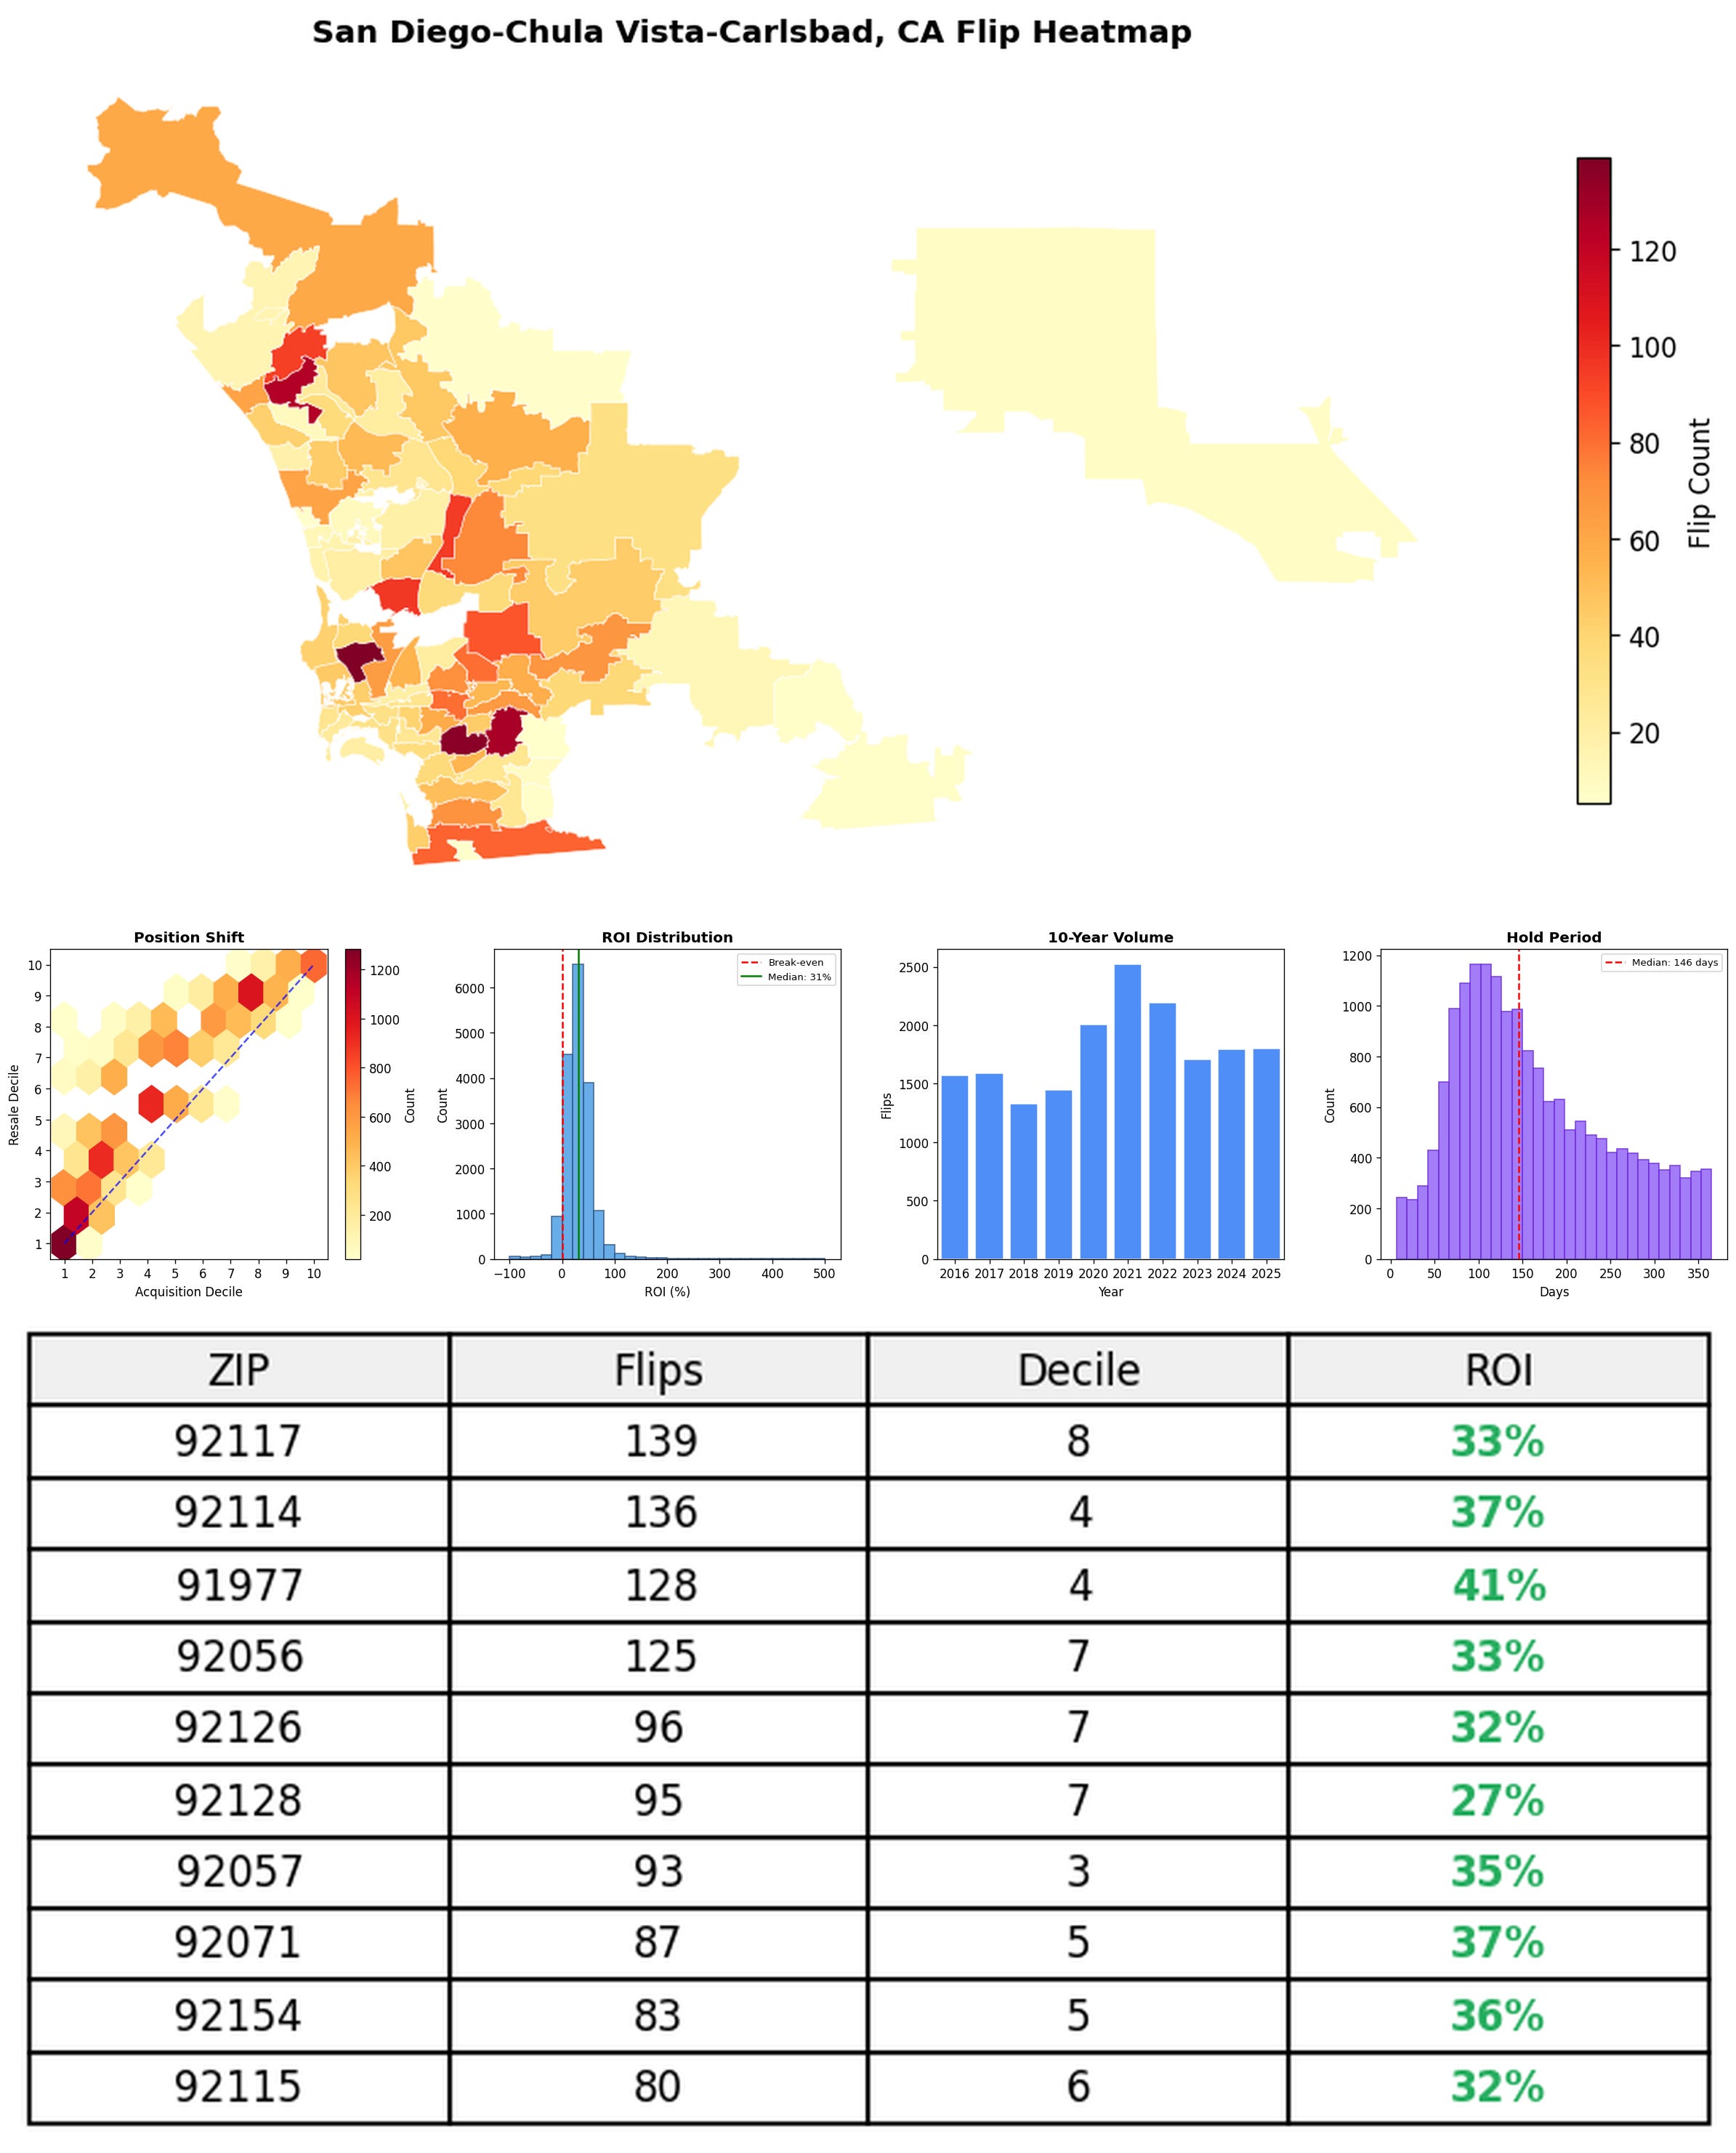
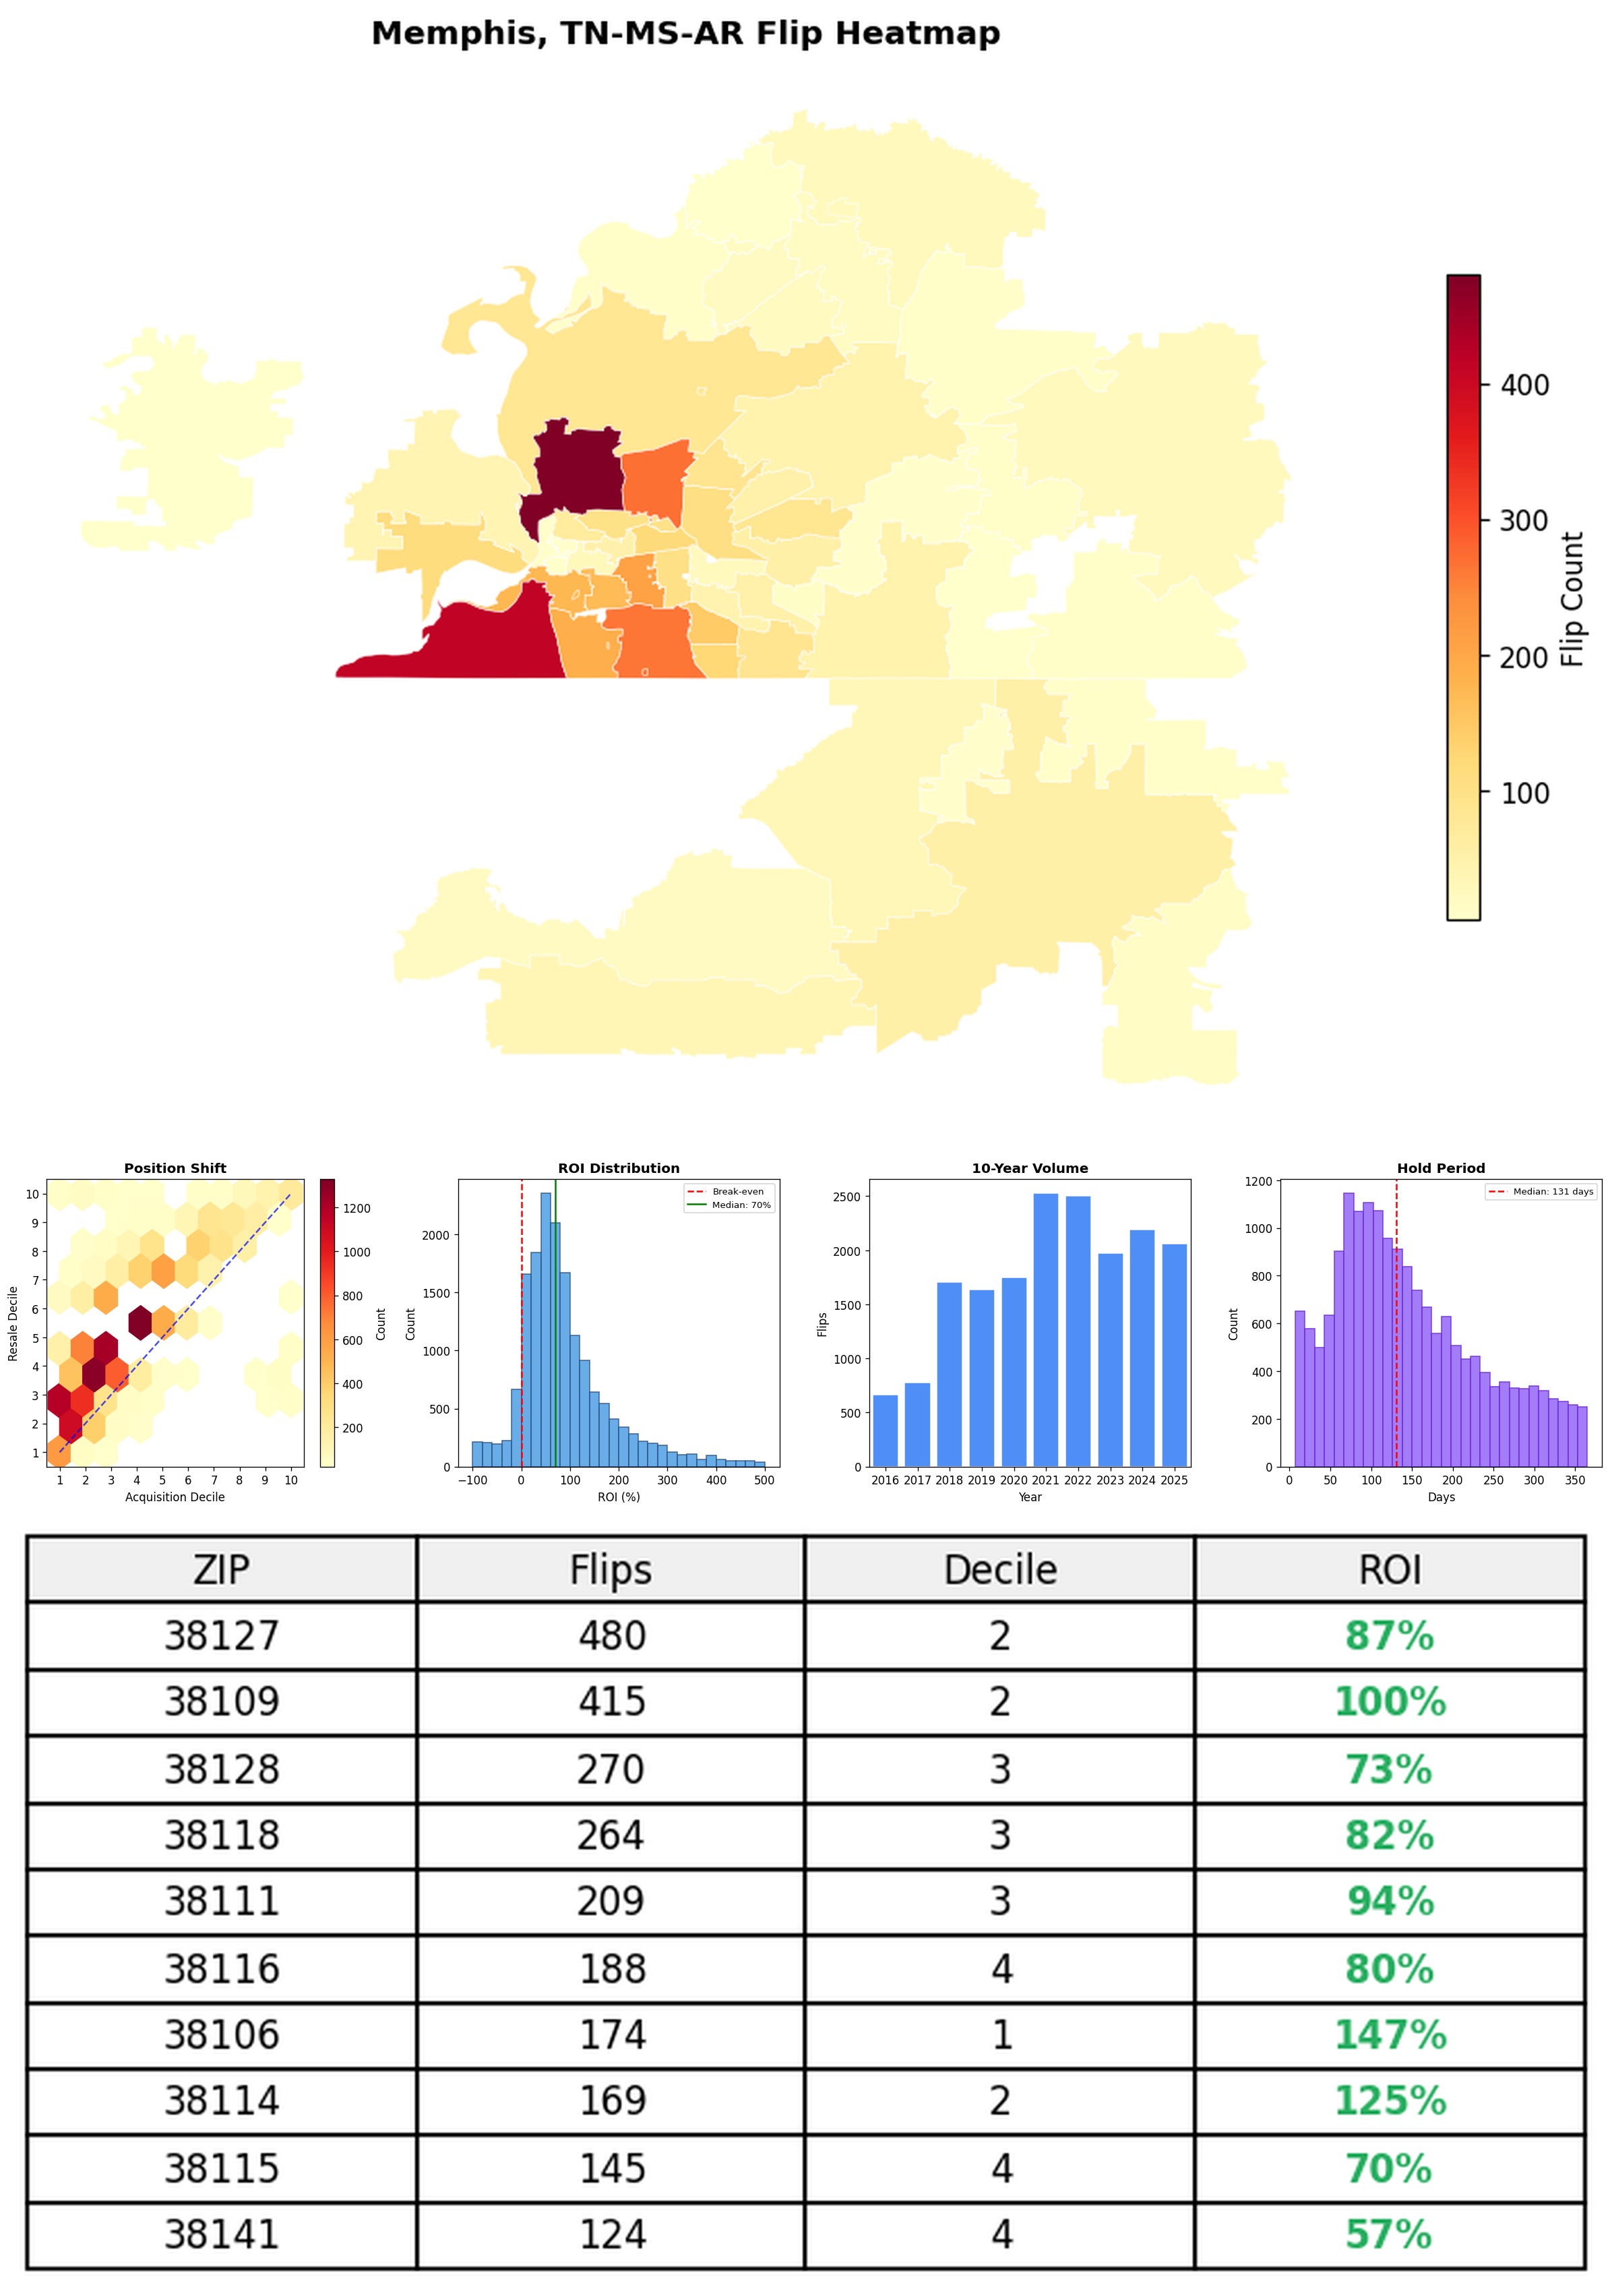
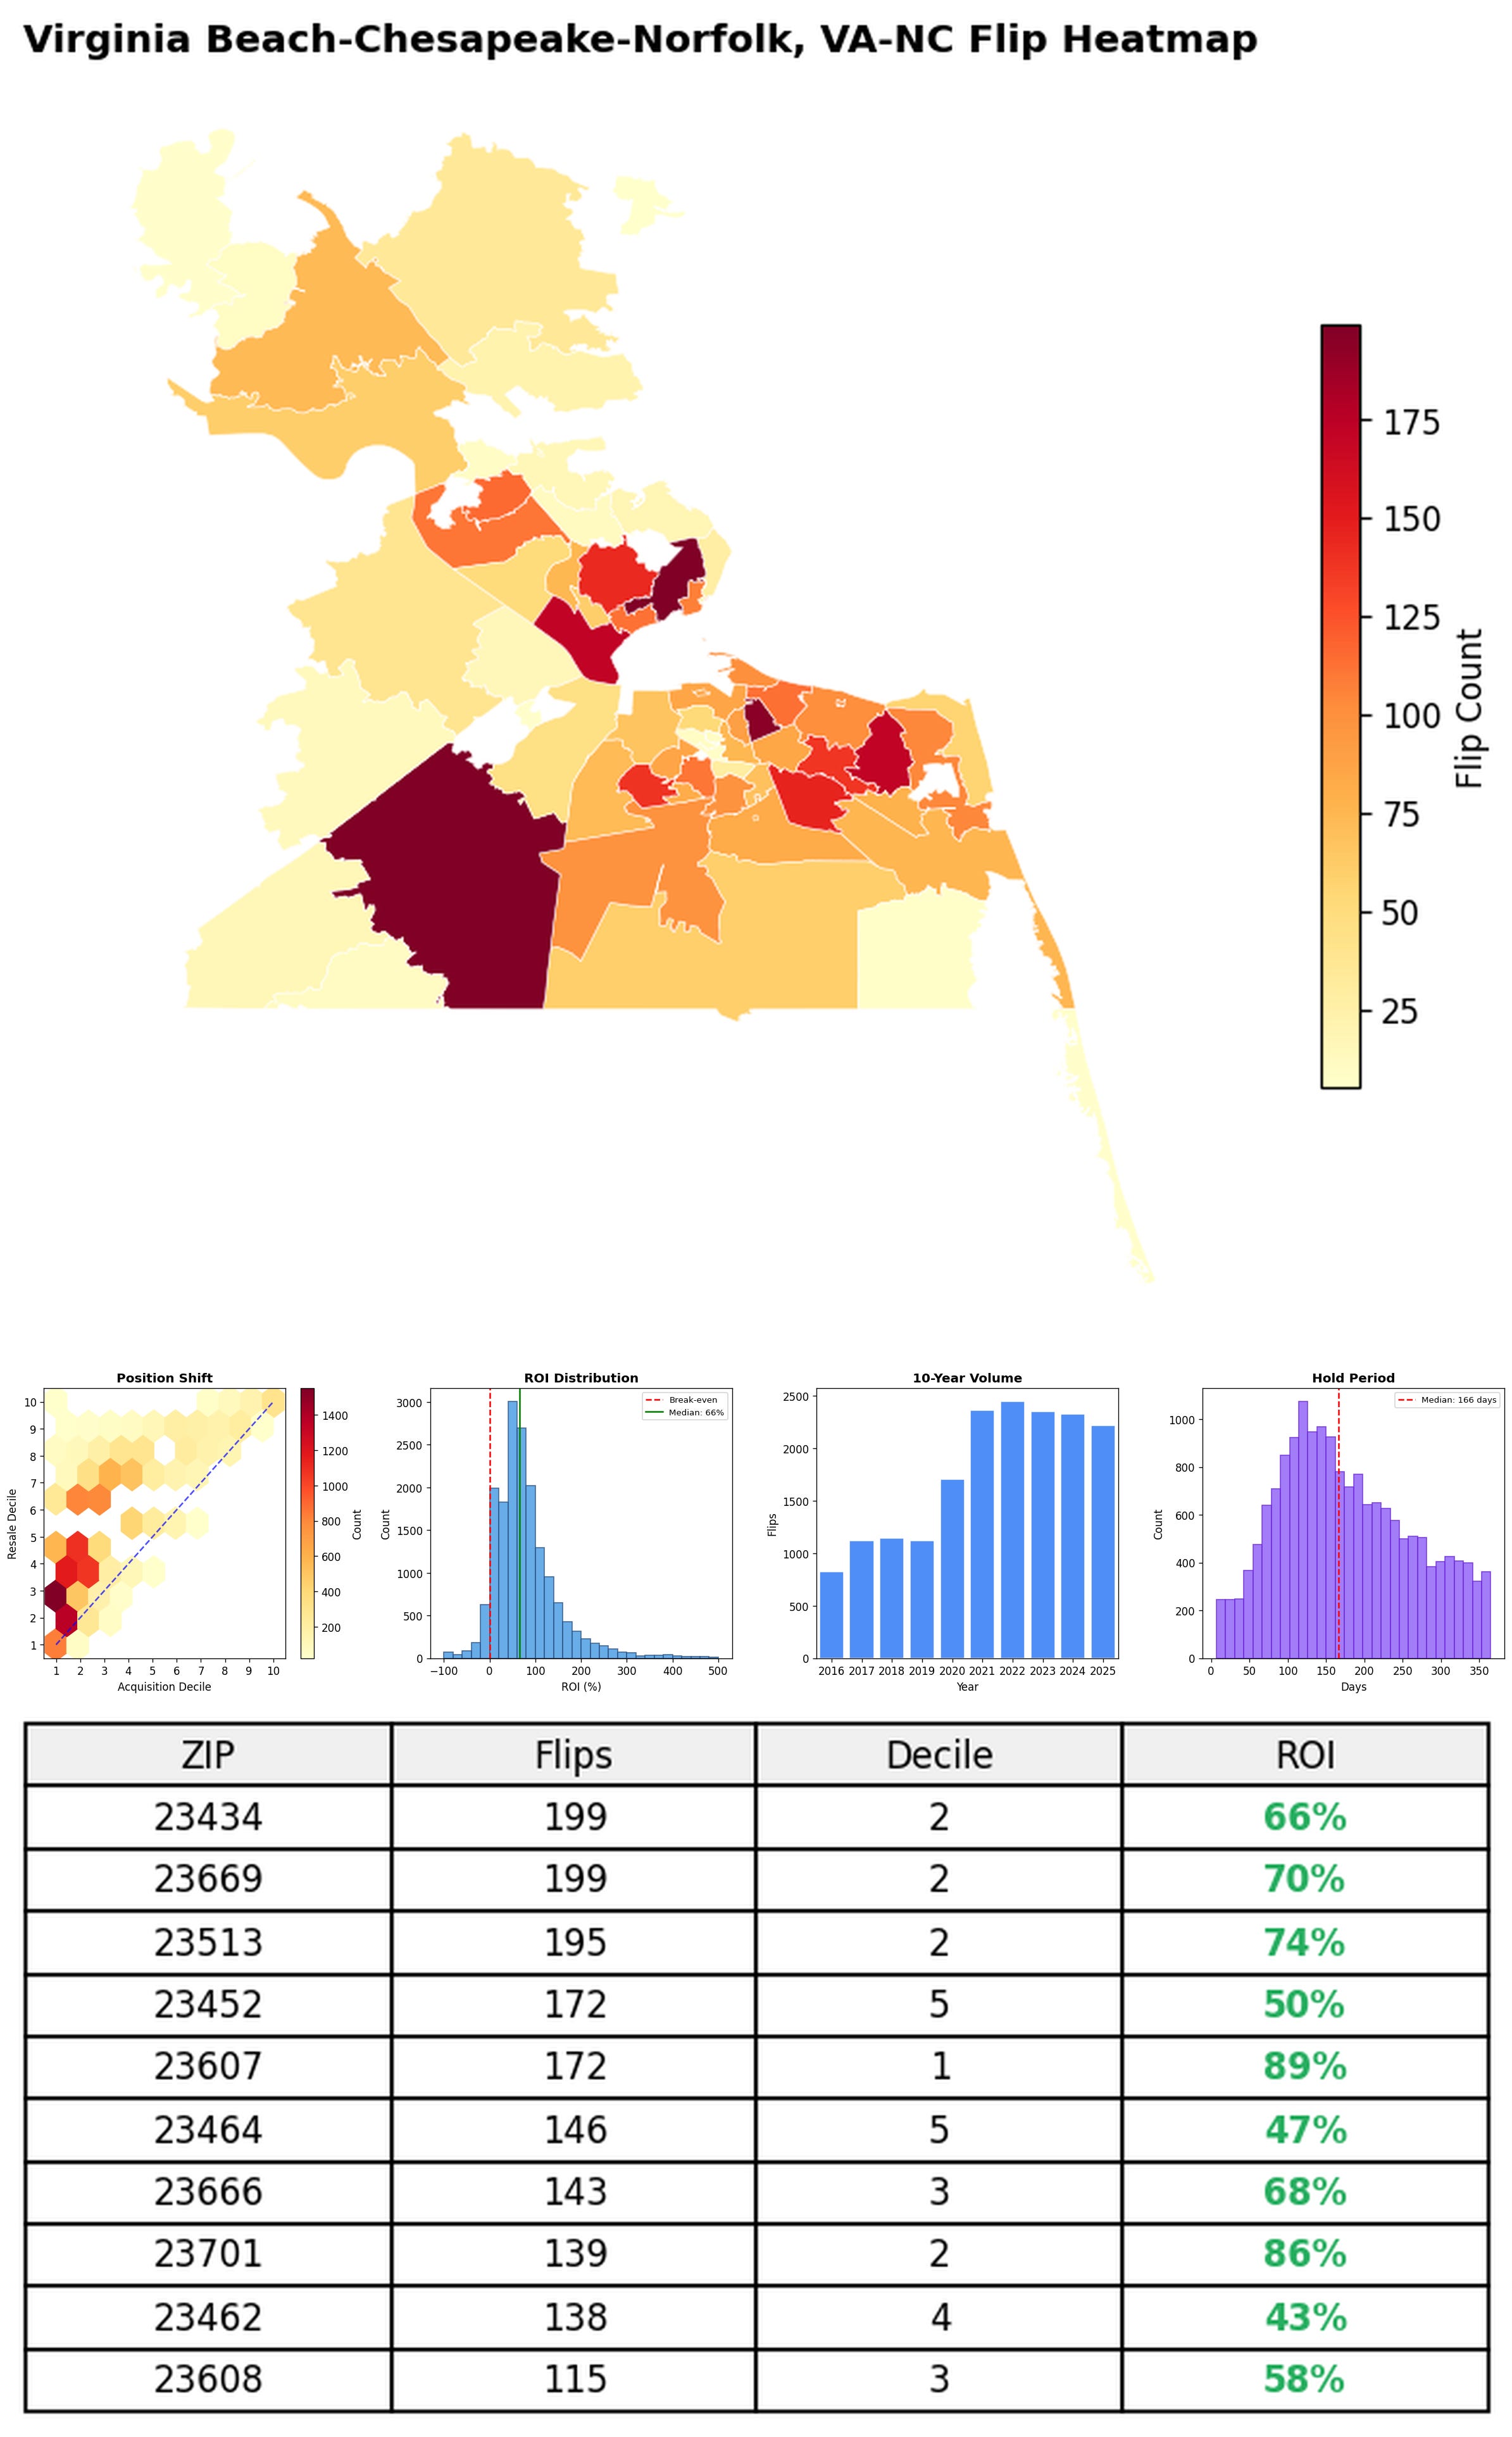
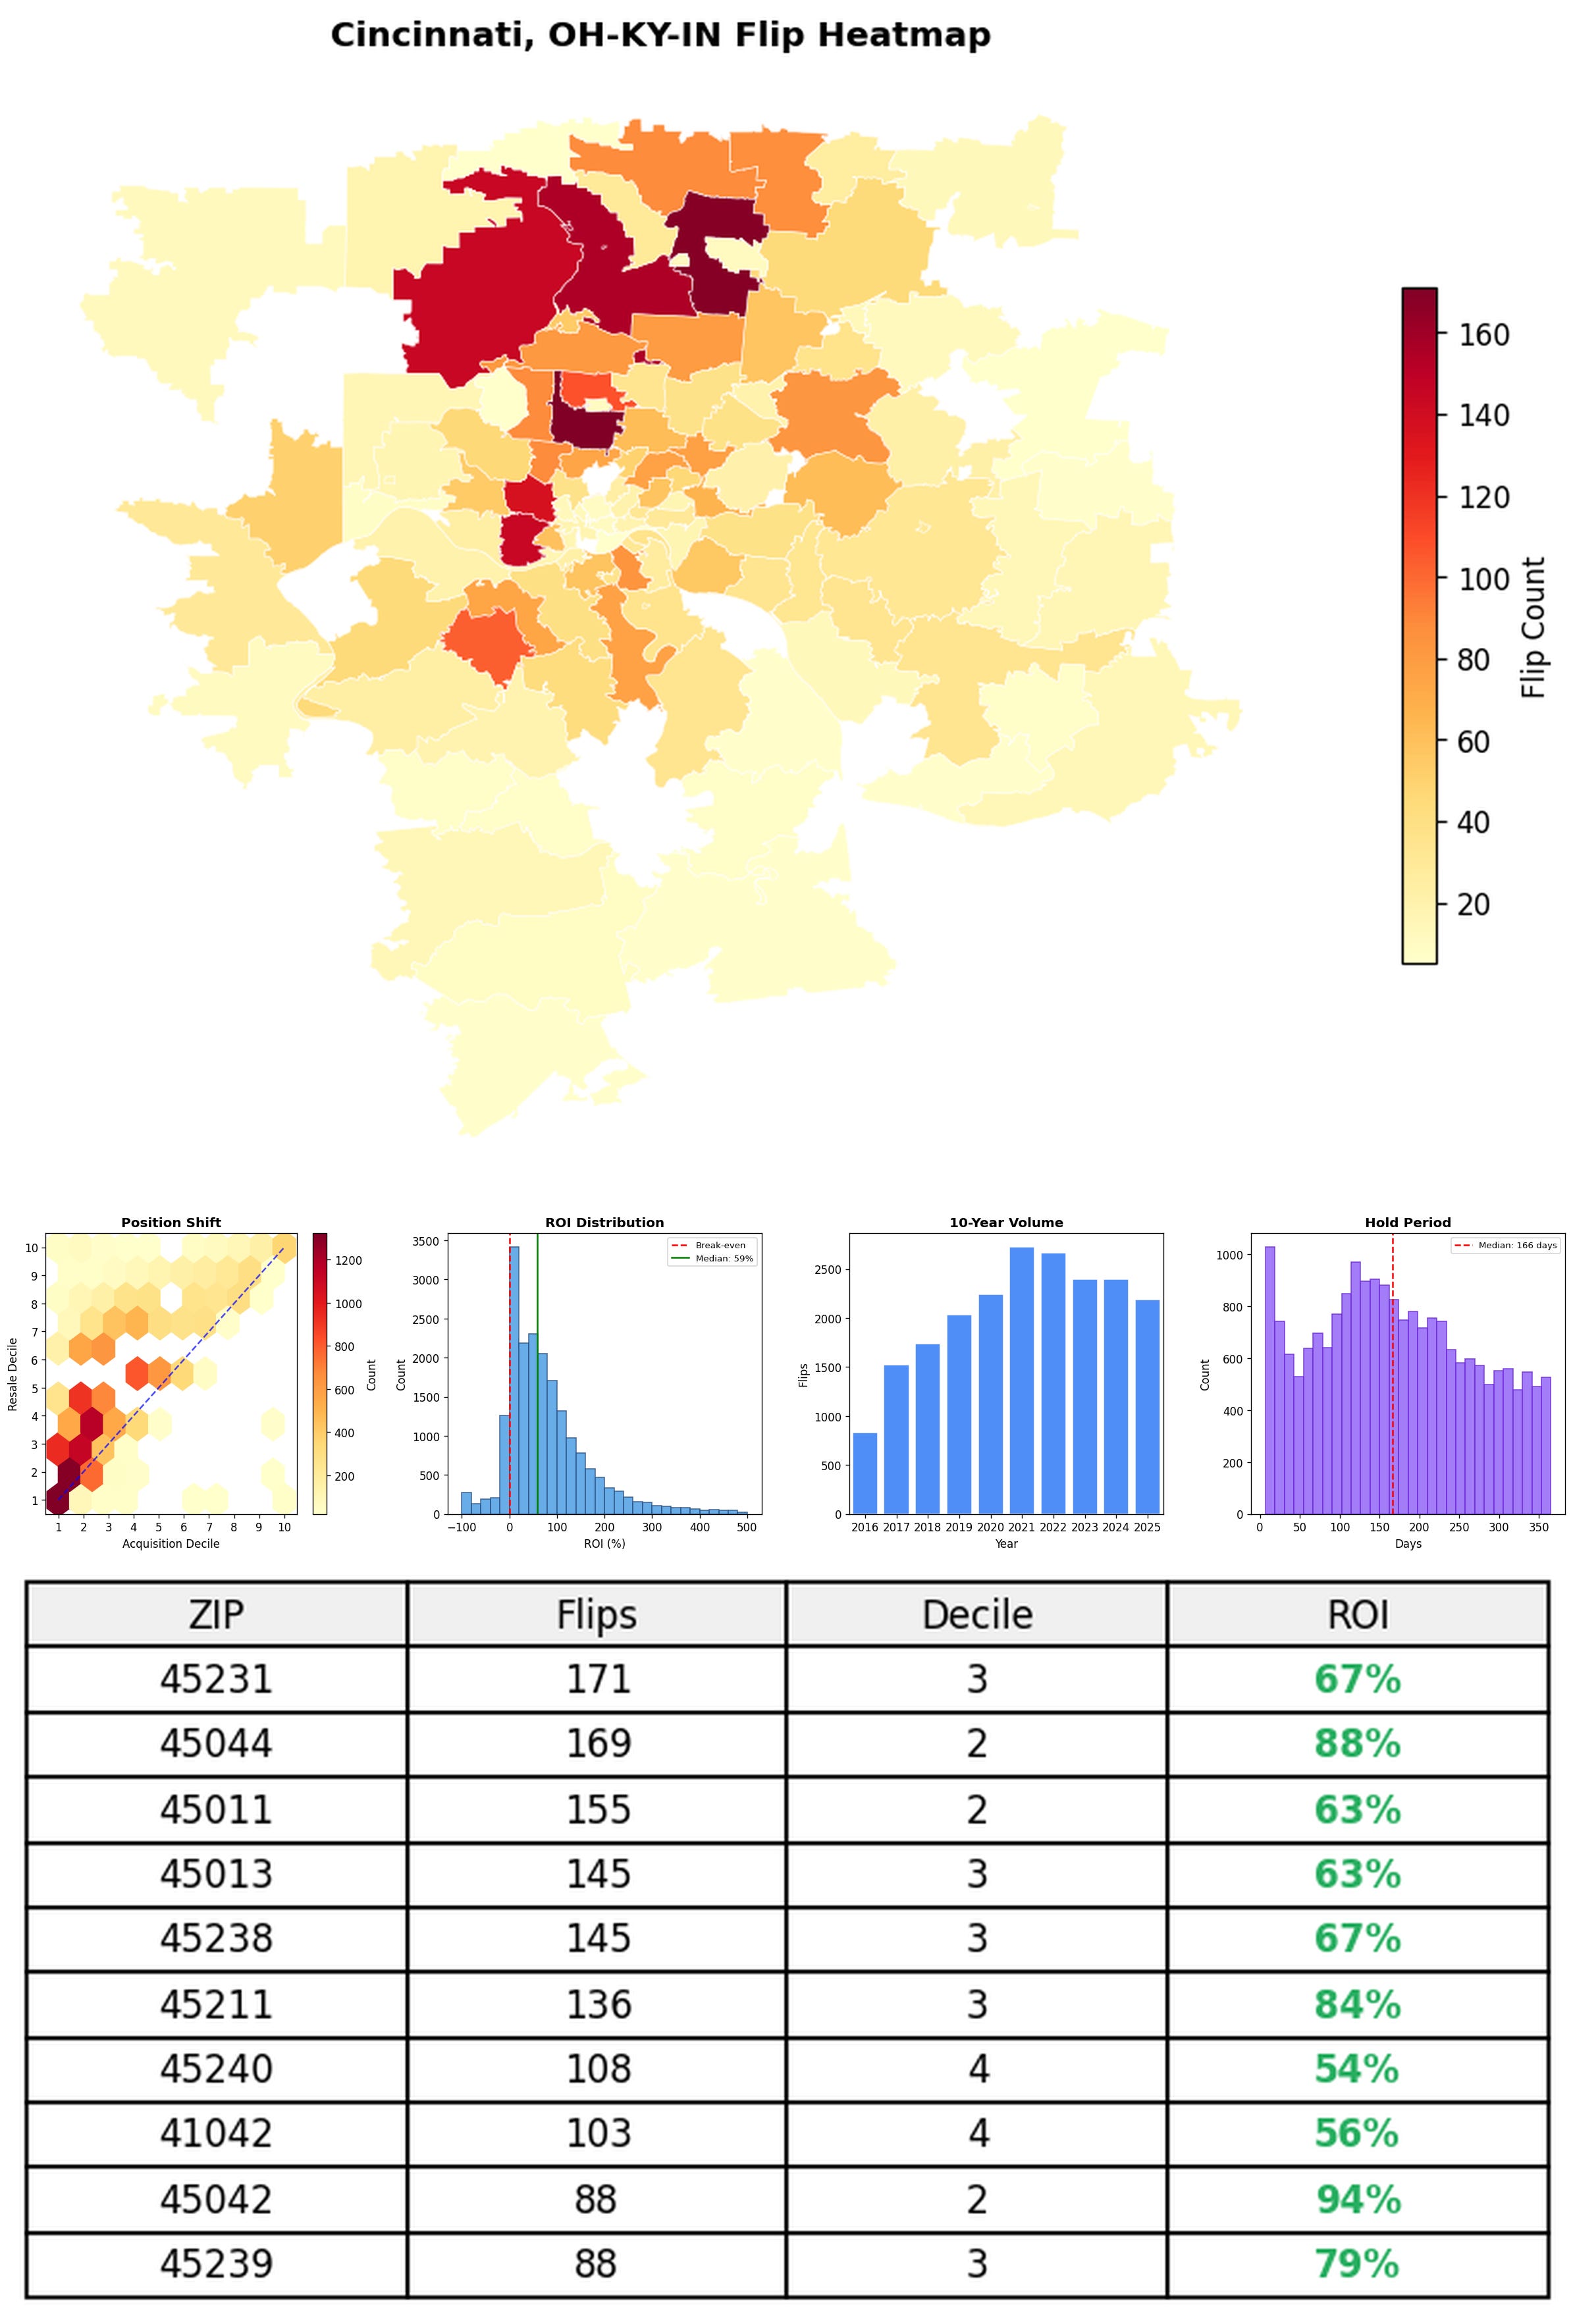
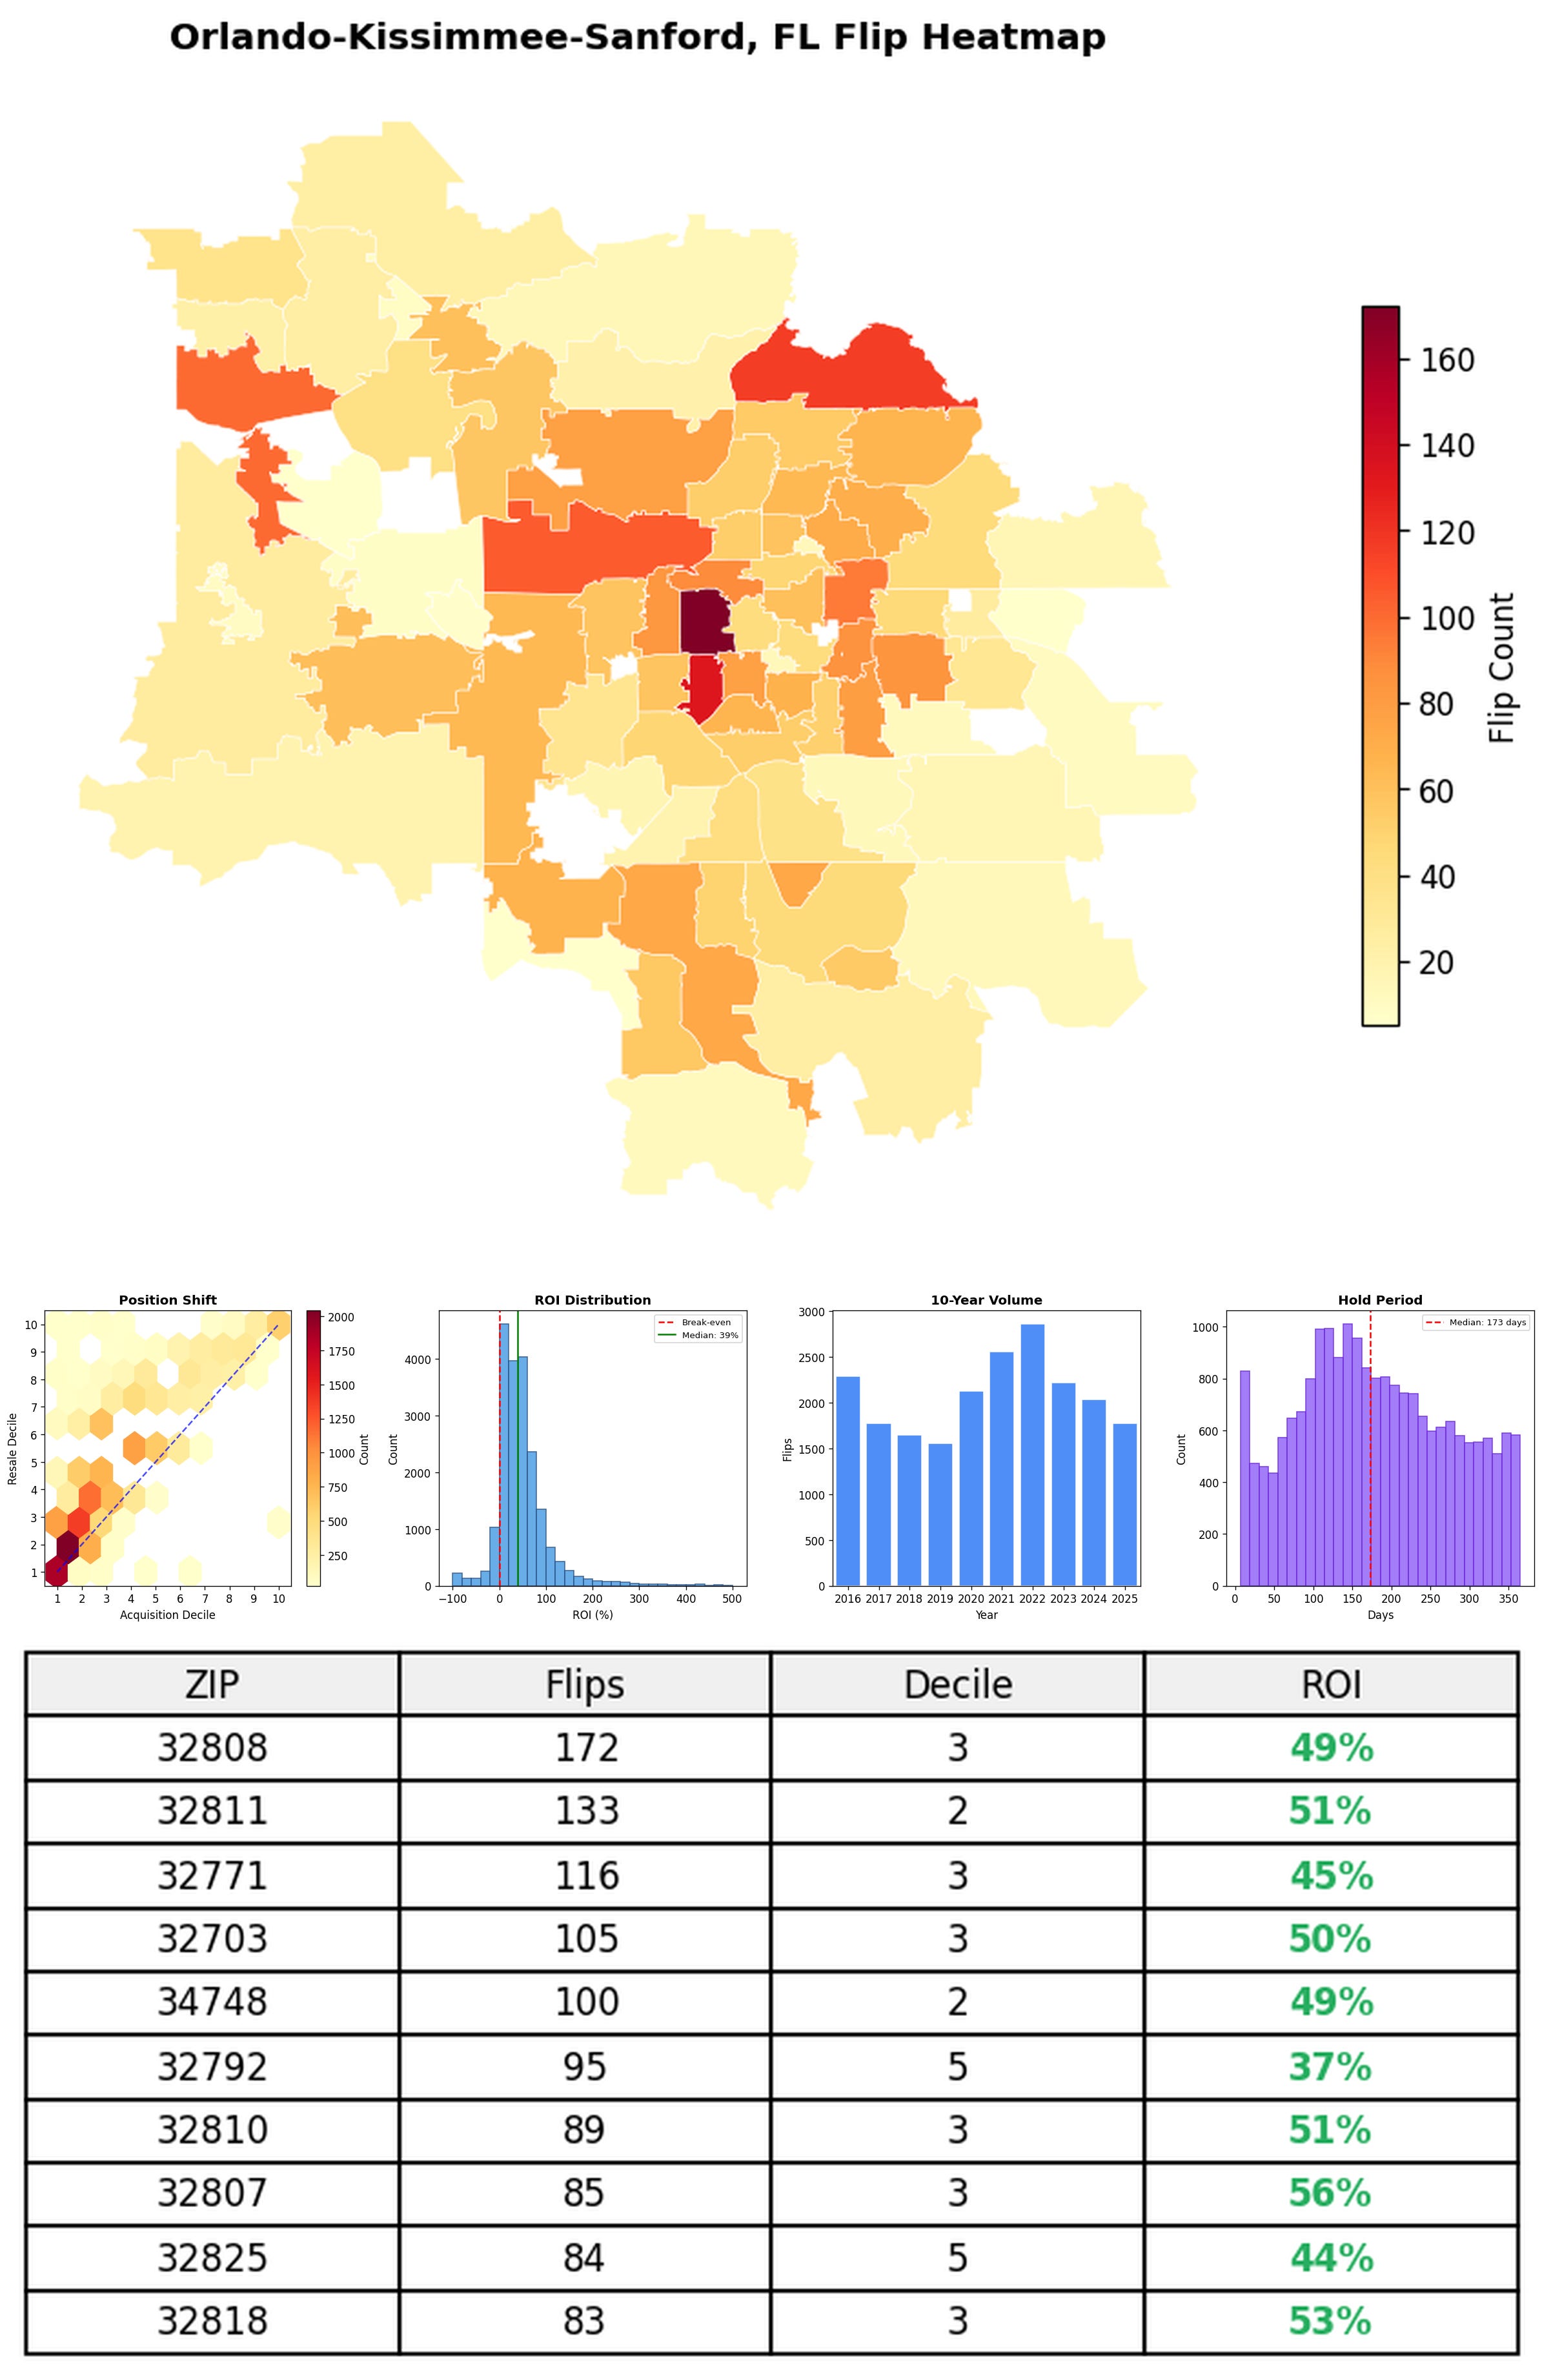
In-Depth Metro Breakdown
In the follow charts we break down the top 100 MSAs and show the top zips flips are happening, their hold times, ROI, acquisition volume over their last decade and more.
The first ~20 metro are free, paid subscribers get access to all 100.
Paid subscribers can see the rest below: