2024 Out-of-State Investor Overview
Analyzing trends in out-of-state investor activity across metros nationwide
Executive Summary
Out-of-state investment in single-family homes remains high despite recent cooling:
Non-resident investors purchased 6.96% of U.S. single-family homes in 2024, maintaining levels well above the pre-pandemic baseline of 5.8% (2019)
While this represents a slight decline from 7.12% in 2023 and a significant drop from the 2021 peak of 8.82%, the persistence of elevated non-local investment suggests a lasting shift in residential real estate market dynamics
Methodology
Our analysis identifies out-of-state investment by comparing property deed locations against owner mailing addresses across state lines. To ensure accuracy in measuring genuine out-of-state investment activity, we apply two key criteria:
Baseline Definition: The property deed location and owner's mailing address must be in different states
Geographic Filter: We exclude transactions where the deed's mailing address falls within a 60-mile radius of the purchased property, even if across state lines
This methodology helps isolate genuine out-of-state investment from routine cross-border transactions in interconnected metropolitan regions
Analysis
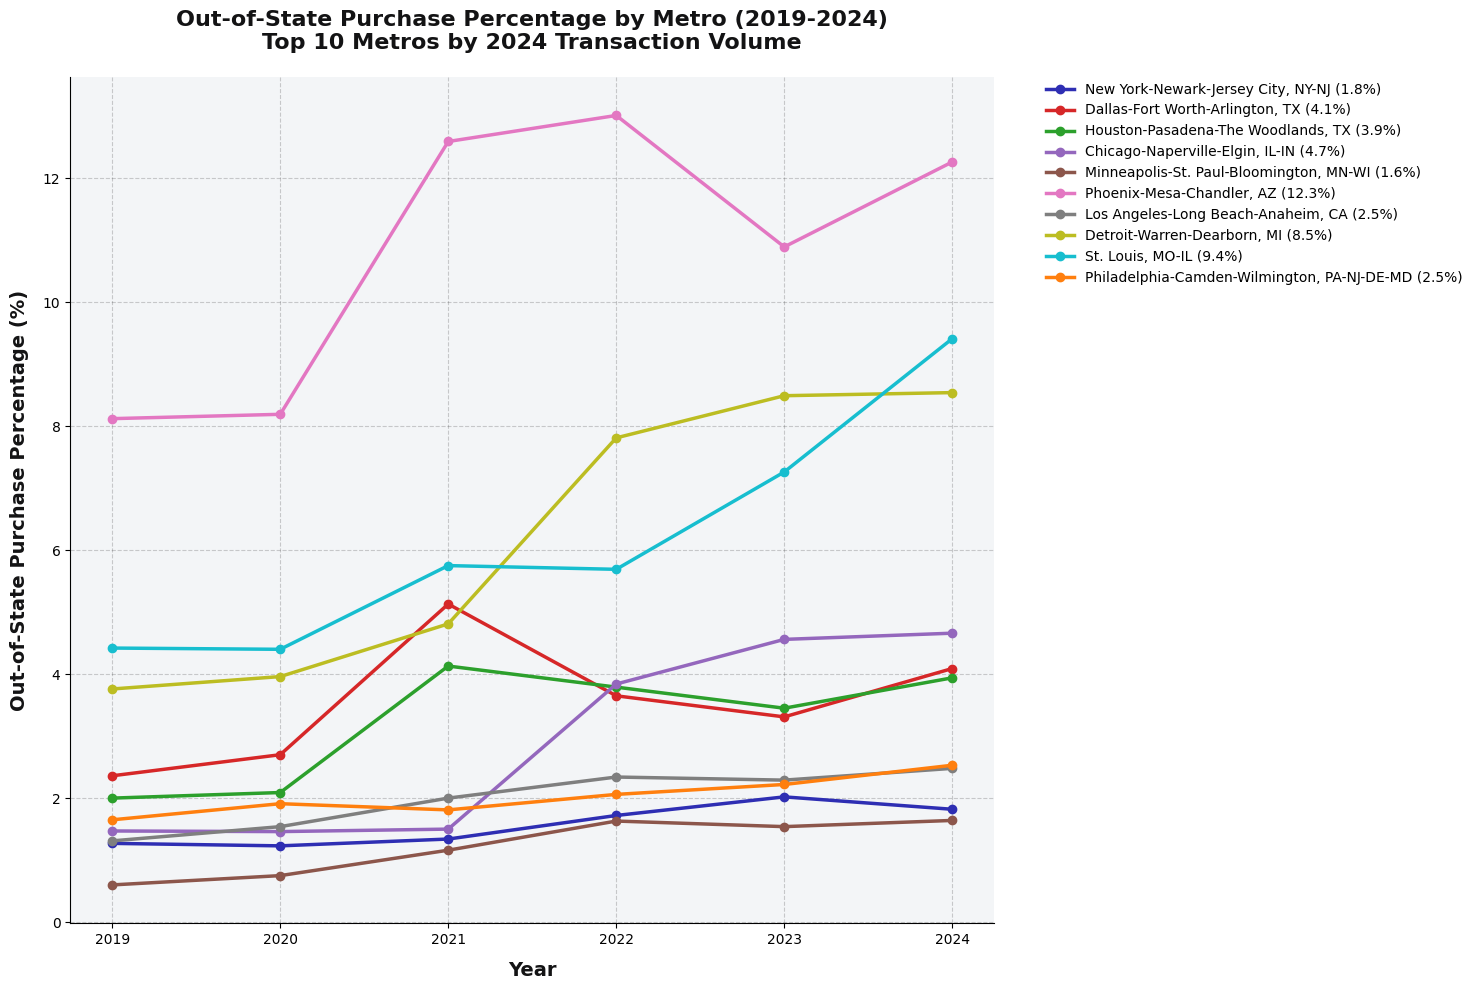
Among the top 10 metropolitan areas by transaction volume, out-of-state investment rates vary dramatically. Phoenix leads with 12.3% of purchases coming from out-of-state buyers, while Minneapolis shows the lowest rate at 1.6% - a more than sevenfold difference between the highest and lowest markets.
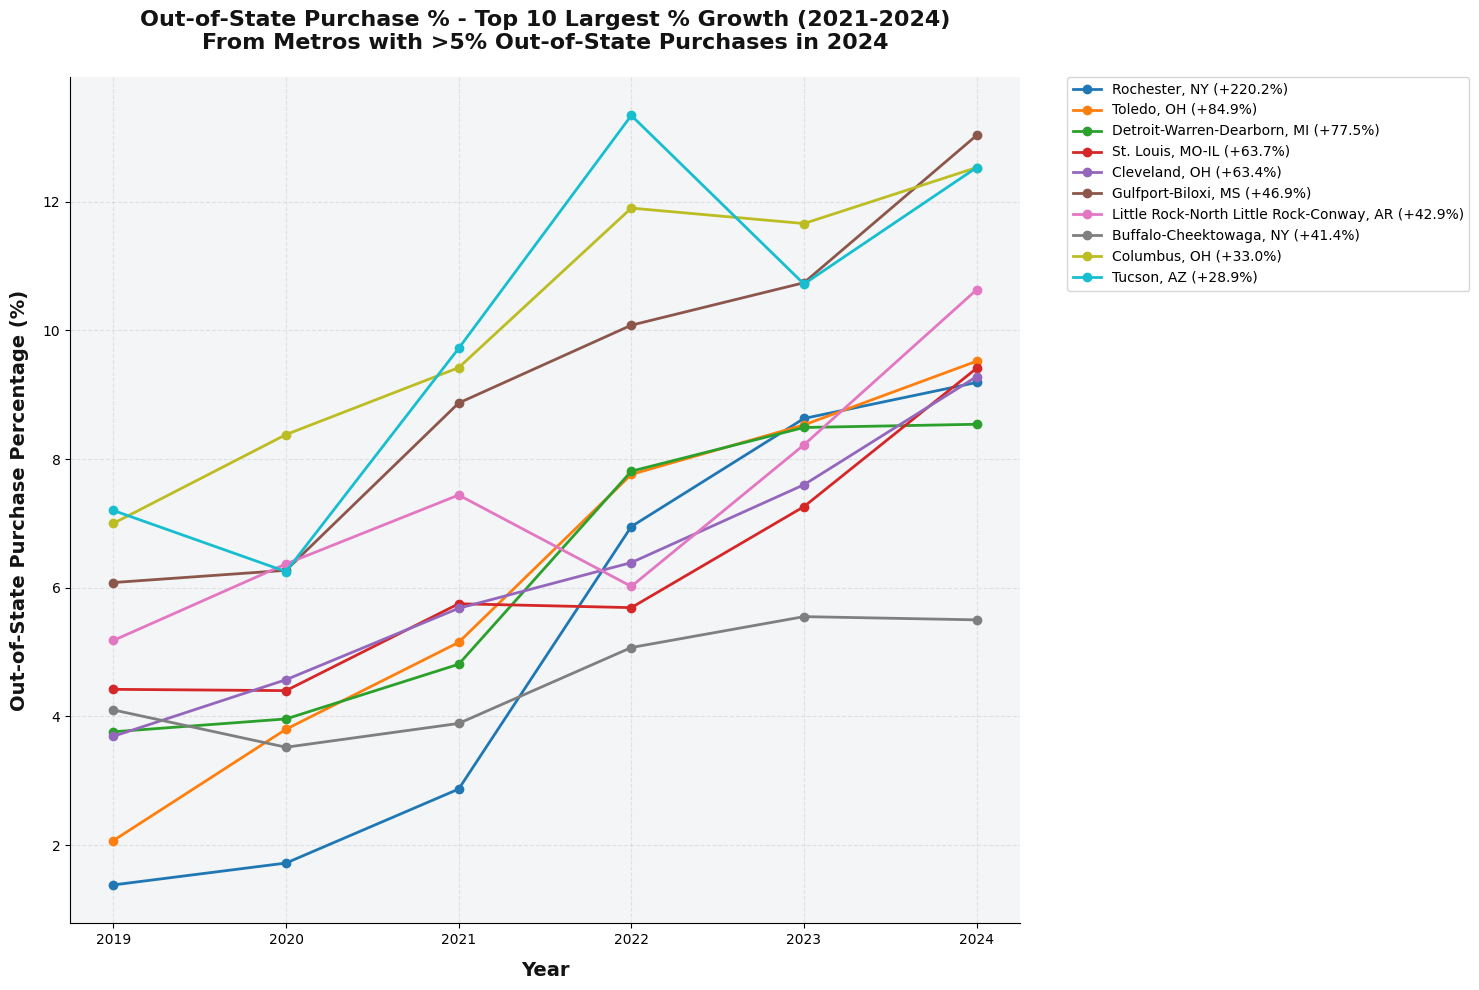
Rust Belt metropolitan areas demonstrate the strongest growth in out-of-state investment activity. Rochester leads this trend with a 220% increase in non-local purchases, exemplifying a broader shift in investor interest toward traditionally industrial markets.
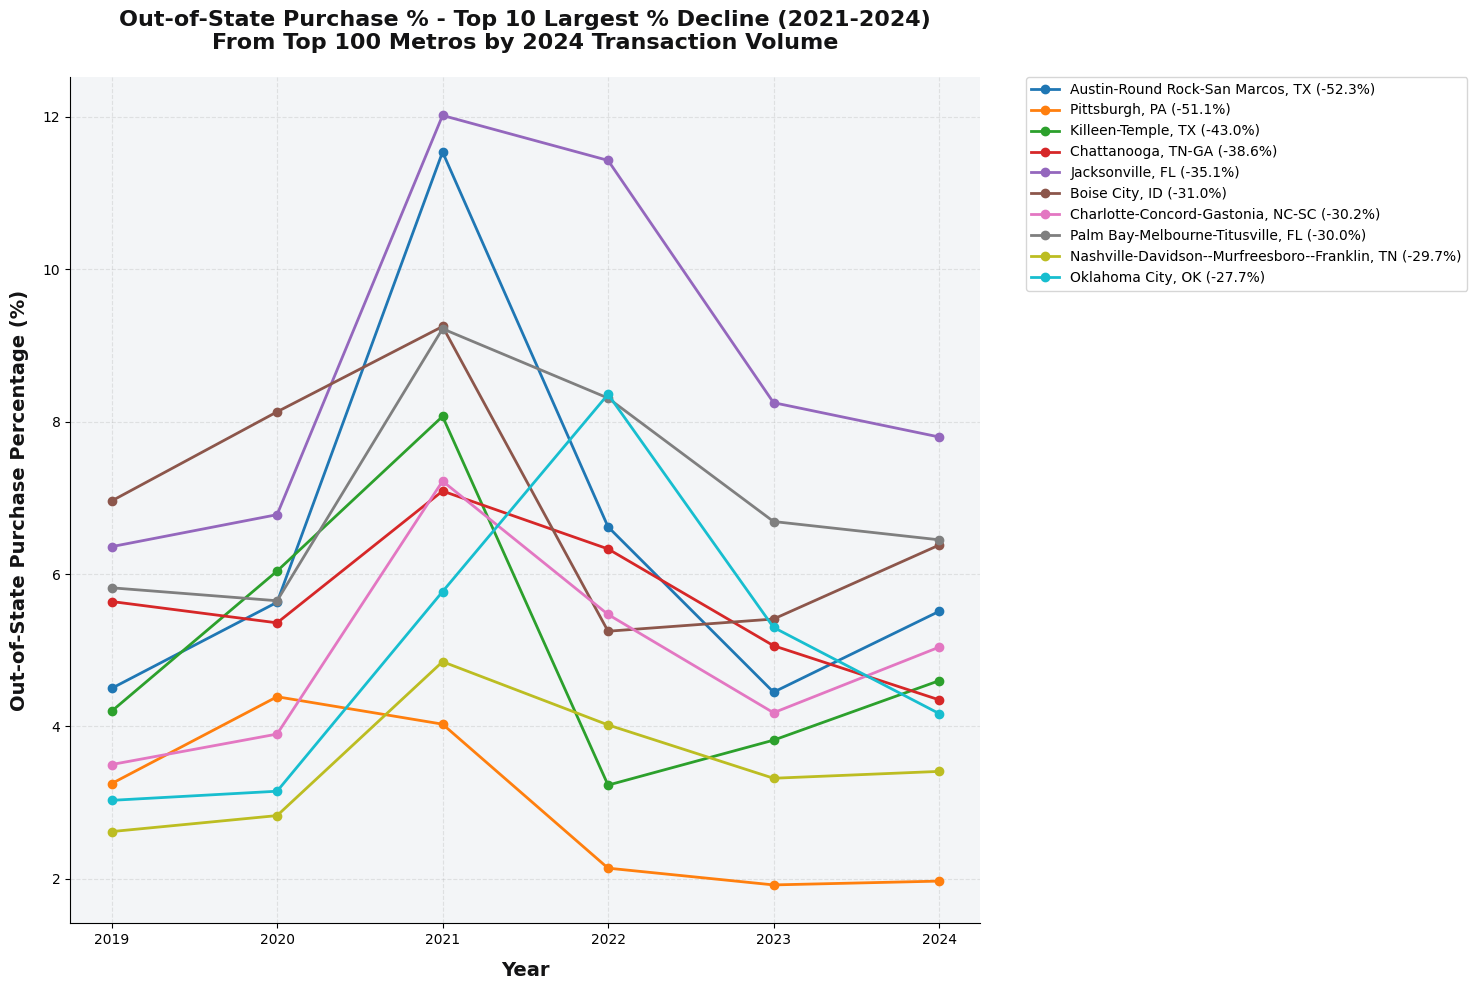
Austin experienced the most significant decline in out-of-state investment activity, coinciding with the market's position as the national leader in rental price decreases. This shift appears connected to changing investment patterns, particularly among West Coast investors who previously viewed Austin as an expansion market but have since scaled back their portfolio growth in the region.
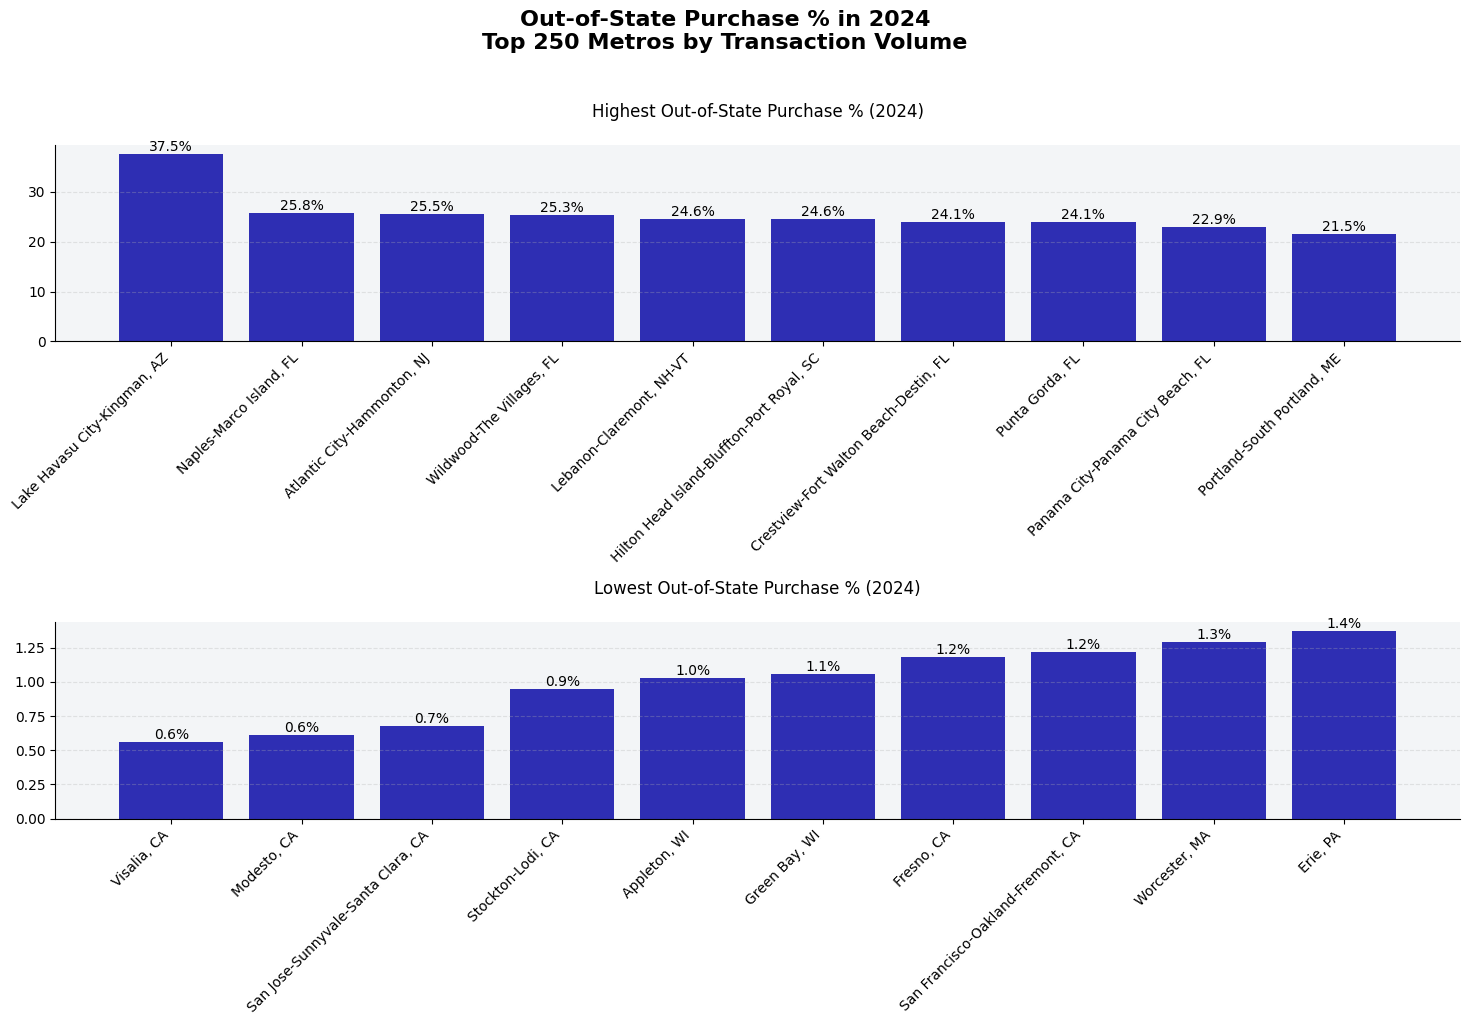
Leisure markets demonstrate the highest concentration of out-of-state purchases in 2024, led by Florida and other vacation destinations. Lake Havasu exemplifies this trend, with non-local buyers accounting for more than one-third of residential transactions. Conversely, California's Central Valley and Wisconsin markets show the lowest rates of out-of-state investment, reflecting stronger local buyer presence in these regions.
Out-of-State Buyer Demographics
Out-of-state purchases can be categorized into three primary segments:
Corporate Investors: Approximately one-third of transactions are conducted by corporate entities
Individual Investors: A significant portion consists of private investors expanding their rental portfolios, as indicated by analysis of multi-property ownership patterns
Vacation Property Buyers: Particularly concentrated in Florida and other leisure markets, these buyers represent a substantial segment of non-local purchases
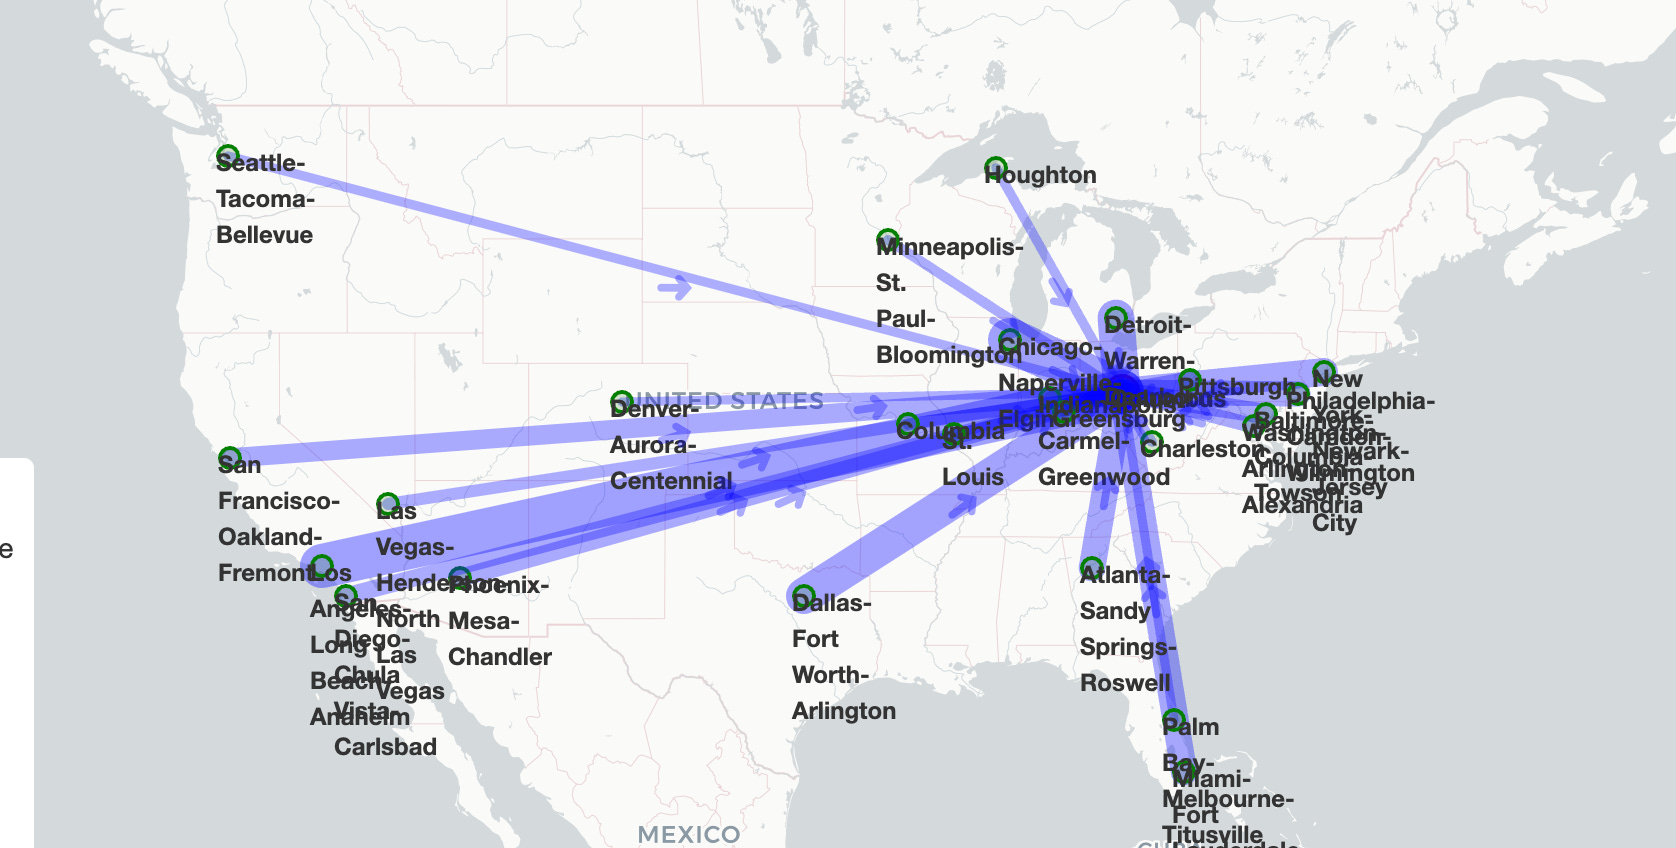
Investment Flow Analysis
Notable Inbound Investment Patterns
Our analysis tracks the origin markets of out-of-state investment, with line width indicating relative transaction volume.
Columbus, Ohio: